
|
|||||
|
 | |
| |
| |
| |
| |
| |
|
Gene: BAX |
Gene summary for BAX |
| Gene information | Species | Human | Gene symbol | BAX | Gene ID | 581 |
| Gene name | BCL2 associated X, apoptosis regulator | |
| Gene Alias | BCL2L4 | |
| Cytomap | 19q13.33 | |
| Gene Type | protein-coding | GO ID | GO:0000003 | UniProtAcc | Q07812 |
Top |
Malignant transformation analysis |
| Identification of the aberrant gene expression in precancerous and cancerous lesions by comparing the gene expression of stem-like cells in diseased tissues with normal stem cells |
| Entrez ID | Symbol | Replicates | Species | Organ | Tissue | Adj P-value | Log2FC | Malignancy |
| 581 | BAX | HTA11_3410_2000001011 | Human | Colorectum | AD | 1.67e-05 | 3.39e-01 | 0.0155 |
| 581 | BAX | HTA11_2487_2000001011 | Human | Colorectum | SER | 4.70e-08 | 4.92e-01 | -0.1808 |
| 581 | BAX | HTA11_2951_2000001011 | Human | Colorectum | AD | 2.02e-04 | 3.85e-01 | 0.0216 |
| 581 | BAX | HTA11_1938_2000001011 | Human | Colorectum | AD | 4.54e-15 | 6.87e-01 | -0.0811 |
| 581 | BAX | HTA11_347_2000001011 | Human | Colorectum | AD | 1.59e-09 | 4.21e-01 | -0.1954 |
| 581 | BAX | HTA11_411_2000001011 | Human | Colorectum | SER | 3.76e-03 | 6.17e-01 | -0.2602 |
| 581 | BAX | HTA11_83_2000001011 | Human | Colorectum | SER | 6.86e-11 | 7.39e-01 | -0.1526 |
| 581 | BAX | HTA11_696_2000001011 | Human | Colorectum | AD | 9.94e-30 | 7.49e-01 | -0.1464 |
| 581 | BAX | HTA11_866_2000001011 | Human | Colorectum | AD | 9.70e-11 | 4.48e-01 | -0.1001 |
| 581 | BAX | HTA11_1391_2000001011 | Human | Colorectum | AD | 1.34e-31 | 1.31e+00 | -0.059 |
| 581 | BAX | HTA11_2992_2000001011 | Human | Colorectum | SER | 2.27e-11 | 7.50e-01 | -0.1706 |
| 581 | BAX | HTA11_5212_2000001011 | Human | Colorectum | AD | 1.51e-02 | 3.67e-01 | -0.2061 |
| 581 | BAX | HTA11_546_2000001011 | Human | Colorectum | AD | 1.75e-04 | 3.89e-01 | -0.0842 |
| 581 | BAX | HTA11_866_3004761011 | Human | Colorectum | AD | 2.18e-22 | 7.38e-01 | 0.096 |
| 581 | BAX | HTA11_4255_2000001011 | Human | Colorectum | SER | 1.53e-05 | 6.68e-01 | 0.0446 |
| 581 | BAX | HTA11_9408_2000001011 | Human | Colorectum | AD | 1.08e-02 | 5.11e-01 | 0.0451 |
| 581 | BAX | HTA11_8622_2000001021 | Human | Colorectum | SER | 4.16e-03 | 6.17e-01 | 0.0528 |
| 581 | BAX | HTA11_7663_2000001011 | Human | Colorectum | SER | 1.90e-02 | 6.33e-01 | 0.0131 |
| 581 | BAX | HTA11_10711_2000001011 | Human | Colorectum | AD | 1.39e-05 | 5.37e-01 | 0.0338 |
| 581 | BAX | HTA11_7696_3000711011 | Human | Colorectum | AD | 2.01e-19 | 5.91e-01 | 0.0674 |
| Page: 1 2 3 4 5 6 7 8 9 10 |
| Tissue | Expression Dynamics | Abbreviation |
| Colorectum (GSE201348) |  | FAP: Familial adenomatous polyposis |
| CRC: Colorectal cancer | ||
| Colorectum (HTA11) | 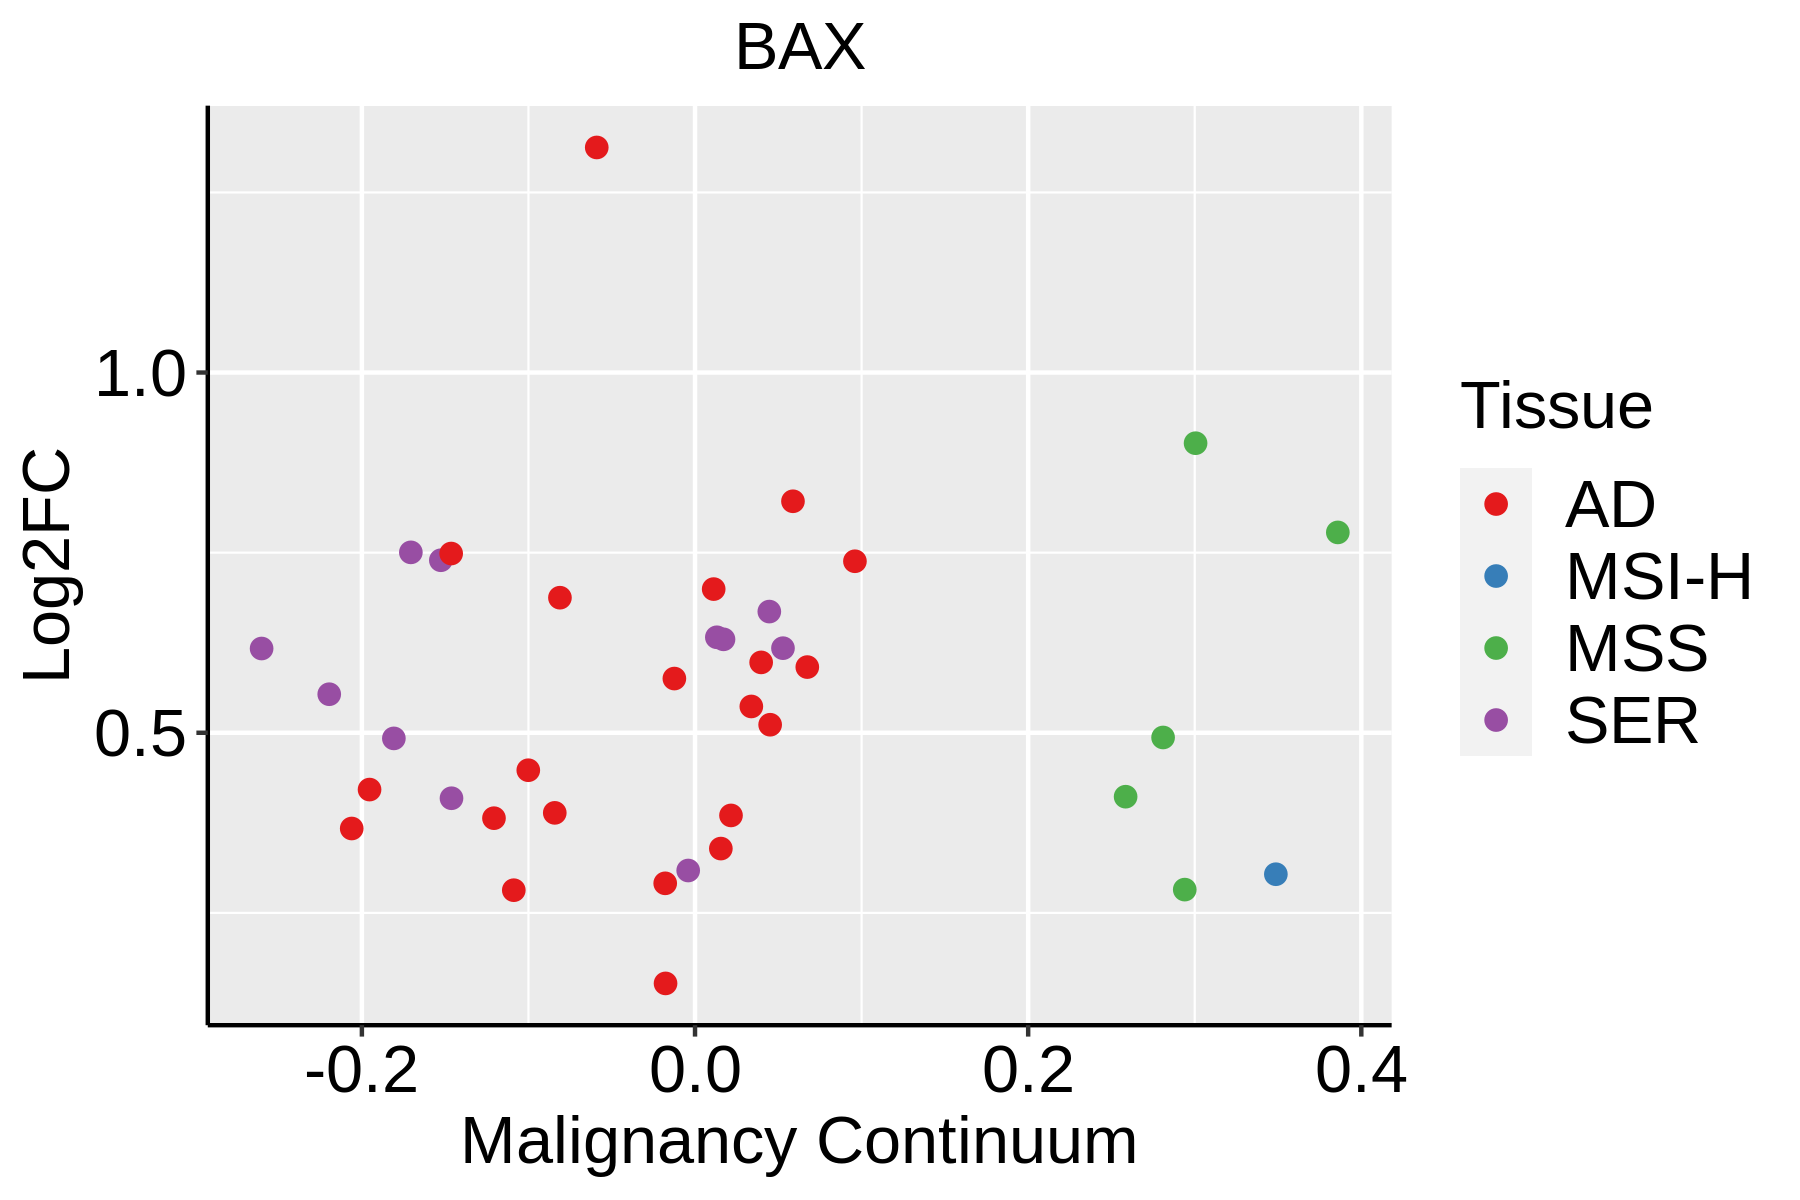 | AD: Adenomas |
| SER: Sessile serrated lesions | ||
| MSI-H: Microsatellite-high colorectal cancer | ||
| MSS: Microsatellite stable colorectal cancer | ||
| Esophagus | 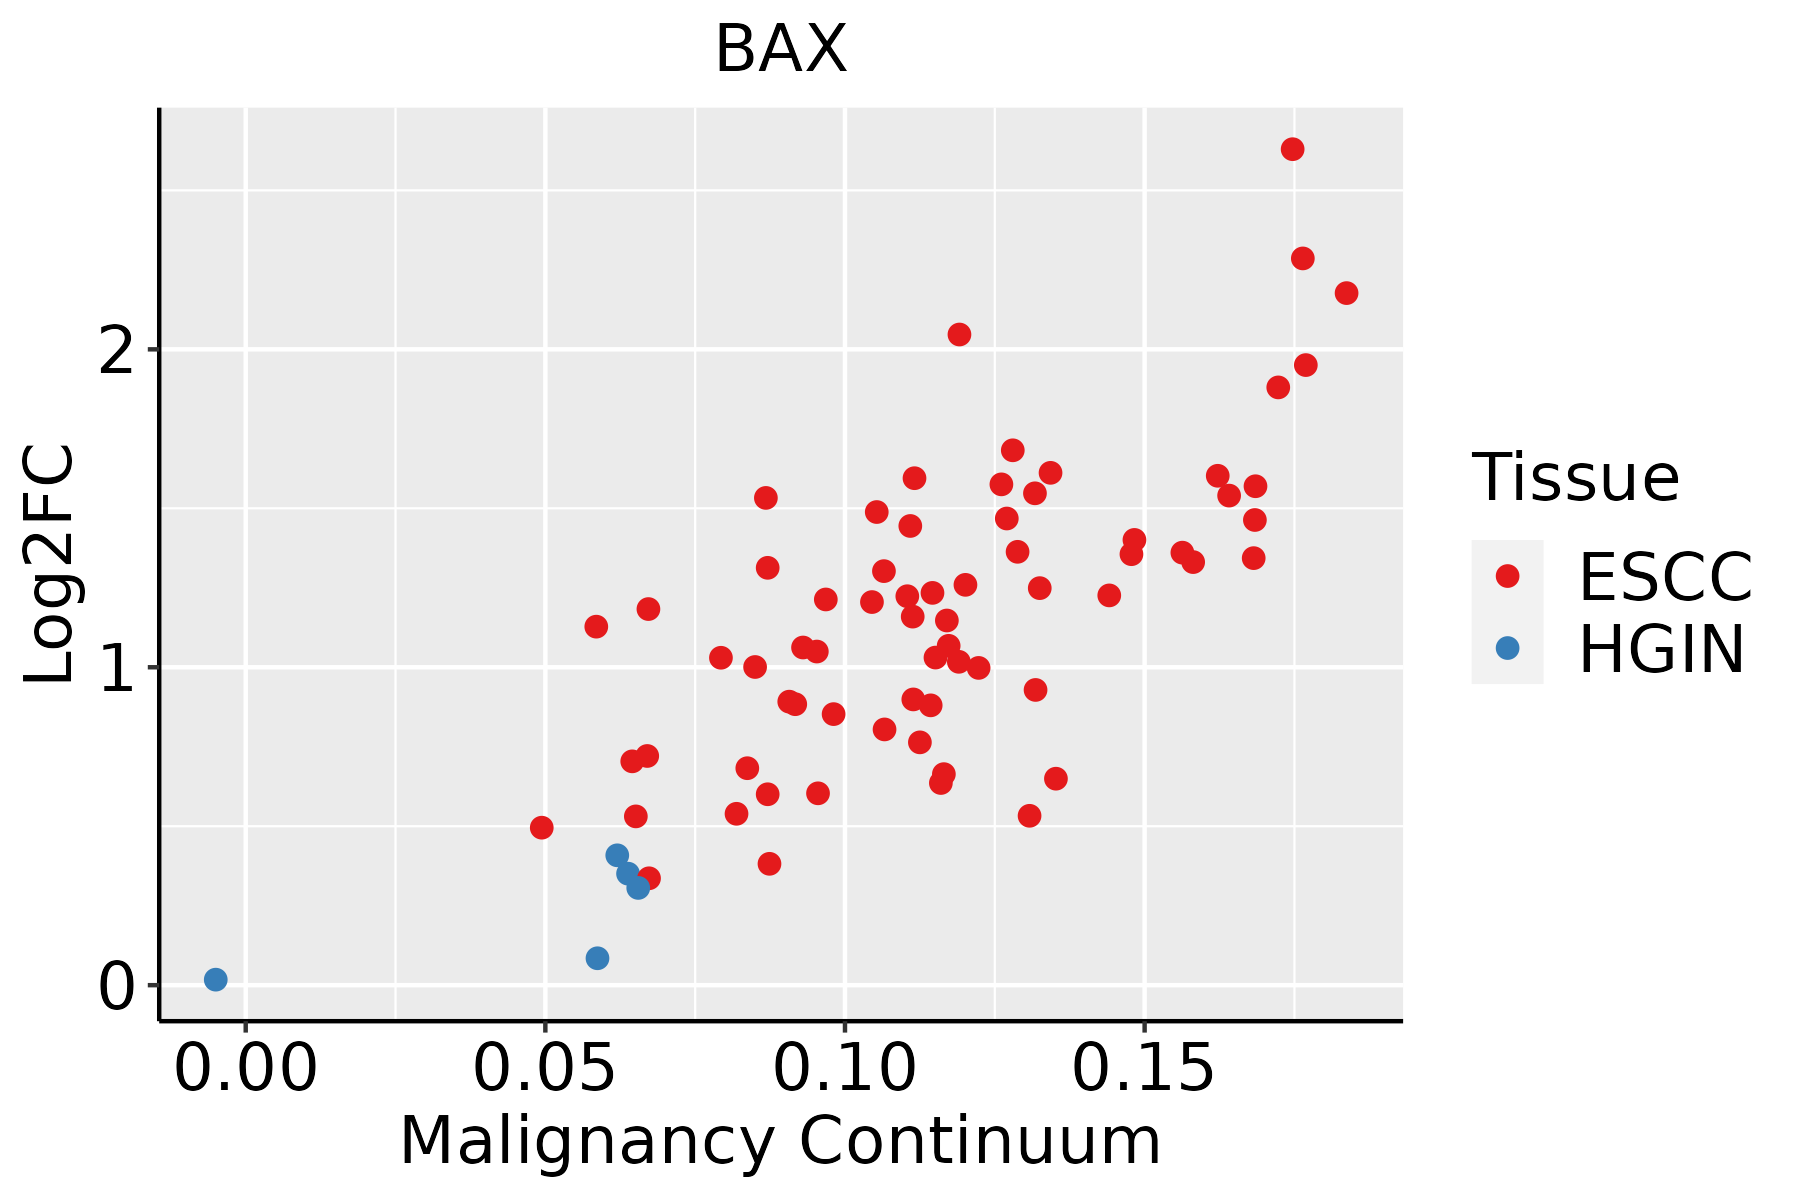 | ESCC: Esophageal squamous cell carcinoma |
| HGIN: High-grade intraepithelial neoplasias | ||
| LGIN: Low-grade intraepithelial neoplasias | ||
| GC | 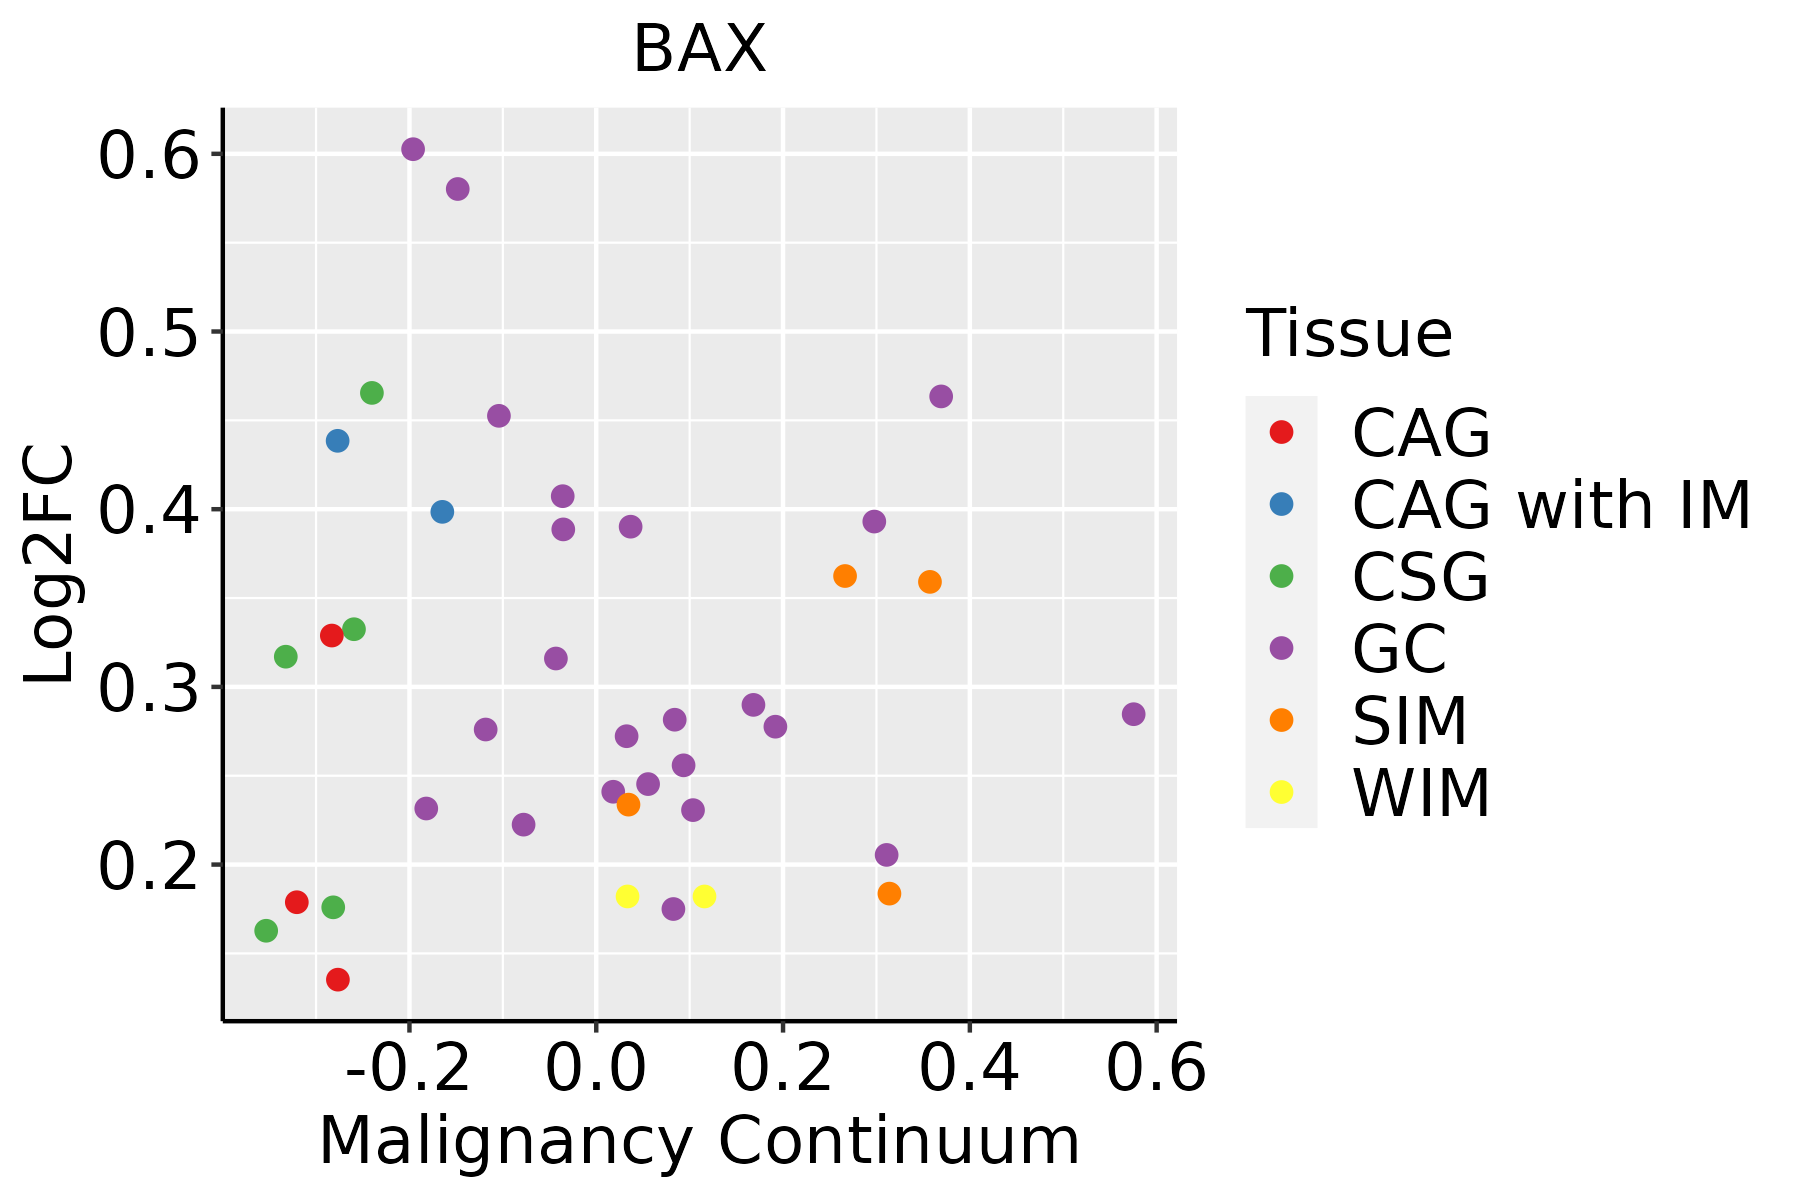 | CAG: Chronic atrophic gastritis |
| CAG with IM: Chronic atrophic gastritis with intestinal metaplasia | ||
| CSG: Chronic superficial gastritis | ||
| GC: Gastric cancer | ||
| SIM: Severe intestinal metaplasia | ||
| WIM: Wild intestinal metaplasia | ||
| Liver | 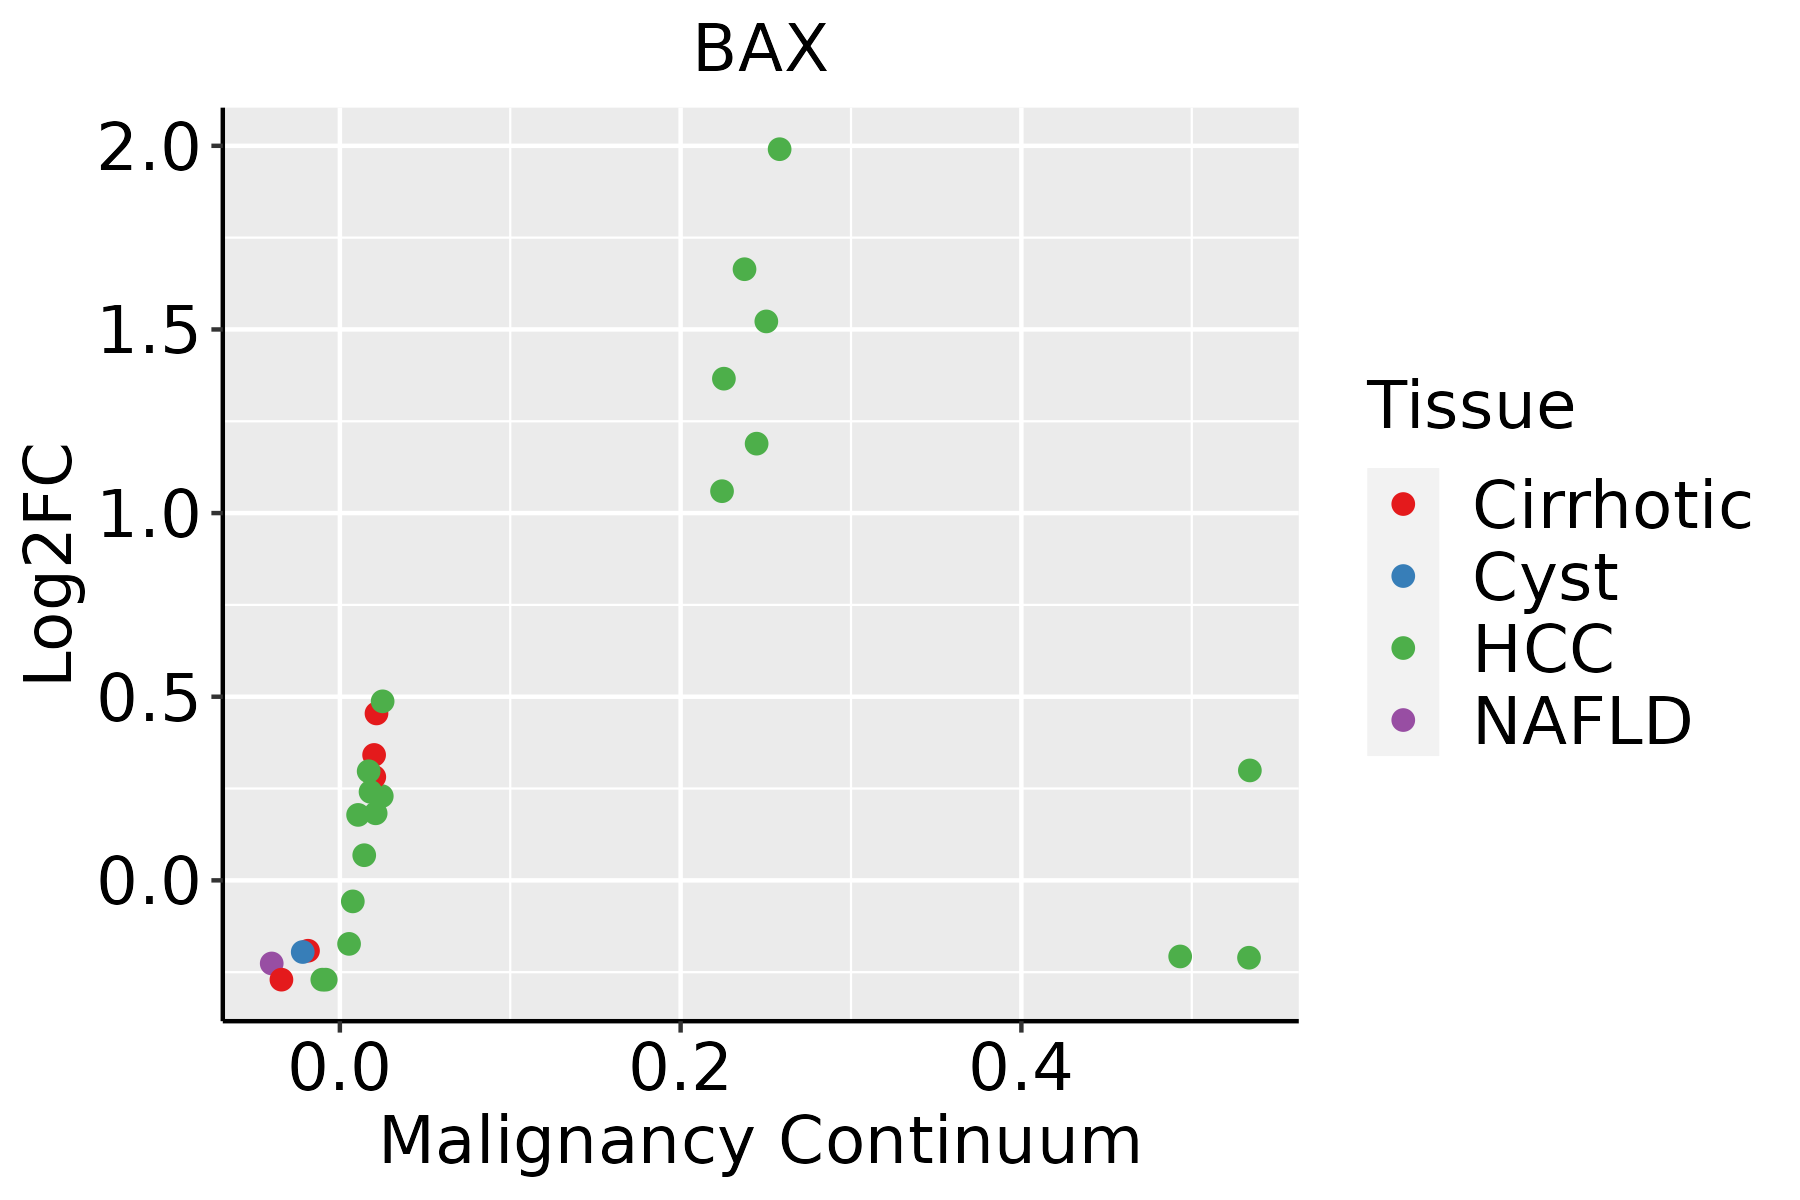 | HCC: Hepatocellular carcinoma |
| NAFLD: Non-alcoholic fatty liver disease | ||
| Oral Cavity | 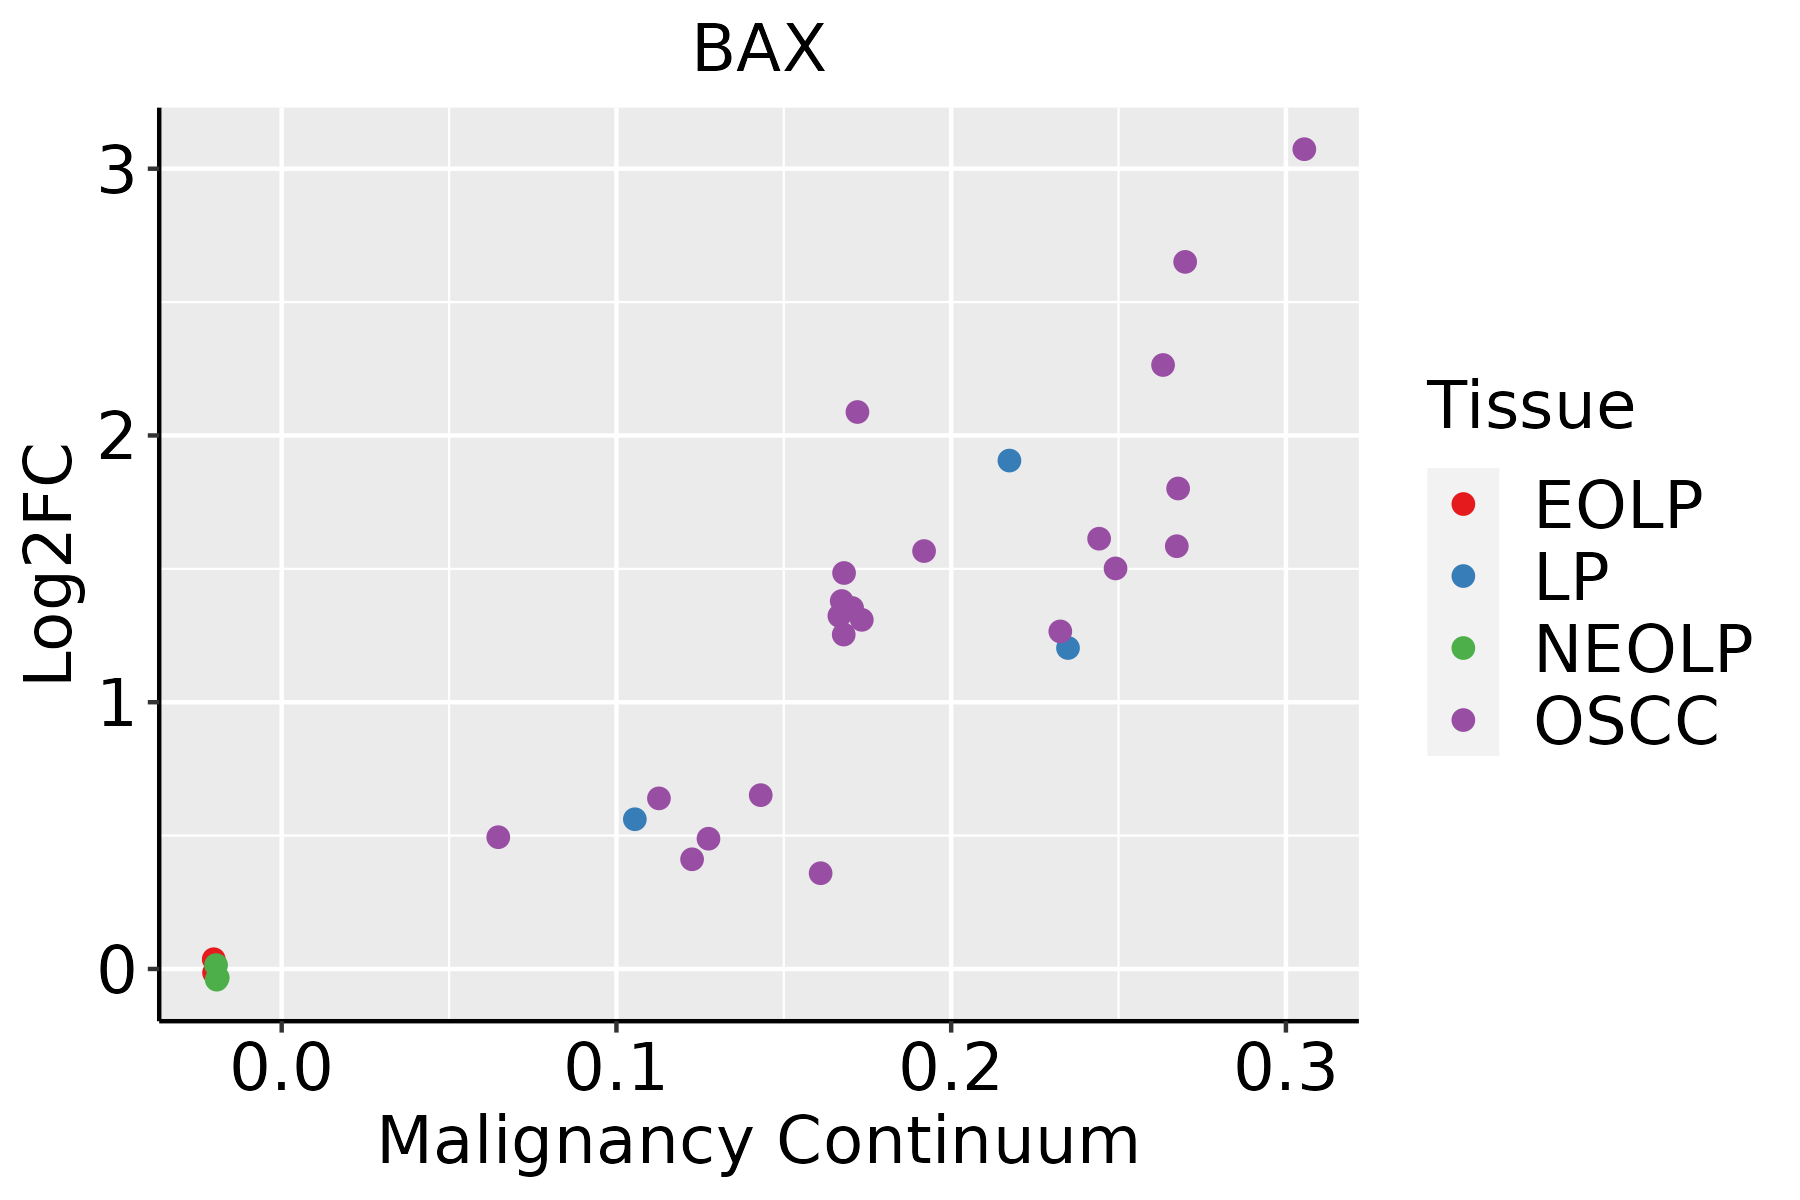 | EOLP: Erosive Oral lichen planus |
| LP: leukoplakia | ||
| NEOLP: Non-erosive oral lichen planus | ||
| OSCC: Oral squamous cell carcinoma | ||
| Skin |  | AK: Actinic keratosis |
| cSCC: Cutaneous squamous cell carcinoma | ||
| SCCIS:squamous cell carcinoma in situ | ||
| Thyroid | 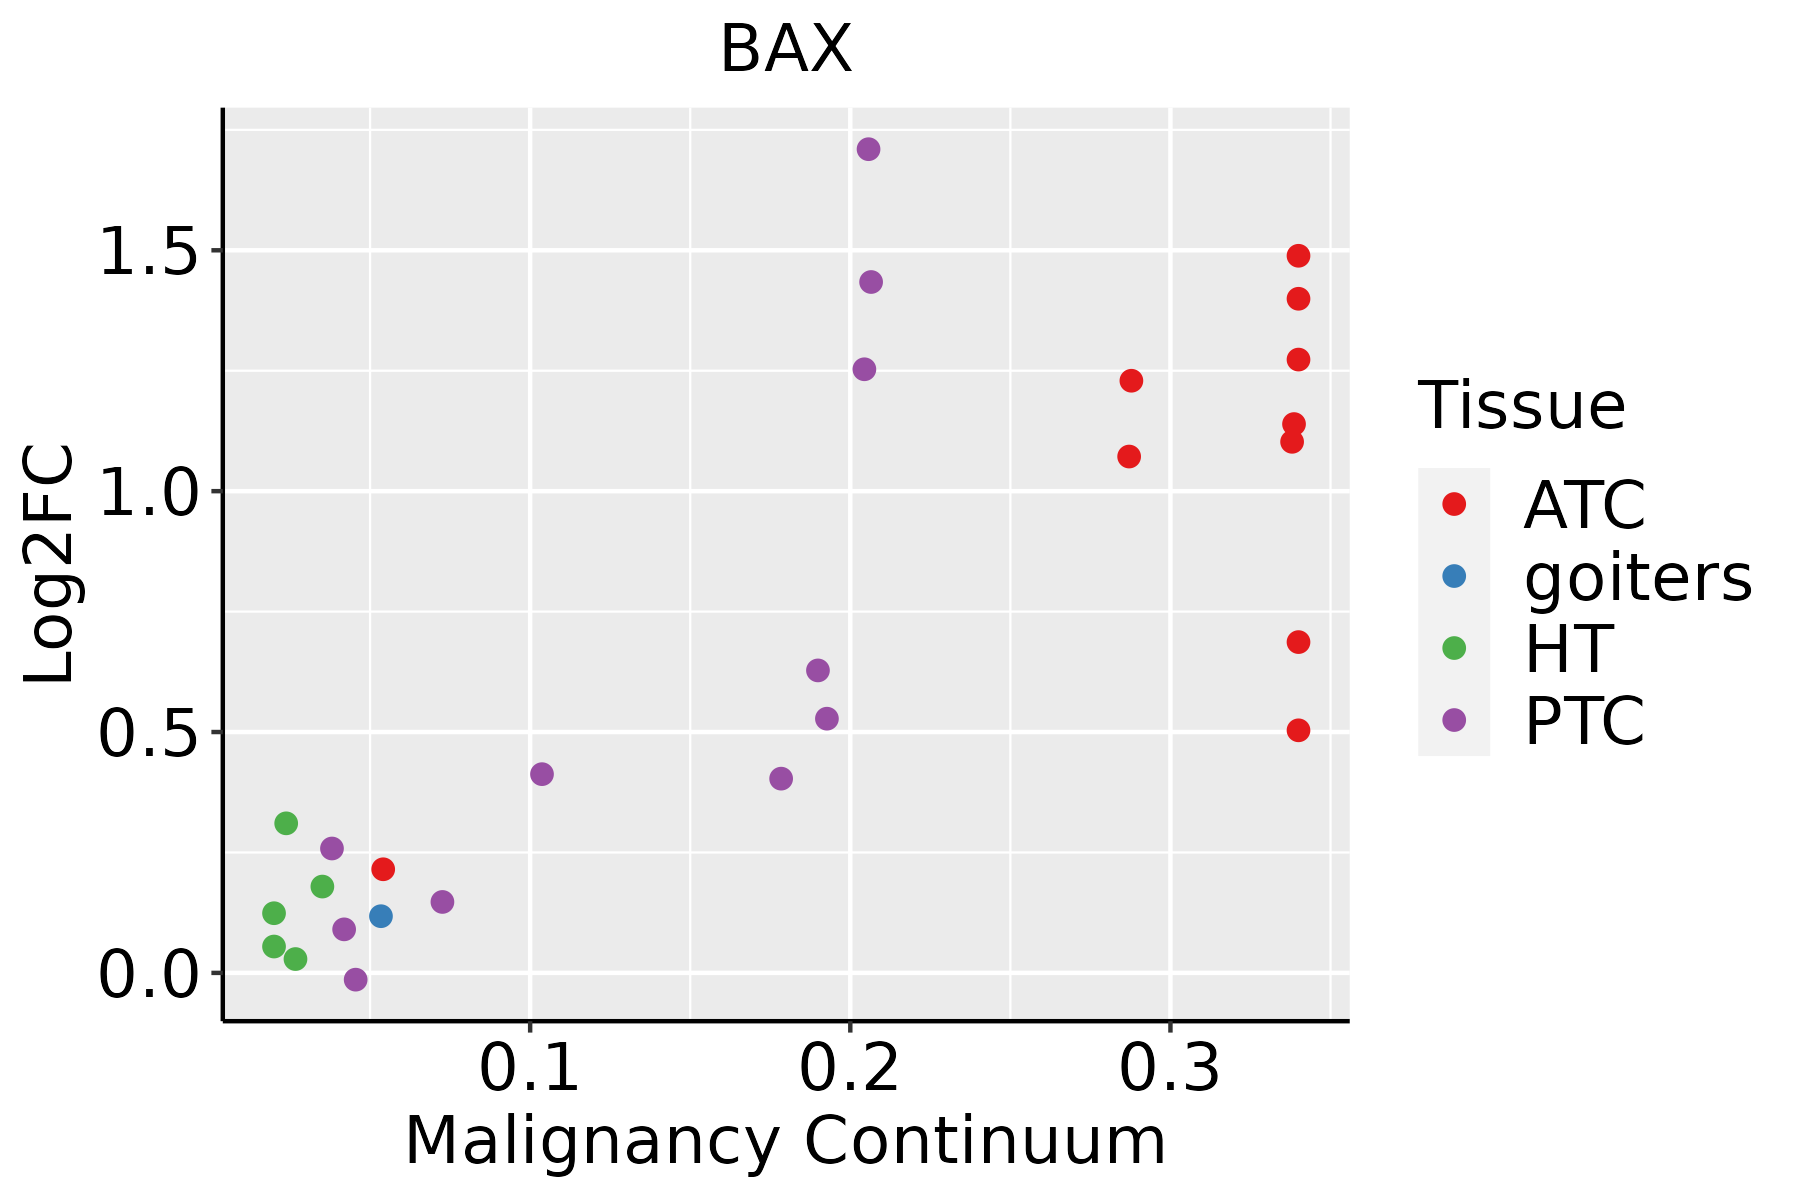 | ATC: Anaplastic thyroid cancer |
| HT: Hashimoto's thyroiditis | ||
| PTC: Papillary thyroid cancer |
| ∗log2FC in expression of this searched gene in stem-like cells from each diseased tissue sample relative to stem-like cells in normal samples in each tissue plotted against the malignancy continuum. Samples are colored based on if they are from different disease stage. |
Top |
Malignant transformation related pathway analysis |
| Find out the enriched GO biological processes and KEGG pathways involved in transition from healthy to precancer to cancer |
| Tissue | Disease Stage | Enriched GO biological Processes |
| Colorectum | AD |  |
| Colorectum | SER |  |
| Colorectum | MSS |  |
| Colorectum | MSI-H |  |
| Colorectum | FAP |  |
| ∗Top 15 enriched GO BP terms are showed in the bar plot of each disease state in each tissue. Each row represents a significant GO biological process which is colored according to the -log10(p.adjust). |
| Page: 1 2 3 4 5 6 7 8 9 |
| GO ID | Tissue | Disease Stage | Description | Gene Ratio | Bg Ratio | pvalue | p.adjust | Count |
| GO:005165121 | Stomach | CSG | maintenance of location in cell | 27/1034 | 214/18723 | 5.28e-05 | 1.35e-03 | 27 |
| GO:000226221 | Stomach | CSG | myeloid cell homeostasis | 22/1034 | 157/18723 | 5.30e-05 | 1.35e-03 | 22 |
| GO:000700621 | Stomach | CSG | mitochondrial membrane organization | 18/1034 | 116/18723 | 6.51e-05 | 1.61e-03 | 18 |
| GO:00421102 | Stomach | CSG | T cell activation | 48/1034 | 487/18723 | 7.39e-05 | 1.78e-03 | 48 |
| GO:004339321 | Stomach | CSG | regulation of protein binding | 25/1034 | 196/18723 | 8.25e-05 | 1.95e-03 | 25 |
| GO:00086252 | Stomach | CSG | extrinsic apoptotic signaling pathway via death domain receptors | 14/1034 | 82/18723 | 1.46e-04 | 3.03e-03 | 14 |
| GO:004690221 | Stomach | CSG | regulation of mitochondrial membrane permeability | 12/1034 | 63/18723 | 1.48e-04 | 3.03e-03 | 12 |
| GO:007259421 | Stomach | CSG | establishment of protein localization to organelle | 42/1034 | 422/18723 | 1.65e-04 | 3.28e-03 | 42 |
| GO:004873221 | Stomach | CSG | gland development | 43/1034 | 436/18723 | 1.70e-04 | 3.33e-03 | 43 |
| GO:003133121 | Stomach | CSG | positive regulation of cellular catabolic process | 42/1034 | 427/18723 | 2.13e-04 | 4.04e-03 | 42 |
| GO:001095221 | Stomach | CSG | positive regulation of peptidase activity | 24/1034 | 197/18723 | 2.31e-04 | 4.31e-03 | 24 |
| GO:007233221 | Stomach | CSG | intrinsic apoptotic signaling pathway by p53 class mediator | 13/1034 | 76/18723 | 2.45e-04 | 4.49e-03 | 13 |
| GO:00973452 | Stomach | CSG | mitochondrial outer membrane permeabilization | 8/1034 | 32/18723 | 2.70e-04 | 4.82e-03 | 8 |
| GO:00435252 | Stomach | CSG | positive regulation of neuron apoptotic process | 11/1034 | 58/18723 | 2.87e-04 | 5.07e-03 | 11 |
| GO:00506782 | Stomach | CSG | regulation of epithelial cell proliferation | 38/1034 | 381/18723 | 3.18e-04 | 5.42e-03 | 38 |
| GO:000989621 | Stomach | CSG | positive regulation of catabolic process | 46/1034 | 492/18723 | 3.45e-04 | 5.74e-03 | 46 |
| GO:001095021 | Stomach | CSG | positive regulation of endopeptidase activity | 22/1034 | 179/18723 | 3.65e-04 | 5.98e-03 | 22 |
| GO:00706612 | Stomach | CSG | leukocyte proliferation | 33/1034 | 318/18723 | 3.81e-04 | 6.23e-03 | 33 |
| GO:00093142 | Stomach | CSG | response to radiation | 43/1034 | 456/18723 | 4.45e-04 | 6.98e-03 | 43 |
| GO:00357942 | Stomach | CSG | positive regulation of mitochondrial membrane permeability | 9/1034 | 43/18723 | 4.75e-04 | 7.39e-03 | 9 |
| Page: 1 2 3 4 5 6 7 8 9 10 11 12 13 14 15 16 17 18 19 20 21 22 23 24 25 26 27 28 29 30 31 32 33 34 35 36 37 38 39 40 41 42 43 44 45 46 47 48 49 50 51 52 53 54 55 56 57 58 59 60 61 62 63 64 65 66 67 68 69 70 71 72 73 74 75 76 77 78 79 80 81 82 83 84 85 86 87 88 89 90 91 92 93 |
| Pathway ID | Tissue | Disease Stage | Description | Gene Ratio | Bg Ratio | pvalue | p.adjust | qvalue | Count |
| hsa05012 | Colorectum | AD | Parkinson disease | 147/2092 | 266/8465 | 2.53e-27 | 8.48e-25 | 5.41e-25 | 147 |
| hsa05016 | Colorectum | AD | Huntington disease | 147/2092 | 306/8465 | 1.93e-19 | 9.26e-18 | 5.91e-18 | 147 |
| hsa04932 | Colorectum | AD | Non-alcoholic fatty liver disease | 90/2092 | 155/8465 | 4.83e-19 | 1.80e-17 | 1.15e-17 | 90 |
| hsa05020 | Colorectum | AD | Prion disease | 133/2092 | 273/8465 | 2.47e-18 | 8.29e-17 | 5.29e-17 | 133 |
| hsa05014 | Colorectum | AD | Amyotrophic lateral sclerosis | 164/2092 | 364/8465 | 4.28e-18 | 1.27e-16 | 8.09e-17 | 164 |
| hsa05022 | Colorectum | AD | Pathways of neurodegeneration - multiple diseases | 201/2092 | 476/8465 | 4.54e-18 | 1.27e-16 | 8.09e-17 | 201 |
| hsa05131 | Colorectum | AD | Shigellosis | 109/2092 | 247/8465 | 1.09e-11 | 2.44e-10 | 1.55e-10 | 109 |
| hsa04141 | Colorectum | AD | Protein processing in endoplasmic reticulum | 80/2092 | 174/8465 | 5.96e-10 | 1.25e-08 | 7.96e-09 | 80 |
| hsa05132 | Colorectum | AD | Salmonella infection | 102/2092 | 249/8465 | 7.65e-09 | 1.28e-07 | 8.17e-08 | 102 |
| hsa05130 | Colorectum | AD | Pathogenic Escherichia coli infection | 79/2092 | 197/8465 | 1.05e-06 | 1.36e-05 | 8.65e-06 | 79 |
| hsa04722 | Colorectum | AD | Neurotrophin signaling pathway | 50/2092 | 119/8465 | 2.28e-05 | 2.24e-04 | 1.43e-04 | 50 |
| hsa05213 | Colorectum | AD | Endometrial cancer | 29/2092 | 58/8465 | 2.69e-05 | 2.57e-04 | 1.64e-04 | 29 |
| hsa05210 | Colorectum | AD | Colorectal cancer | 35/2092 | 86/8465 | 7.54e-04 | 5.49e-03 | 3.50e-03 | 35 |
| hsa05417 | Colorectum | AD | Lipid and atherosclerosis | 73/2092 | 215/8465 | 1.31e-03 | 8.27e-03 | 5.27e-03 | 73 |
| hsa05170 | Colorectum | AD | Human immunodeficiency virus 1 infection | 72/2092 | 212/8465 | 1.40e-03 | 8.46e-03 | 5.39e-03 | 72 |
| hsa05220 | Colorectum | AD | Chronic myeloid leukemia | 31/2092 | 76/8465 | 1.41e-03 | 8.46e-03 | 5.39e-03 | 31 |
| hsa05225 | Colorectum | AD | Hepatocellular carcinoma | 59/2092 | 168/8465 | 1.50e-03 | 8.69e-03 | 5.54e-03 | 59 |
| hsa05163 | Colorectum | AD | Human cytomegalovirus infection | 75/2092 | 225/8465 | 2.00e-03 | 1.10e-02 | 7.01e-03 | 75 |
| hsa04071 | Colorectum | AD | Sphingolipid signaling pathway | 43/2092 | 121/8465 | 4.83e-03 | 2.28e-02 | 1.45e-02 | 43 |
| hsa05166 | Colorectum | AD | Human T-cell leukemia virus 1 infection | 72/2092 | 222/8465 | 5.24e-03 | 2.44e-02 | 1.55e-02 | 72 |
| Page: 1 2 3 4 5 6 7 8 9 10 11 12 13 14 15 16 17 18 19 20 21 22 23 24 25 26 27 28 29 30 31 32 33 34 |
Top |
Cell-cell communication analysis |
| Identification of potential cell-cell interactions between two cell types and their ligand-receptor pairs for different disease states |
| Ligand | Receptor | LRpair | Pathway | Tissue | Disease Stage |
| Page: 1 |
Top |
Single-cell gene regulatory network inference analysis |
| Find out the significant the regulons (TFs) and the target genes of each regulon across cell types for different disease states |
| TF | Cell Type | Tissue | Disease Stage | Target Gene | RSS | Regulon Activity |
| ∗The dot plots of a searched regulon are shown for all cell subpopulations in each disease state of each tissue based on the regulon specific score inferred using pySCENIC and by calculating the average expression. |
| Page: 1 |
Top |
Somatic mutation of malignant transformation related genes |
| Annotation of somatic variants for genes involved in malignant transformation |
| Hugo Symbol | Variant Class | Variant Classification | dbSNP RS | HGVSc | HGVSp | HGVSp Short | SWISSPROT | BIOTYPE | SIFT | PolyPhen | Tumor Sample Barcode | Tissue | Histology | Sex | Age | Stage | Therapy Types | Drugs | Outcome |
| BAX | SNV | Missense_Mutation | c.391N>A | p.Glu131Lys | p.E131K | Q07812 | protein_coding | tolerated(0.15) | possibly_damaging(0.708) | TCGA-AC-A23H-01 | Breast | breast invasive carcinoma | Female | >=65 | I/II | Unknown | Unknown | PD | |
| BAX | SNV | Missense_Mutation | c.399C>G | p.Ile133Met | p.I133M | Q07812 | protein_coding | deleterious(0) | possibly_damaging(0.881) | TCGA-AN-A0FW-01 | Breast | breast invasive carcinoma | Female | >=65 | III/IV | Unknown | Unknown | SD | |
| BAX | SNV | Missense_Mutation | rs202190487 | c.266N>A | p.Arg89Gln | p.R89Q | Q07812 | protein_coding | tolerated(0.54) | benign(0.132) | TCGA-UU-A93S-01 | Breast | breast invasive carcinoma | Female | <65 | III/IV | Unknown | Unknown | PD |
| BAX | deletion | Frame_Shift_Del | c.260delN | p.Arg89GlufsTer44 | p.R89Efs*44 | Q07812 | protein_coding | TCGA-AN-A0AK-01 | Breast | breast invasive carcinoma | Female | >=65 | I/II | Unknown | Unknown | SD | |||
| BAX | deletion | Frame_Shift_Del | novel | c.274delN | p.Phe93SerfsTer40 | p.F93Sfs*40 | Q07812 | protein_coding | TCGA-EW-A2FV-01 | Breast | breast invasive carcinoma | Female | <65 | III/IV | Chemotherapy | docetaxel | SD | ||
| BAX | SNV | Missense_Mutation | novel | c.556N>G | p.Pro186Ala | p.P186A | Q07812 | protein_coding | tolerated_low_confidence(0.2) | benign(0.077) | TCGA-VS-A9UD-01 | Cervix | cervical & endocervical cancer | Female | >=65 | III/IV | Chemotherapy | cisplatin | CR |
| BAX | SNV | Missense_Mutation | c.399N>G | p.Ile133Met | p.I133M | Q07812 | protein_coding | deleterious(0) | possibly_damaging(0.881) | TCGA-A6-5657-01 | Colorectum | colon adenocarcinoma | Male | >=65 | III/IV | Ancillary | leucovorin | SD | |
| BAX | SNV | Missense_Mutation | c.417N>T | p.Trp139Cys | p.W139C | Q07812 | protein_coding | deleterious(0) | probably_damaging(0.994) | TCGA-AA-3679-01 | Colorectum | colon adenocarcinoma | Male | <65 | III/IV | Chemotherapy | folinic | SD | |
| BAX | deletion | Frame_Shift_Del | c.265delC | p.Arg89GlufsTer44 | p.R89Efs*44 | Q07812 | protein_coding | TCGA-AA-3672-01 | Colorectum | colon adenocarcinoma | Female | >=65 | III/IV | Unknown | Unknown | SD | |||
| BAX | SNV | Missense_Mutation | rs398122513 | c.199N>A | p.Gly67Arg | p.G67R | Q07812 | protein_coding | deleterious(0.01) | benign(0.403) | TCGA-A5-A2K3-01 | Endometrium | uterine corpus endometrioid carcinoma | Female | >=65 | I/II | Chemotherapy | carboplatin | SD |
| Page: 1 2 3 |
Top |
Related drugs of malignant transformation related genes |
| Identification of chemicals and drugs interact with genes involved in malignant transfromation |
| (DGIdb 4.0) |
| Entrez ID | Symbol | Category | Interaction Types | Drug Claim Name | Drug Name | PMIDs |
| 581 | BAX | TUMOR SUPPRESSOR, DRUGGABLE GENOME | PREDNISOLONE | PREDNISOLONE | 12730678 | |
| 581 | BAX | TUMOR SUPPRESSOR, DRUGGABLE GENOME | METHOTREXATE | METHOTREXATE | 11237386 | |
| 581 | BAX | TUMOR SUPPRESSOR, DRUGGABLE GENOME | NITROGEN MUSTARD | 9459175,11839668 | ||
| 581 | BAX | TUMOR SUPPRESSOR, DRUGGABLE GENOME | DOXORUBICIN | DOXORUBICIN | 12040435 | |
| 581 | BAX | TUMOR SUPPRESSOR, DRUGGABLE GENOME | CA4P | 12171907 | ||
| 581 | BAX | TUMOR SUPPRESSOR, DRUGGABLE GENOME | PHENYLEPHRINE | PHENYLEPHRINE | 10220693 | |
| 581 | BAX | TUMOR SUPPRESSOR, DRUGGABLE GENOME | DHEA | PRASTERONE | 9177459 | |
| 581 | BAX | TUMOR SUPPRESSOR, DRUGGABLE GENOME | PHENOBARBITAL | PHENOBARBITAL | 9230198 | |
| 581 | BAX | TUMOR SUPPRESSOR, DRUGGABLE GENOME | BICALUTAMIDE | BICALUTAMIDE | 11845989 | |
| 581 | BAX | TUMOR SUPPRESSOR, DRUGGABLE GENOME | DHT | ANDROSTANOLONE | 15517879 |
| Page: 1 2 3 4 5 6 7 |

Copyright 2023-Present -The University of Texas Health Science Center at Houston |