
|
|||||
|
 | |
| |
| |
| |
| |
| |
|
Gene: PDCD6 |
Gene summary for PDCD6 |
| Gene information | Species | Human | Gene symbol | PDCD6 | Gene ID | 10016 |
| Gene name | programmed cell death 6 | |
| Gene Alias | ALG-2 | |
| Cytomap | 5p15.33 | |
| Gene Type | protein-coding | GO ID | GO:0001525 | UniProtAcc | O75340 |
Top |
Malignant transformation analysis |
| Identification of the aberrant gene expression in precancerous and cancerous lesions by comparing the gene expression of stem-like cells in diseased tissues with normal stem cells |
| Entrez ID | Symbol | Replicates | Species | Organ | Tissue | Adj P-value | Log2FC | Malignancy |
| 10016 | PDCD6 | GSM4909281 | Human | Breast | IDC | 1.61e-02 | 2.51e-01 | 0.21 |
| 10016 | PDCD6 | GSM4909282 | Human | Breast | IDC | 1.04e-11 | 4.15e-01 | -0.0288 |
| 10016 | PDCD6 | GSM4909285 | Human | Breast | IDC | 2.91e-31 | 6.81e-01 | 0.21 |
| 10016 | PDCD6 | GSM4909288 | Human | Breast | IDC | 3.09e-02 | 8.18e-02 | 0.0988 |
| 10016 | PDCD6 | GSM4909290 | Human | Breast | IDC | 4.62e-03 | 2.82e-01 | 0.2096 |
| 10016 | PDCD6 | GSM4909291 | Human | Breast | IDC | 2.29e-05 | 3.55e-01 | 0.1753 |
| 10016 | PDCD6 | GSM4909293 | Human | Breast | IDC | 7.23e-123 | 1.22e+00 | 0.1581 |
| 10016 | PDCD6 | GSM4909294 | Human | Breast | IDC | 4.03e-10 | 3.25e-01 | 0.2022 |
| 10016 | PDCD6 | GSM4909296 | Human | Breast | IDC | 3.29e-11 | 1.60e-01 | 0.1524 |
| 10016 | PDCD6 | GSM4909297 | Human | Breast | IDC | 3.01e-07 | -3.60e-02 | 0.1517 |
| 10016 | PDCD6 | GSM4909298 | Human | Breast | IDC | 6.37e-07 | 2.93e-01 | 0.1551 |
| 10016 | PDCD6 | GSM4909304 | Human | Breast | IDC | 1.07e-06 | 2.28e-01 | 0.1636 |
| 10016 | PDCD6 | GSM4909308 | Human | Breast | IDC | 2.18e-02 | 2.21e-01 | 0.158 |
| 10016 | PDCD6 | GSM4909311 | Human | Breast | IDC | 1.24e-22 | -3.30e-01 | 0.1534 |
| 10016 | PDCD6 | GSM4909312 | Human | Breast | IDC | 1.80e-10 | -5.38e-02 | 0.1552 |
| 10016 | PDCD6 | GSM4909316 | Human | Breast | IDC | 1.55e-07 | 3.61e-01 | 0.21 |
| 10016 | PDCD6 | GSM4909317 | Human | Breast | IDC | 2.50e-20 | 5.49e-01 | 0.1355 |
| 10016 | PDCD6 | GSM4909318 | Human | Breast | IDC | 1.58e-08 | 5.55e-01 | 0.2031 |
| 10016 | PDCD6 | GSM4909319 | Human | Breast | IDC | 3.04e-31 | -1.81e-01 | 0.1563 |
| 10016 | PDCD6 | GSM4909320 | Human | Breast | IDC | 1.24e-05 | -2.12e-01 | 0.1575 |
| Page: 1 2 3 4 5 6 7 8 9 10 11 12 13 |
| Tissue | Expression Dynamics | Abbreviation |
| Breast |  | IDC: Invasive ductal carcinoma |
| DCIS: Ductal carcinoma in situ | ||
| Precancer(BRCA1-mut): Precancerous lesion from BRCA1 mutation carriers | ||
| Cervix | 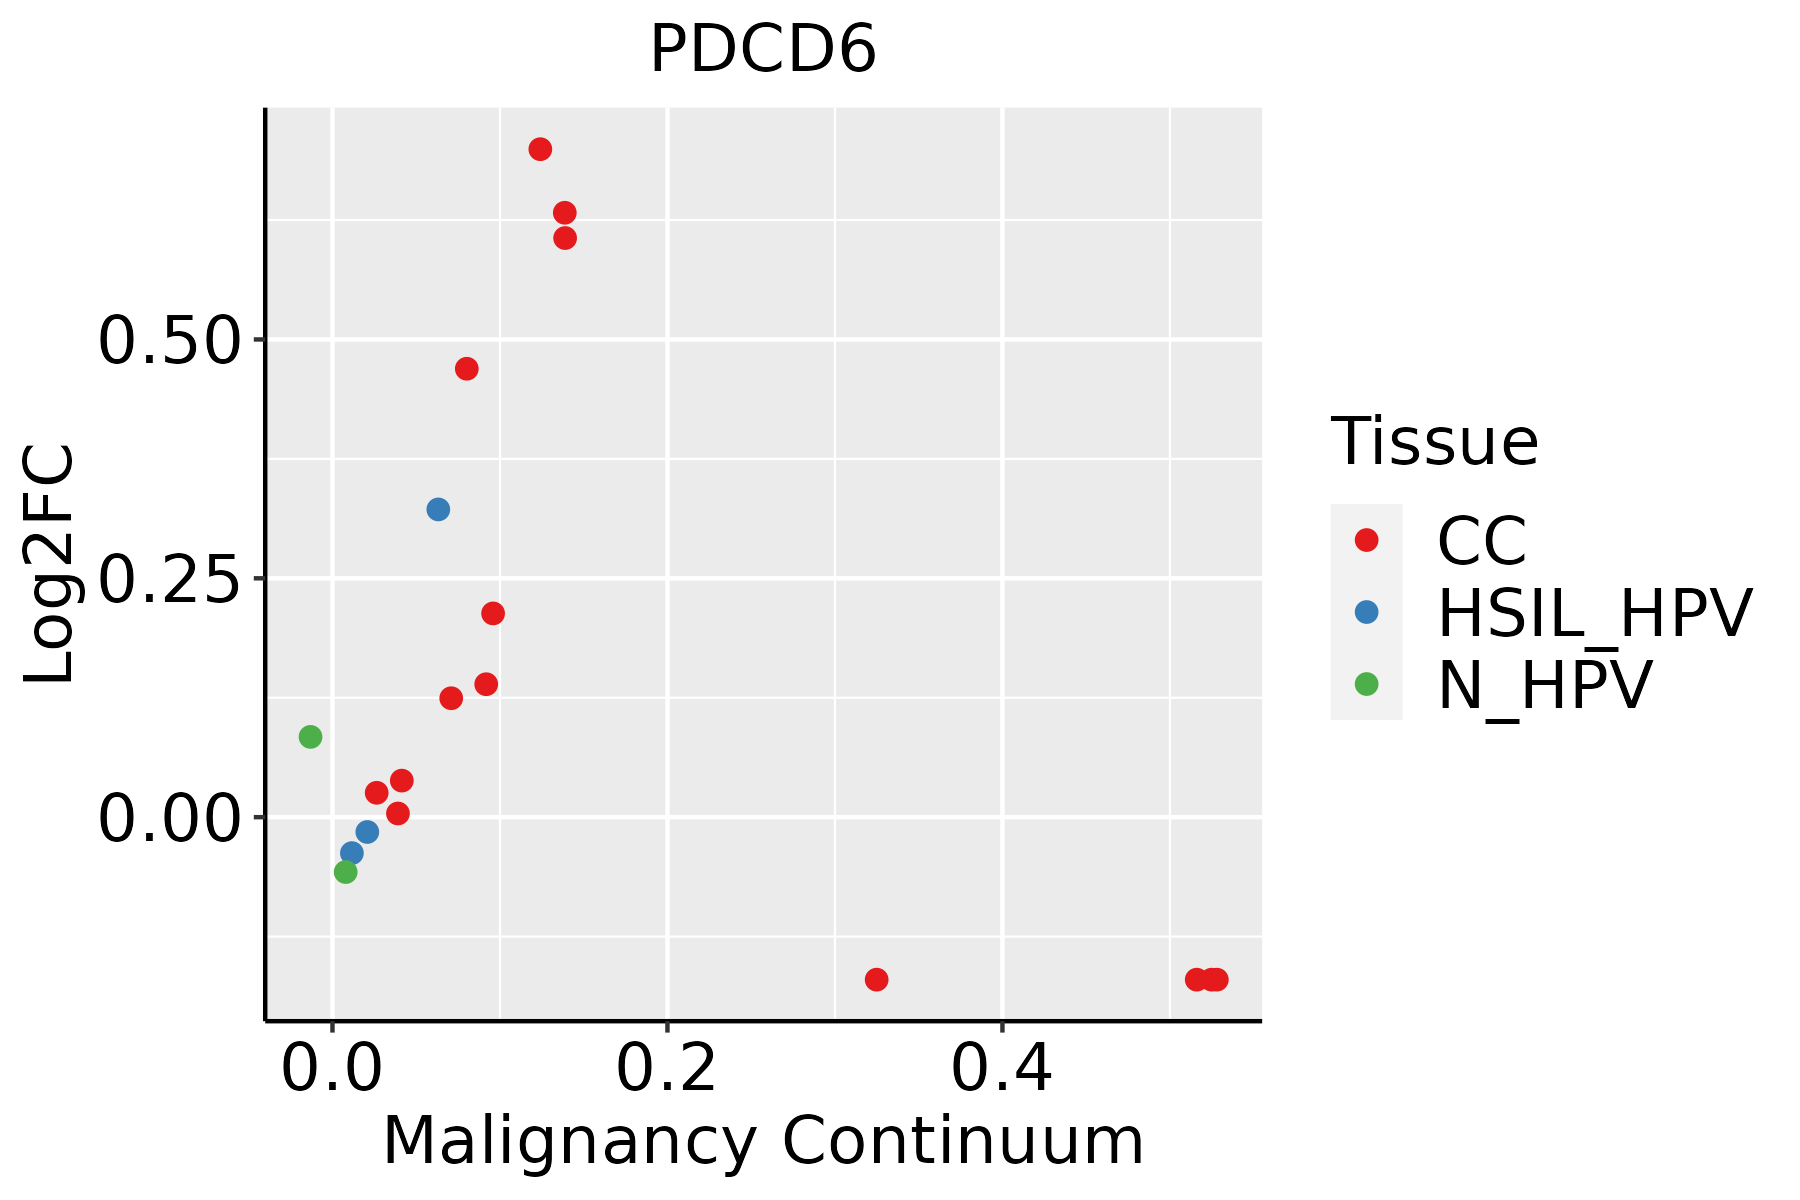 | CC: Cervix cancer |
| HSIL_HPV: HPV-infected high-grade squamous intraepithelial lesions | ||
| N_HPV: HPV-infected normal cervix | ||
| Colorectum (GSE201348) |  | FAP: Familial adenomatous polyposis |
| CRC: Colorectal cancer | ||
| Colorectum (HTA11) | 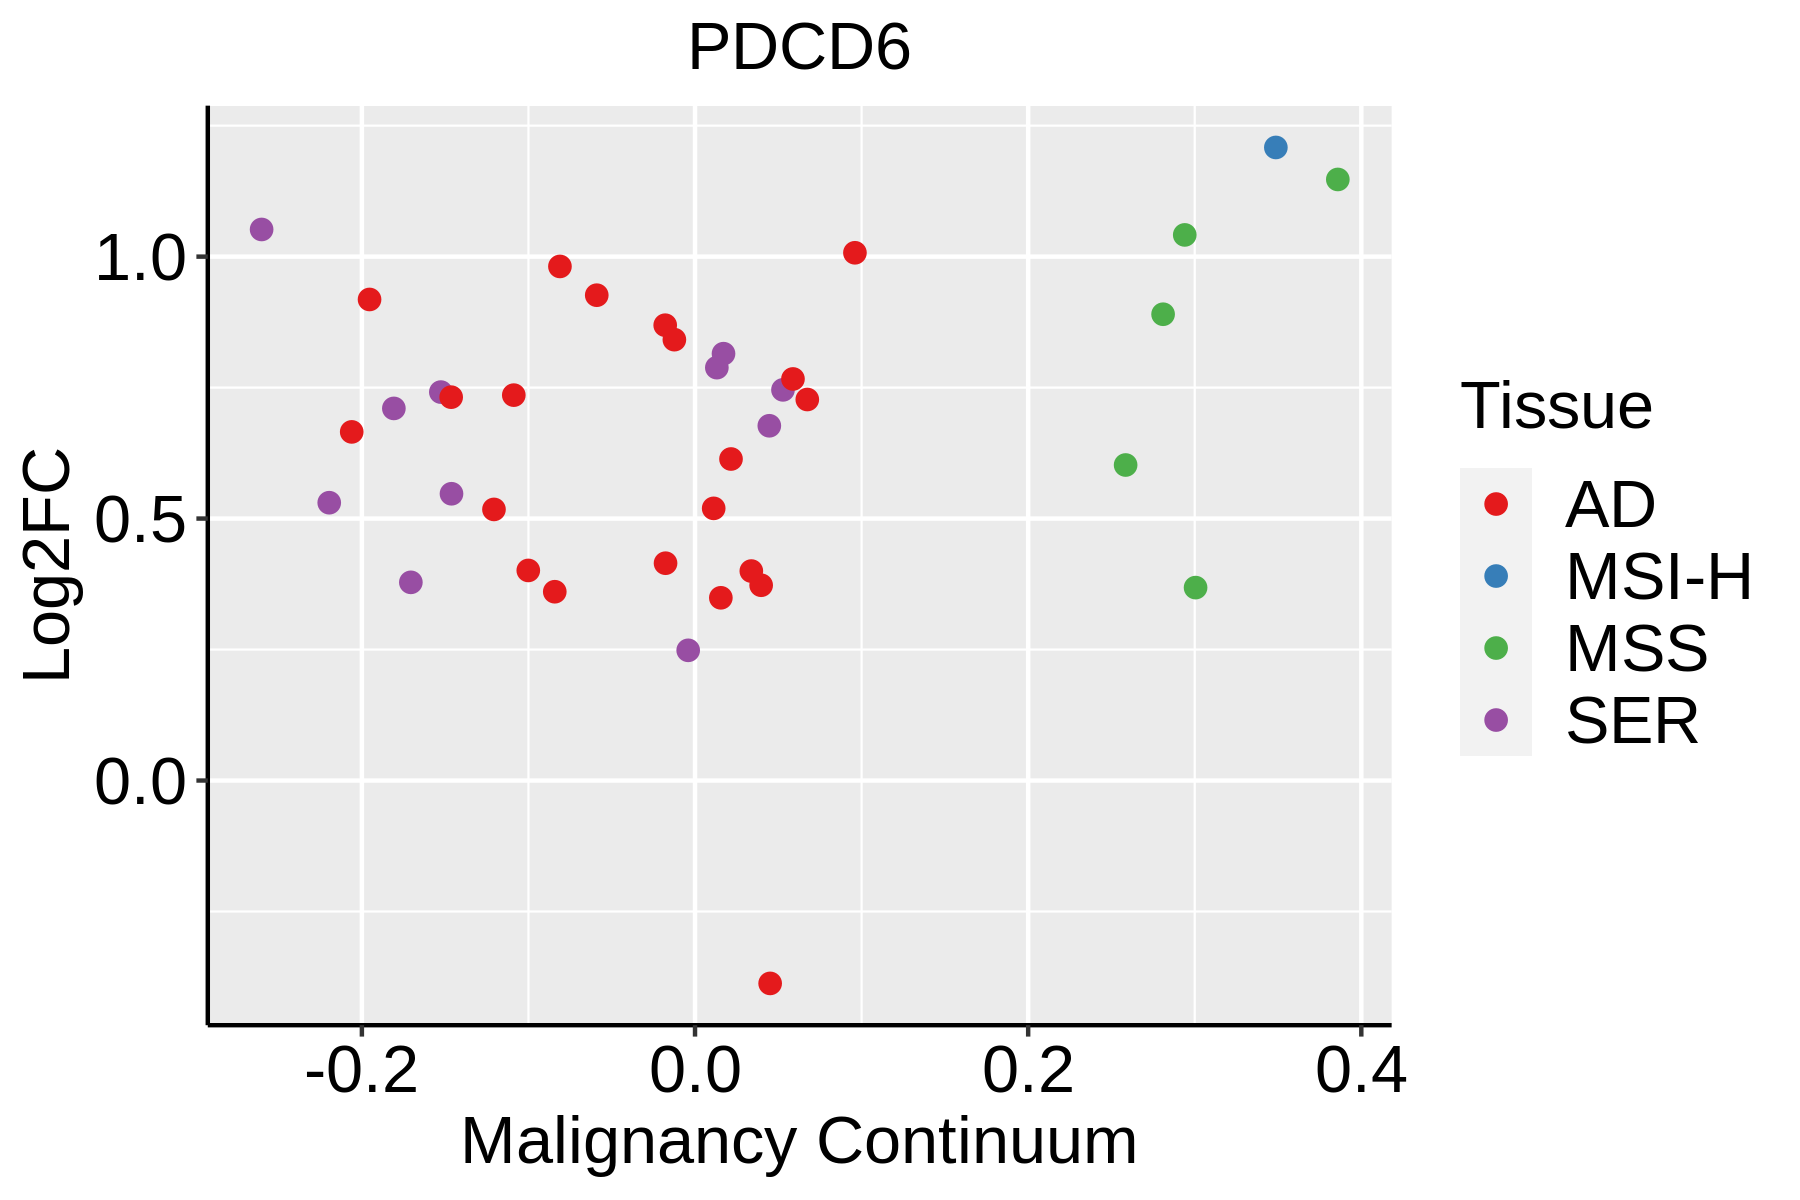 | AD: Adenomas |
| SER: Sessile serrated lesions | ||
| MSI-H: Microsatellite-high colorectal cancer | ||
| MSS: Microsatellite stable colorectal cancer | ||
| Endometrium | 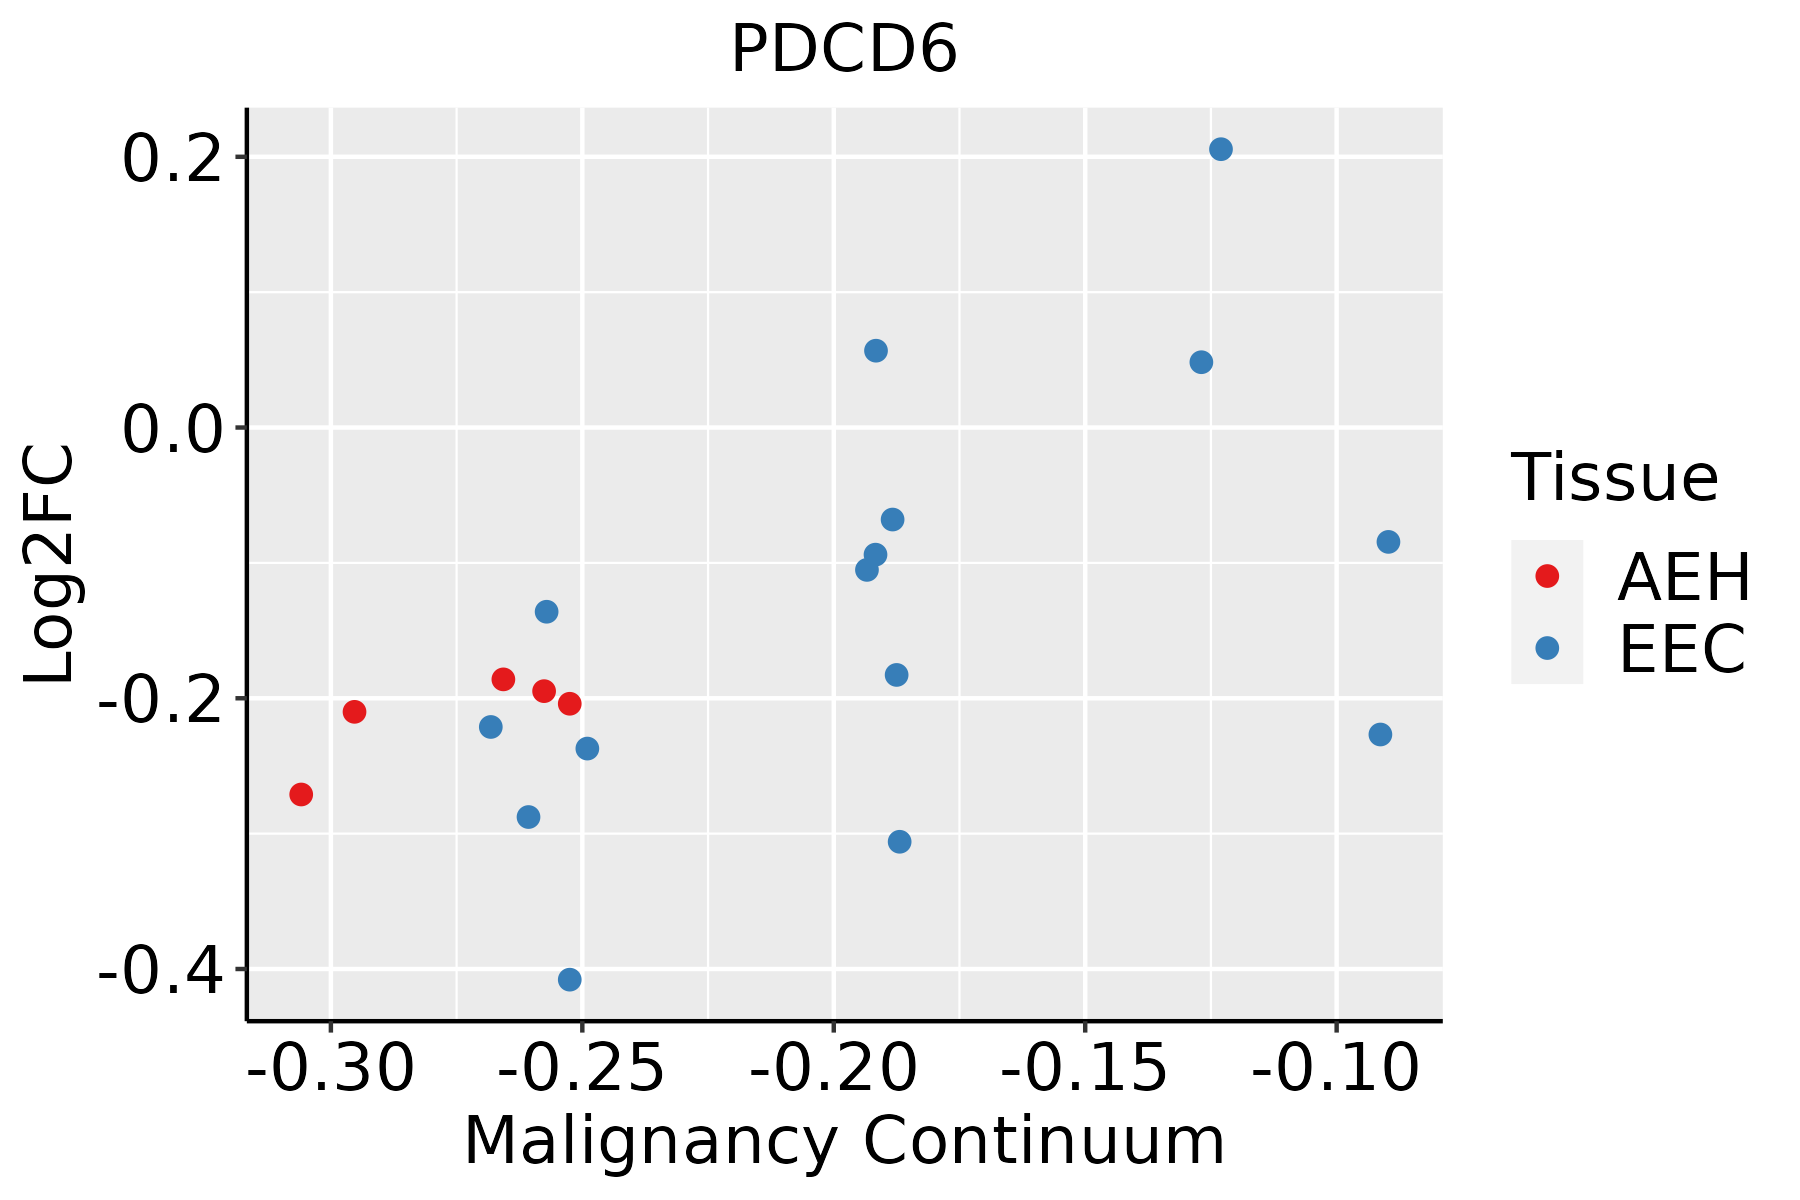 | AEH: Atypical endometrial hyperplasia |
| EEC: Endometrioid Cancer | ||
| Esophagus | 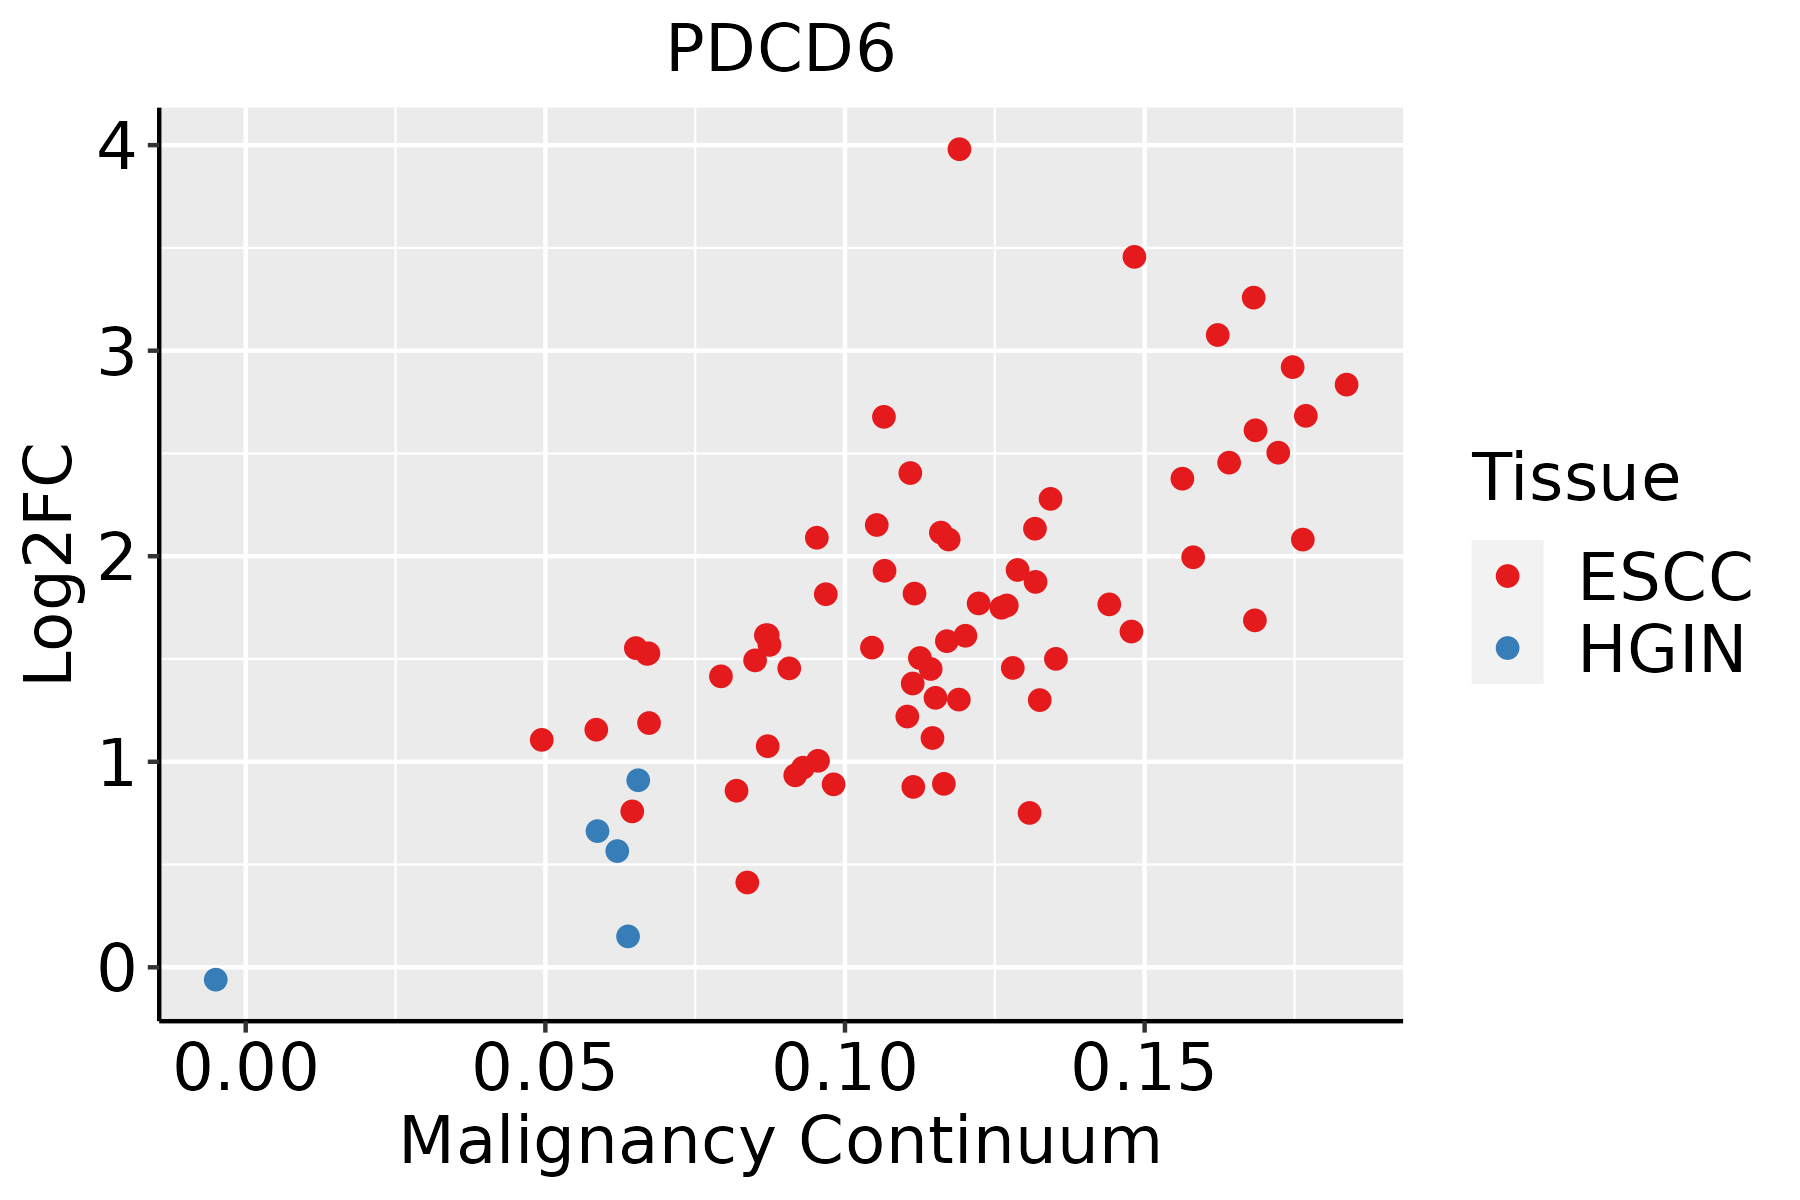 | ESCC: Esophageal squamous cell carcinoma |
| HGIN: High-grade intraepithelial neoplasias | ||
| LGIN: Low-grade intraepithelial neoplasias | ||
| Liver | 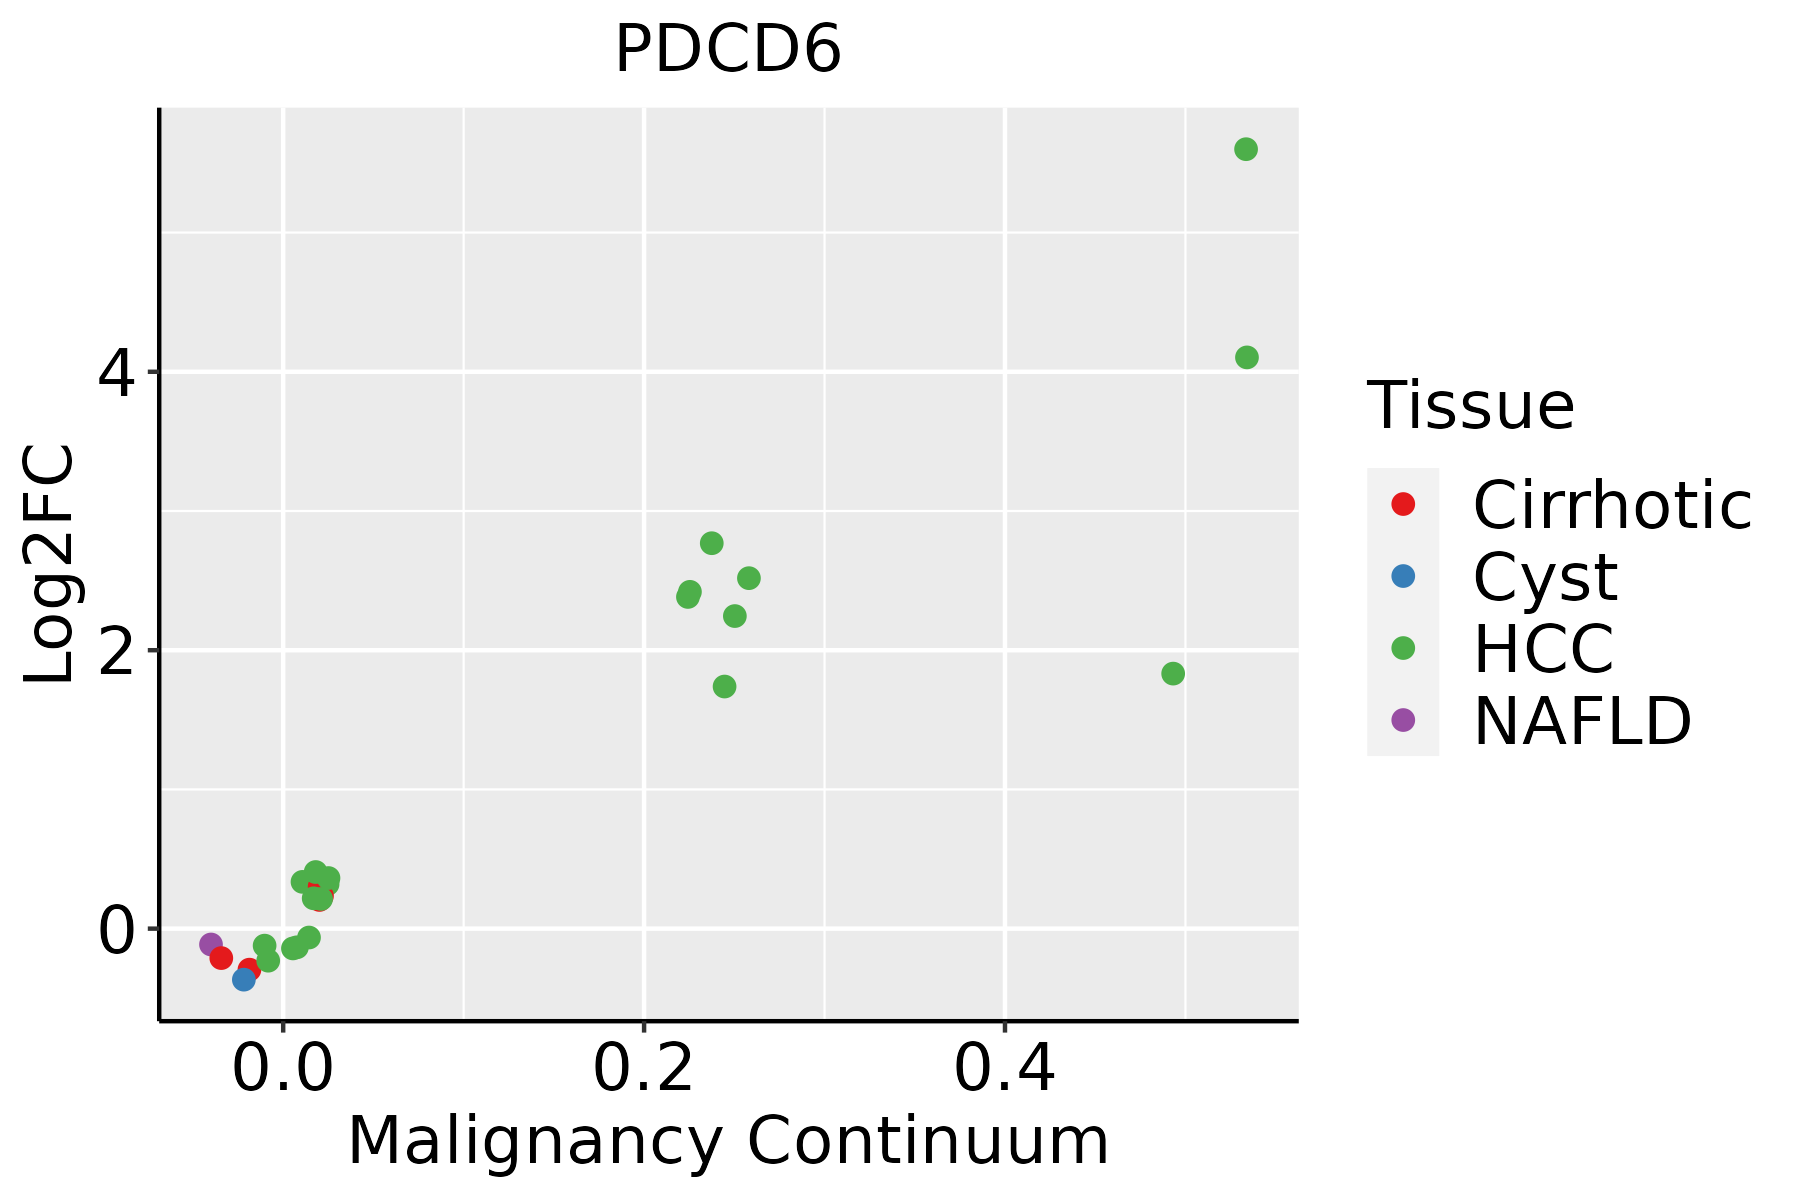 | HCC: Hepatocellular carcinoma |
| NAFLD: Non-alcoholic fatty liver disease | ||
| Lung | 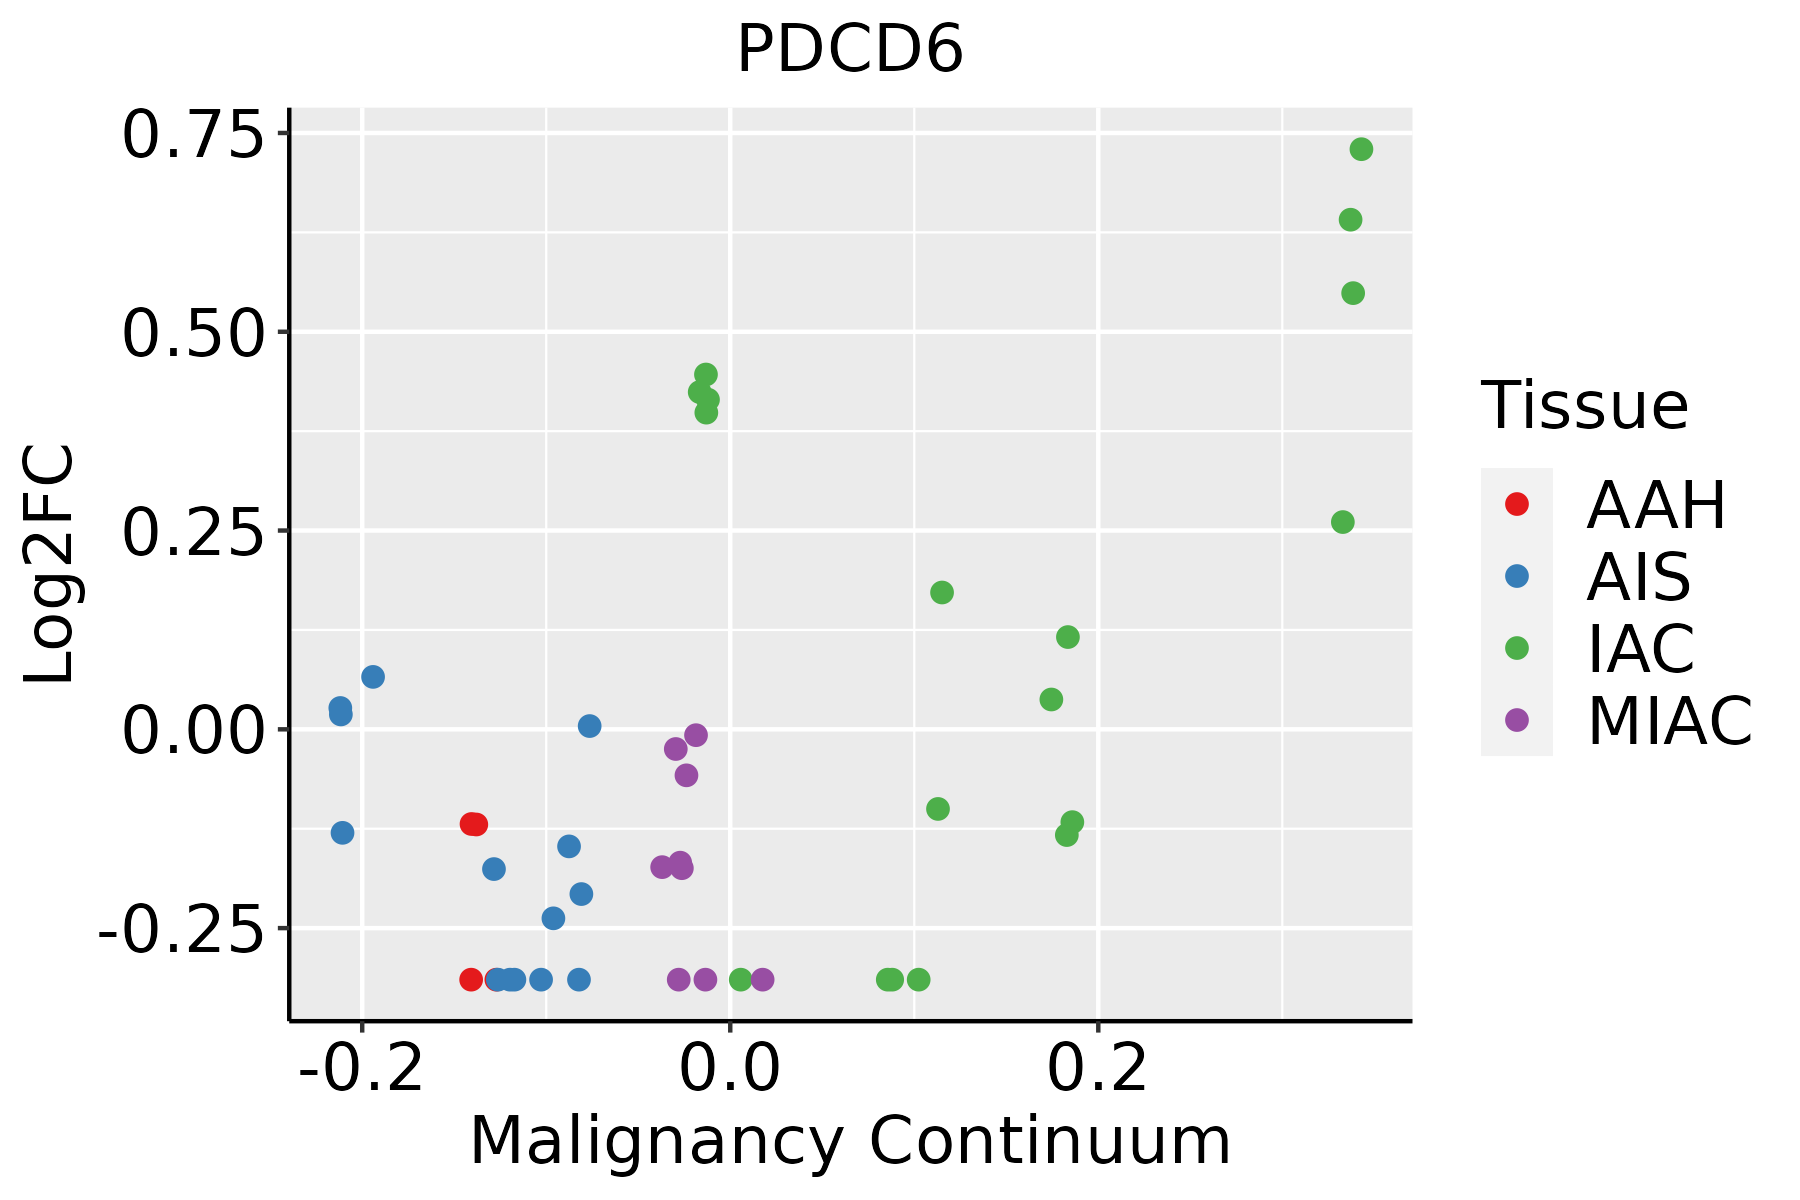 | AAH: Atypical adenomatous hyperplasia |
| AIS: Adenocarcinoma in situ | ||
| IAC: Invasive lung adenocarcinoma | ||
| MIA: Minimally invasive adenocarcinoma | ||
| Oral Cavity | 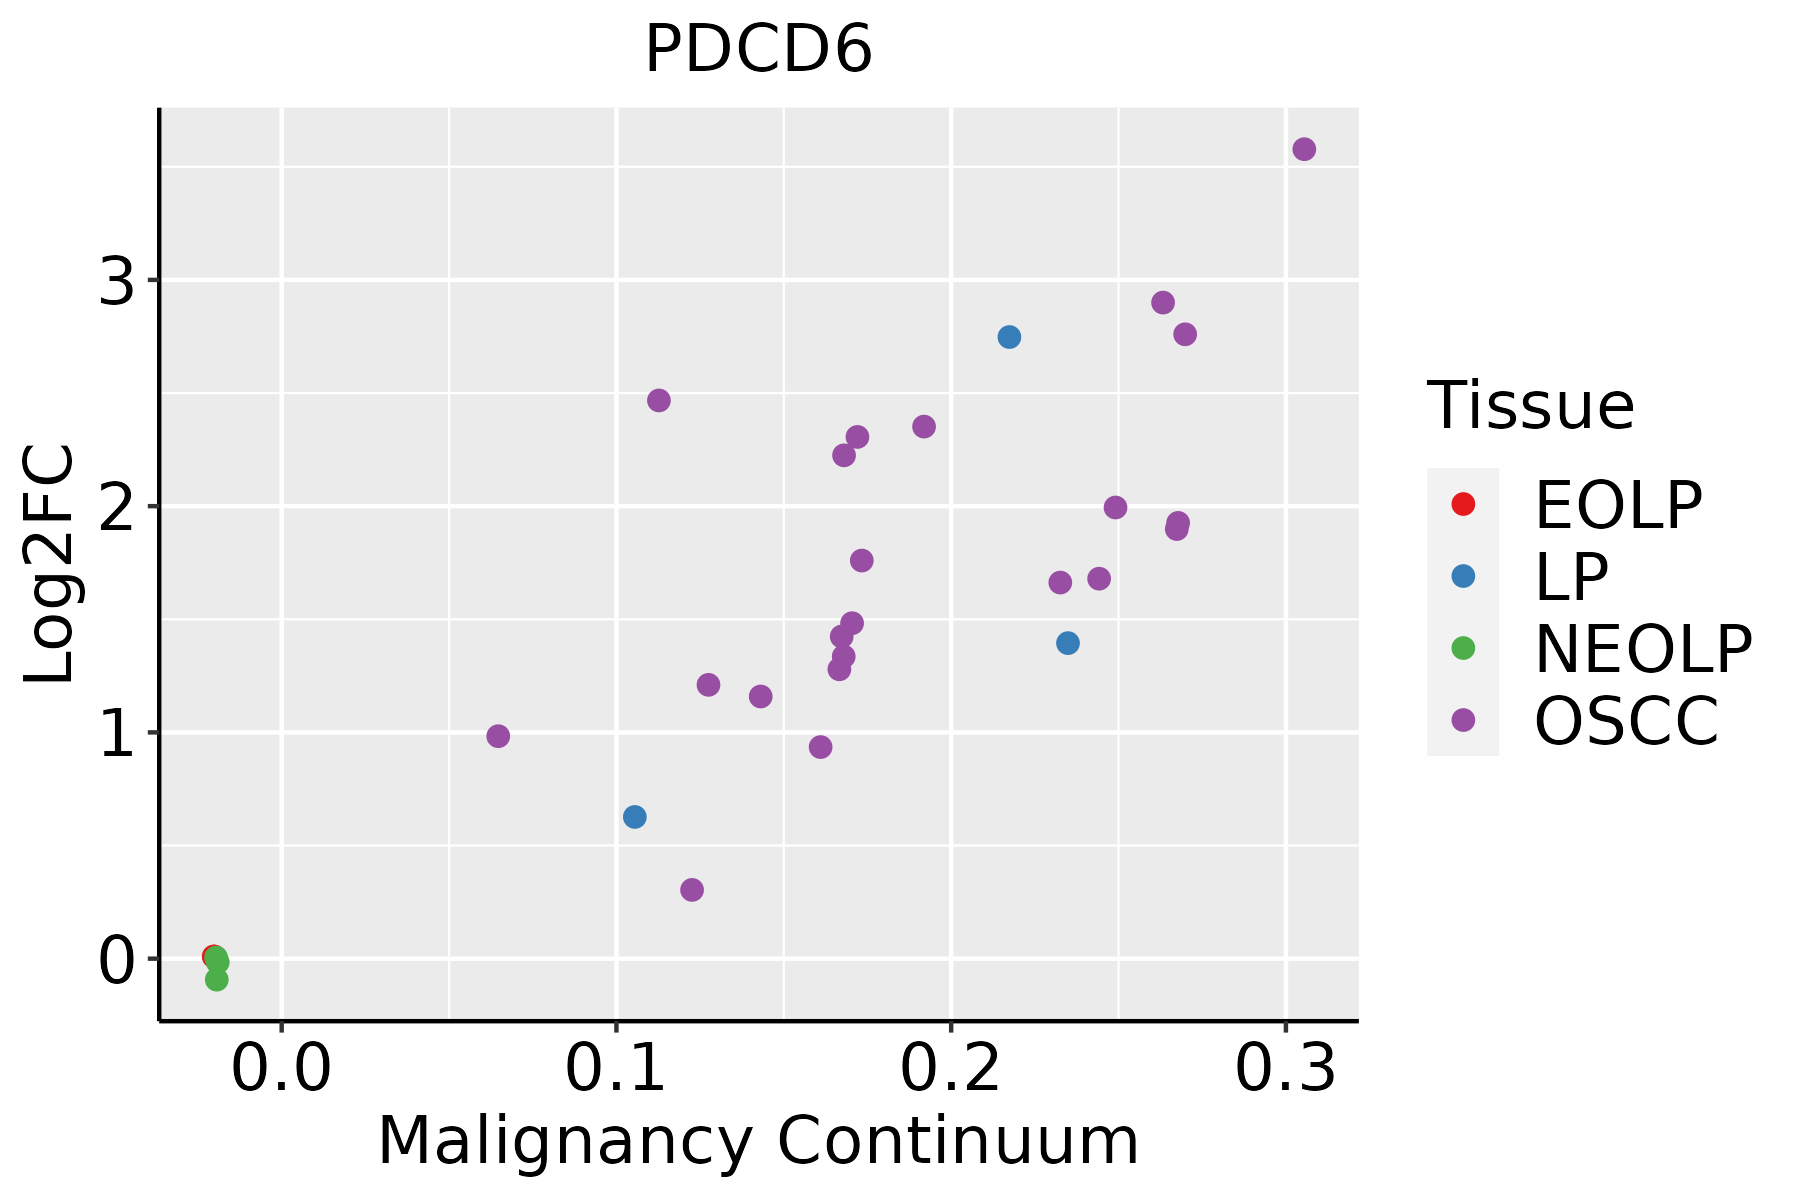 | EOLP: Erosive Oral lichen planus |
| LP: leukoplakia | ||
| NEOLP: Non-erosive oral lichen planus | ||
| OSCC: Oral squamous cell carcinoma | ||
| Prostate | 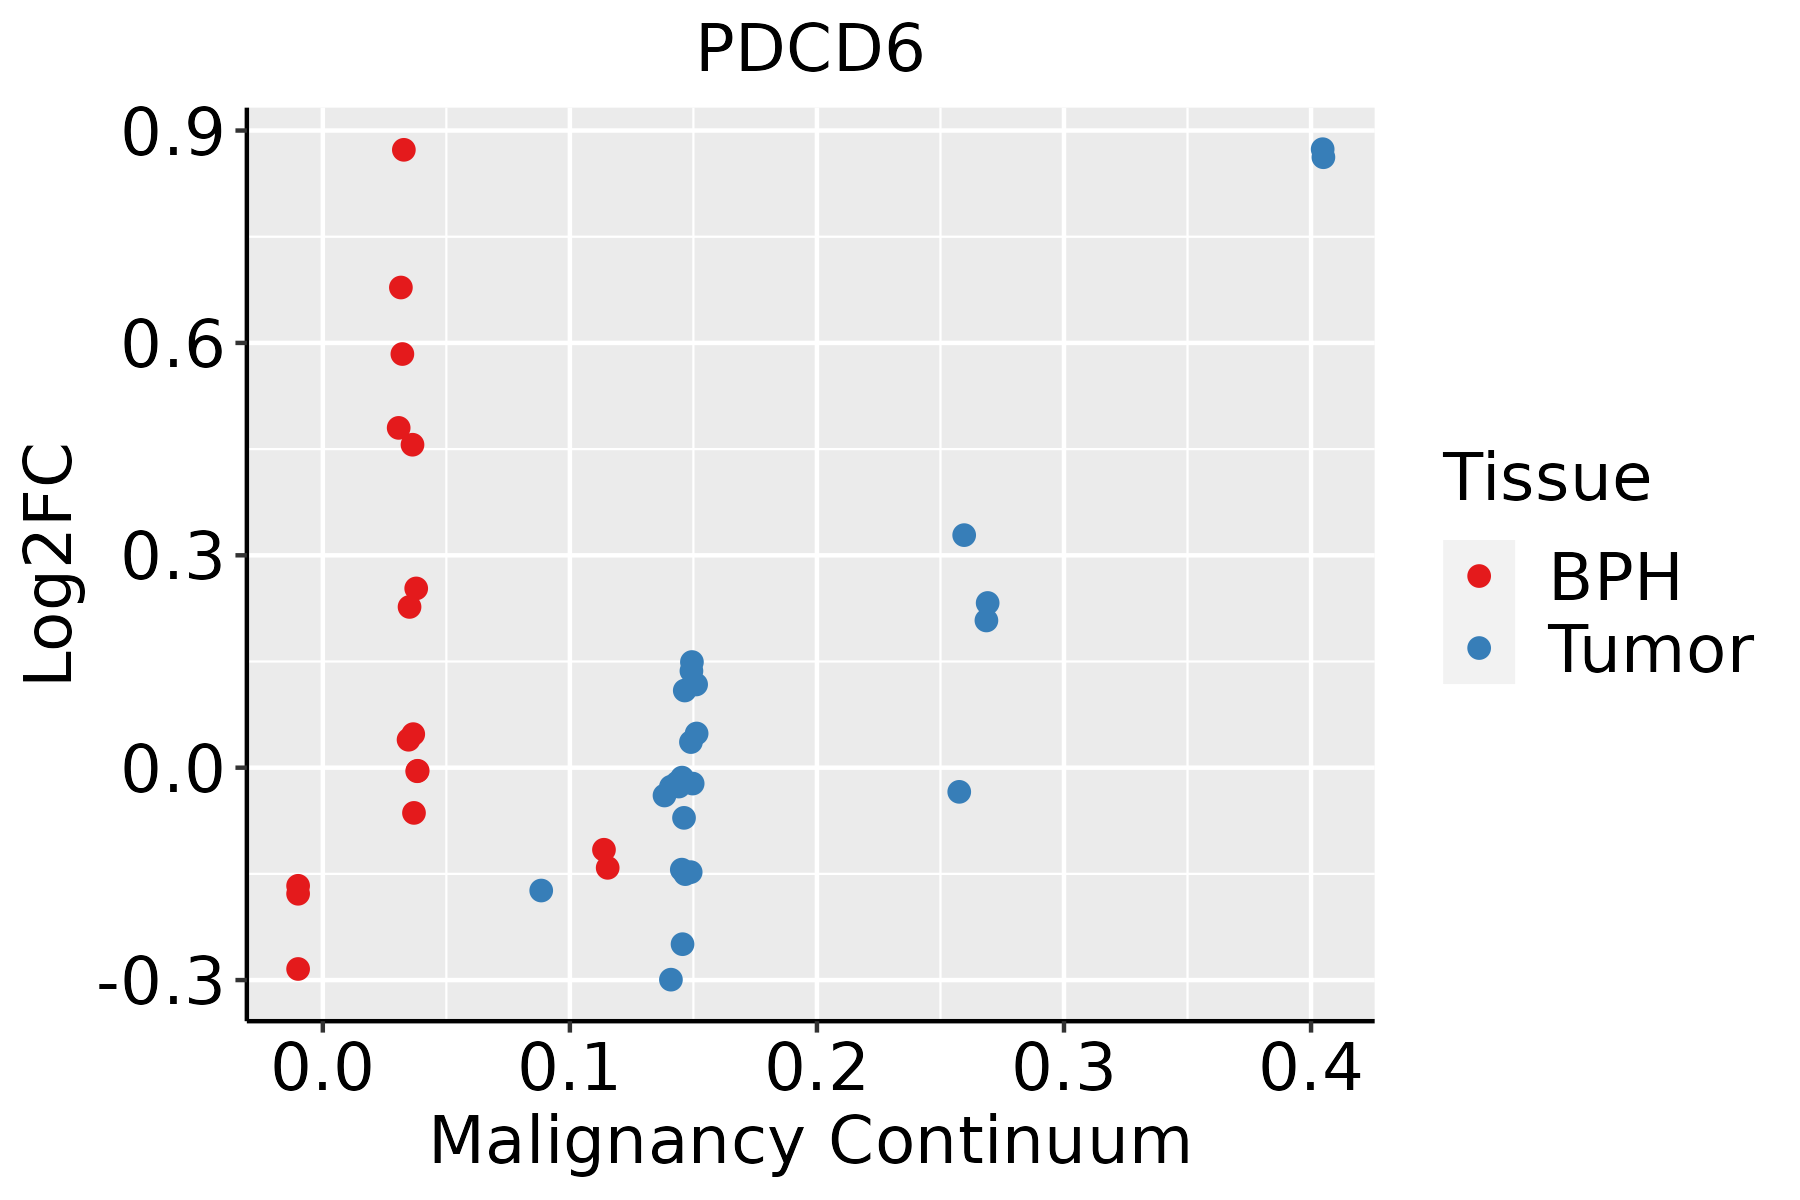 | BPH: Benign Prostatic Hyperplasia |
| Skin |  | AK: Actinic keratosis |
| cSCC: Cutaneous squamous cell carcinoma | ||
| SCCIS:squamous cell carcinoma in situ | ||
| Thyroid | 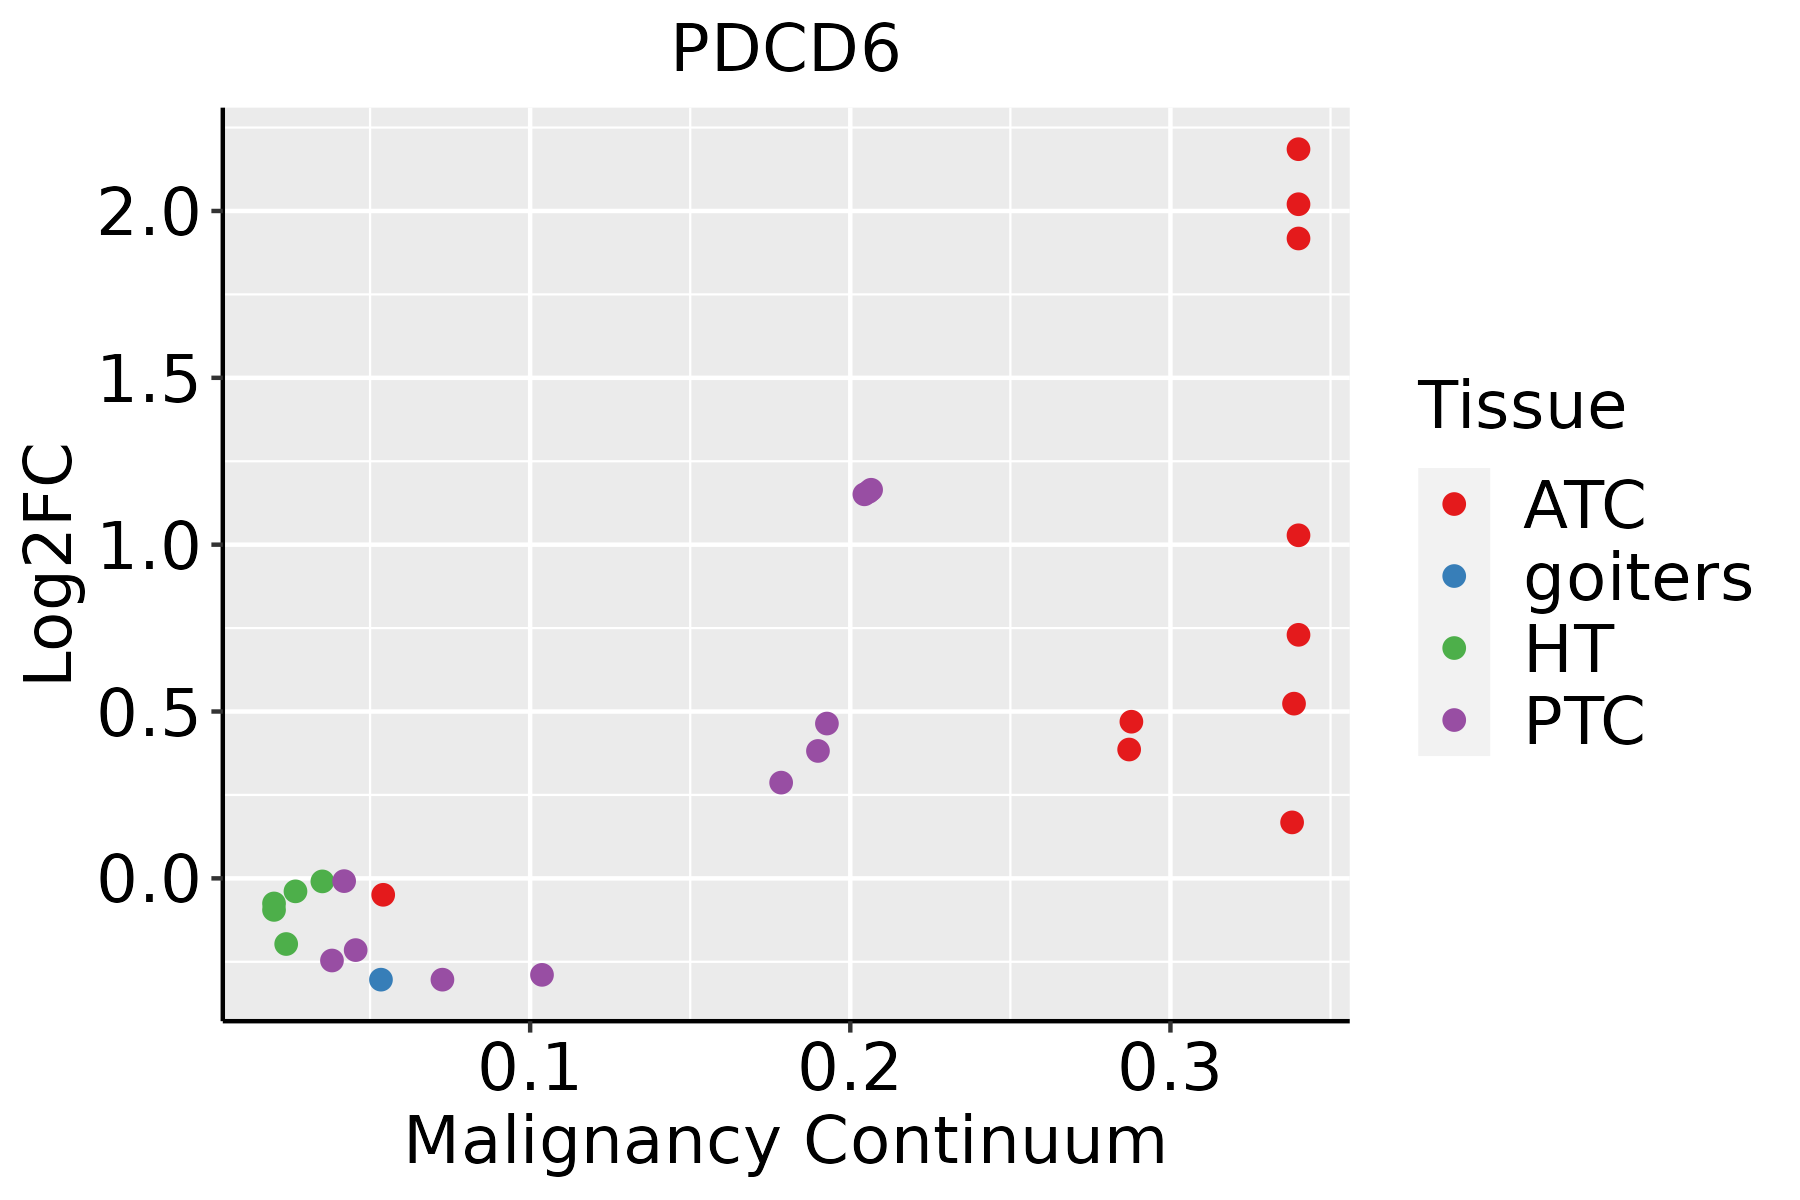 | ATC: Anaplastic thyroid cancer |
| HT: Hashimoto's thyroiditis | ||
| PTC: Papillary thyroid cancer |
| ∗log2FC in expression of this searched gene in stem-like cells from each diseased tissue sample relative to stem-like cells in normal samples in each tissue plotted against the malignancy continuum. Samples are colored based on if they are from different disease stage. |
Top |
Malignant transformation related pathway analysis |
| Find out the enriched GO biological processes and KEGG pathways involved in transition from healthy to precancer to cancer |
| Tissue | Disease Stage | Enriched GO biological Processes |
| Colorectum | AD |  |
| Colorectum | SER |  |
| Colorectum | MSS |  |
| Colorectum | MSI-H |  |
| Colorectum | FAP |  |
| ∗Top 15 enriched GO BP terms are showed in the bar plot of each disease state in each tissue. Each row represents a significant GO biological process which is colored according to the -log10(p.adjust). |
| Page: 1 2 3 4 5 6 7 8 9 |
| GO ID | Tissue | Disease Stage | Description | Gene Ratio | Bg Ratio | pvalue | p.adjust | Count |
| GO:012019317 | Thyroid | PTC | tight junction organization | 38/5968 | 80/18723 | 2.49e-03 | 1.29e-02 | 38 |
| GO:004886318 | Thyroid | PTC | stem cell differentiation | 85/5968 | 206/18723 | 2.71e-03 | 1.36e-02 | 85 |
| GO:009028712 | Thyroid | PTC | regulation of cellular response to growth factor stimulus | 120/5968 | 304/18723 | 2.87e-03 | 1.42e-02 | 120 |
| GO:00069198 | Thyroid | PTC | activation of cysteine-type endopeptidase activity involved in apoptotic process | 37/5968 | 78/18723 | 2.91e-03 | 1.44e-02 | 37 |
| GO:012019216 | Thyroid | PTC | tight junction assembly | 35/5968 | 74/18723 | 3.95e-03 | 1.89e-02 | 35 |
| GO:004576612 | Thyroid | PTC | positive regulation of angiogenesis | 75/5968 | 181/18723 | 4.09e-03 | 1.95e-02 | 75 |
| GO:190401812 | Thyroid | PTC | positive regulation of vasculature development | 75/5968 | 181/18723 | 4.09e-03 | 1.95e-02 | 75 |
| GO:00466055 | Thyroid | PTC | regulation of centrosome cycle | 25/5968 | 49/18723 | 4.09e-03 | 1.95e-02 | 25 |
| GO:00482077 | Thyroid | PTC | vesicle targeting, rough ER to cis-Golgi | 9/5968 | 13/18723 | 6.33e-03 | 2.79e-02 | 9 |
| GO:00482087 | Thyroid | PTC | COPII vesicle coating | 9/5968 | 13/18723 | 6.33e-03 | 2.79e-02 | 9 |
| GO:006048514 | Thyroid | PTC | mesenchyme development | 112/5968 | 291/18723 | 9.48e-03 | 3.90e-02 | 112 |
| GO:001059416 | Thyroid | PTC | regulation of endothelial cell migration | 91/5968 | 232/18723 | 1.03e-02 | 4.18e-02 | 91 |
| GO:00518969 | Thyroid | PTC | regulation of protein kinase B signaling | 74/5968 | 185/18723 | 1.16e-02 | 4.58e-02 | 74 |
| GO:0043281210 | Thyroid | goiters | regulation of cysteine-type endopeptidase activity involved in apoptotic process | 22/497 | 209/18723 | 4.23e-08 | 3.81e-06 | 22 |
| GO:0031396210 | Thyroid | goiters | regulation of protein ubiquitination | 21/497 | 210/18723 | 2.06e-07 | 1.58e-05 | 21 |
| GO:0052547210 | Thyroid | goiters | regulation of peptidase activity | 33/497 | 461/18723 | 2.68e-07 | 1.98e-05 | 33 |
| GO:2000116210 | Thyroid | goiters | regulation of cysteine-type endopeptidase activity | 22/497 | 235/18723 | 3.36e-07 | 2.40e-05 | 22 |
| GO:1903320210 | Thyroid | goiters | regulation of protein modification by small protein conjugation or removal | 22/497 | 242/18723 | 5.56e-07 | 3.60e-05 | 22 |
| GO:0052548210 | Thyroid | goiters | regulation of endopeptidase activity | 31/497 | 432/18723 | 5.88e-07 | 3.75e-05 | 31 |
| GO:0045862210 | Thyroid | goiters | positive regulation of proteolysis | 28/497 | 372/18723 | 8.12e-07 | 4.73e-05 | 28 |
| Page: 1 2 3 4 5 6 7 8 9 10 11 12 13 14 15 16 17 18 19 20 21 22 23 24 25 26 27 28 29 30 31 32 33 34 35 36 37 38 39 40 41 42 43 44 45 46 47 48 49 50 51 52 53 54 55 56 57 58 59 60 61 62 63 64 65 66 67 68 69 70 71 72 73 74 |
| Pathway ID | Tissue | Disease Stage | Description | Gene Ratio | Bg Ratio | pvalue | p.adjust | qvalue | Count |
| Page: 1 |
Top |
Cell-cell communication analysis |
| Identification of potential cell-cell interactions between two cell types and their ligand-receptor pairs for different disease states |
| Ligand | Receptor | LRpair | Pathway | Tissue | Disease Stage |
| Page: 1 |
Top |
Single-cell gene regulatory network inference analysis |
| Find out the significant the regulons (TFs) and the target genes of each regulon across cell types for different disease states |
| TF | Cell Type | Tissue | Disease Stage | Target Gene | RSS | Regulon Activity |
| ∗The dot plots of a searched regulon are shown for all cell subpopulations in each disease state of each tissue based on the regulon specific score inferred using pySCENIC and by calculating the average expression. |
| Page: 1 |
Top |
Somatic mutation of malignant transformation related genes |
| Annotation of somatic variants for genes involved in malignant transformation |
| Hugo Symbol | Variant Class | Variant Classification | dbSNP RS | HGVSc | HGVSp | HGVSp Short | SWISSPROT | BIOTYPE | SIFT | PolyPhen | Tumor Sample Barcode | Tissue | Histology | Sex | Age | Stage | Therapy Types | Drugs | Outcome |
| PDCD6 | SNV | Missense_Mutation | novel | c.154N>G | p.Leu52Val | p.L52V | O75340 | protein_coding | deleterious(0) | possibly_damaging(0.544) | TCGA-A2-A0EY-01 | Breast | breast invasive carcinoma | Female | <65 | I/II | Chemotherapy | adriamycin | SD |
| PDCD6 | deletion | Frame_Shift_Del | c.221delG | p.Arg74LeufsTer7 | p.R74Lfs*7 | O75340 | protein_coding | TCGA-BH-A18G-01 | Breast | breast invasive carcinoma | Female | >=65 | I/II | Unknown | Unknown | SD | |||
| PDCD6 | SNV | Missense_Mutation | rs370878298 | c.541N>A | p.Glu181Lys | p.E181K | O75340 | protein_coding | deleterious(0) | probably_damaging(0.921) | TCGA-C5-A7XC-01 | Cervix | cervical & endocervical cancer | Female | <65 | I/II | Unknown | Unknown | SD |
| PDCD6 | SNV | Missense_Mutation | rs545985005 | c.302C>T | p.Thr101Met | p.T101M | O75340 | protein_coding | tolerated(0.08) | benign(0.262) | TCGA-VS-A8QC-01 | Cervix | cervical & endocervical cancer | Female | <65 | I/II | Chemotherapy | paclitaxel | PD |
| PDCD6 | SNV | Missense_Mutation | rs139334790 | c.500N>A | p.Arg167His | p.R167H | O75340 | protein_coding | deleterious(0.05) | benign(0.017) | TCGA-A6-2672-01 | Colorectum | colon adenocarcinoma | Female | >=65 | III/IV | Unknown | Unknown | SD |
| PDCD6 | SNV | Missense_Mutation | c.235N>A | p.Gly79Ser | p.G79S | O75340 | protein_coding | tolerated(0.22) | benign(0.015) | TCGA-AA-3811-01 | Colorectum | colon adenocarcinoma | Female | >=65 | III/IV | Unknown | Unknown | PD | |
| PDCD6 | SNV | Missense_Mutation | rs767684079 | c.427C>T | p.Arg143Trp | p.R143W | O75340 | protein_coding | deleterious(0.03) | possibly_damaging(0.85) | TCGA-AA-3864-01 | Colorectum | colon adenocarcinoma | Male | >=65 | I/II | Unknown | Unknown | SD |
| PDCD6 | SNV | Missense_Mutation | rs373052818 | c.367N>A | p.Gly123Ser | p.G123S | O75340 | protein_coding | deleterious(0) | probably_damaging(0.999) | TCGA-AA-3939-01 | Colorectum | colon adenocarcinoma | Male | >=65 | I/II | Unknown | Unknown | SD |
| PDCD6 | SNV | Missense_Mutation | novel | c.448N>A | p.Asp150Asn | p.D150N | O75340 | protein_coding | tolerated(0.22) | possibly_damaging(0.852) | TCGA-AD-6548-01 | Colorectum | colon adenocarcinoma | Female | >=65 | I/II | Unknown | Unknown | SD |
| PDCD6 | SNV | Missense_Mutation | rs139334790 | c.500N>A | p.Arg167His | p.R167H | O75340 | protein_coding | deleterious(0.05) | benign(0.017) | TCGA-AP-A051-01 | Endometrium | uterine corpus endometrioid carcinoma | Female | >=65 | I/II | Unknown | Unknown | SD |
| Page: 1 2 |
Top |
Related drugs of malignant transformation related genes |
| Identification of chemicals and drugs interact with genes involved in malignant transfromation |
| (DGIdb 4.0) |
| Entrez ID | Symbol | Category | Interaction Types | Drug Claim Name | Drug Name | PMIDs |
| Page: 1 |

Copyright 2023-Present -The University of Texas Health Science Center at Houston |