| Tissue | Expression Dynamics | Abbreviation |
| Cervix | 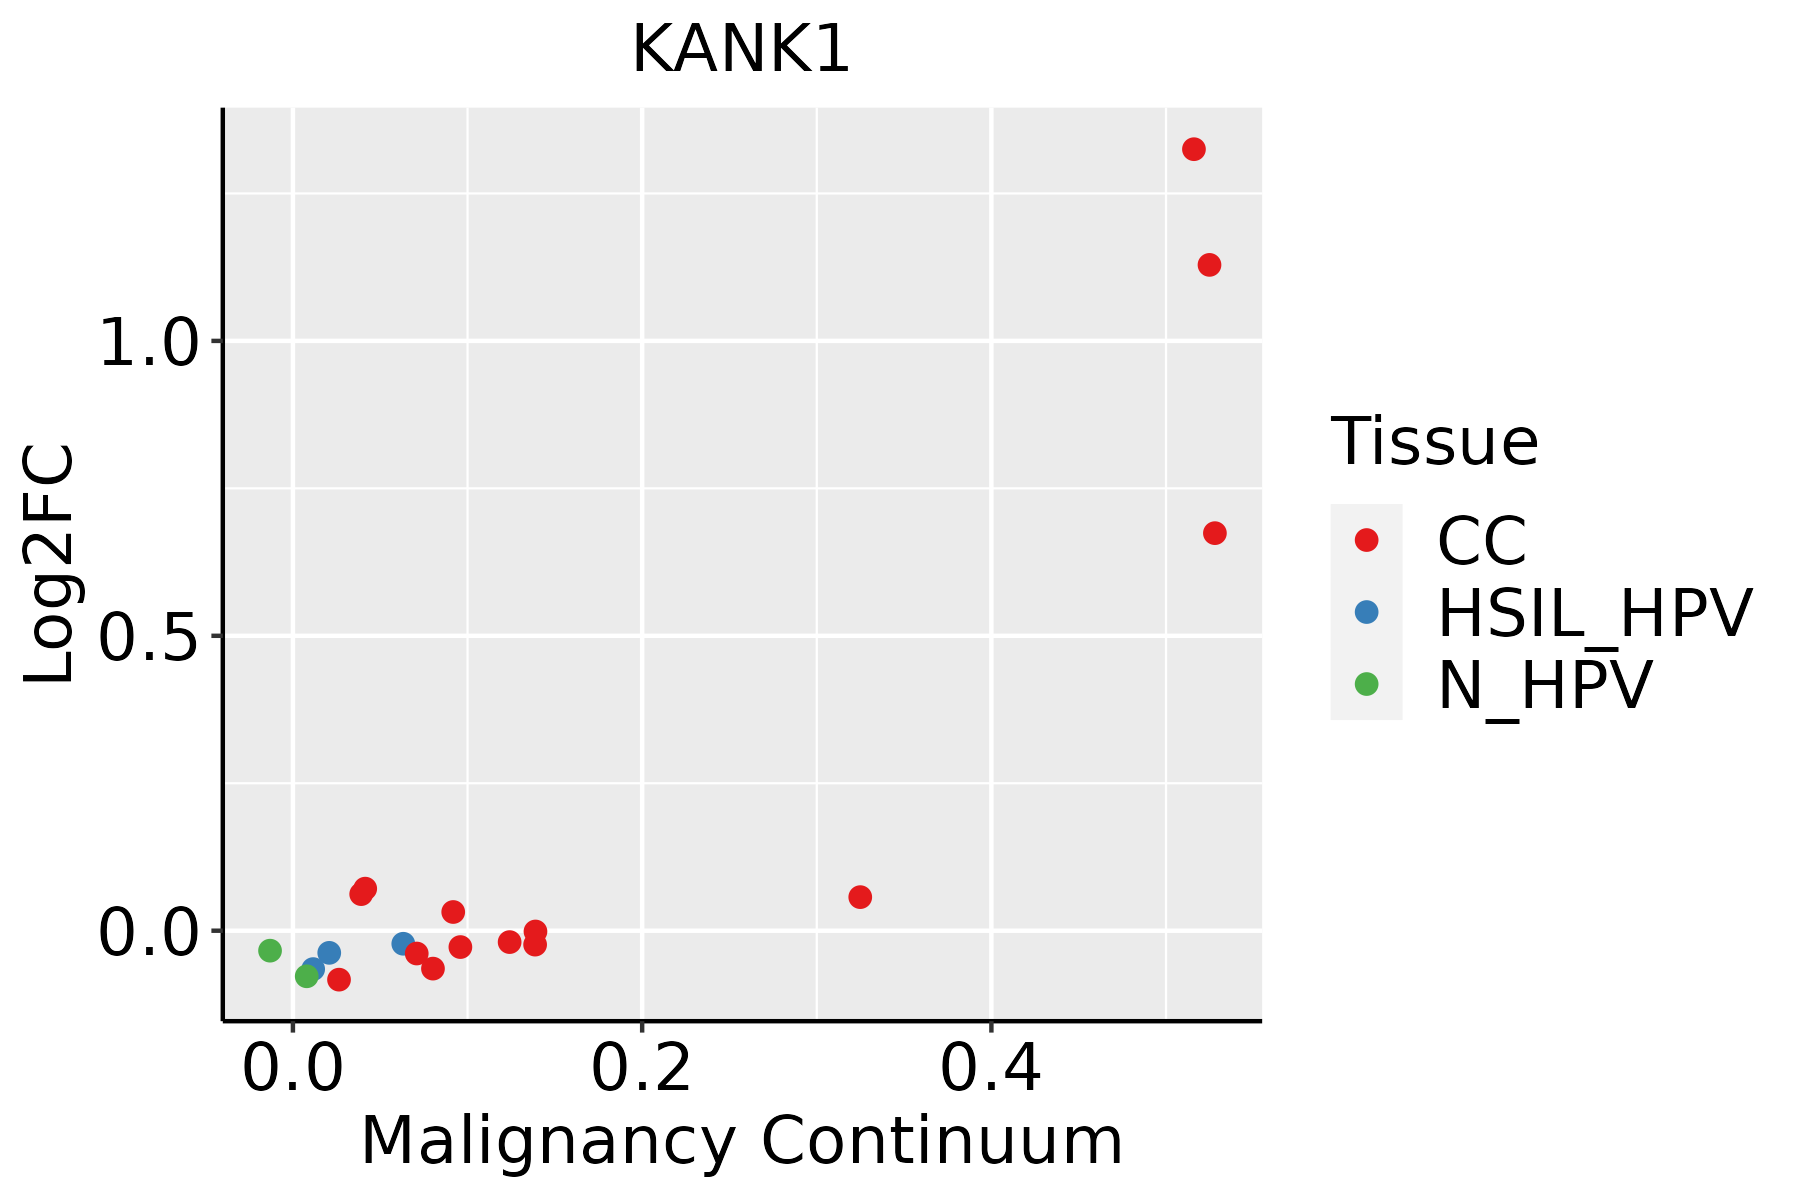 | CC: Cervix cancer |
| HSIL_HPV: HPV-infected high-grade squamous intraepithelial lesions |
| N_HPV: HPV-infected normal cervix |
| Colorectum (GSE201348) |  | FAP: Familial adenomatous polyposis |
| CRC: Colorectal cancer |
| Colorectum (HTA11) |  | AD: Adenomas |
| SER: Sessile serrated lesions |
| MSI-H: Microsatellite-high colorectal cancer |
| MSS: Microsatellite stable colorectal cancer |
| Endometrium |  | AEH: Atypical endometrial hyperplasia |
| EEC: Endometrioid Cancer |
| Liver | 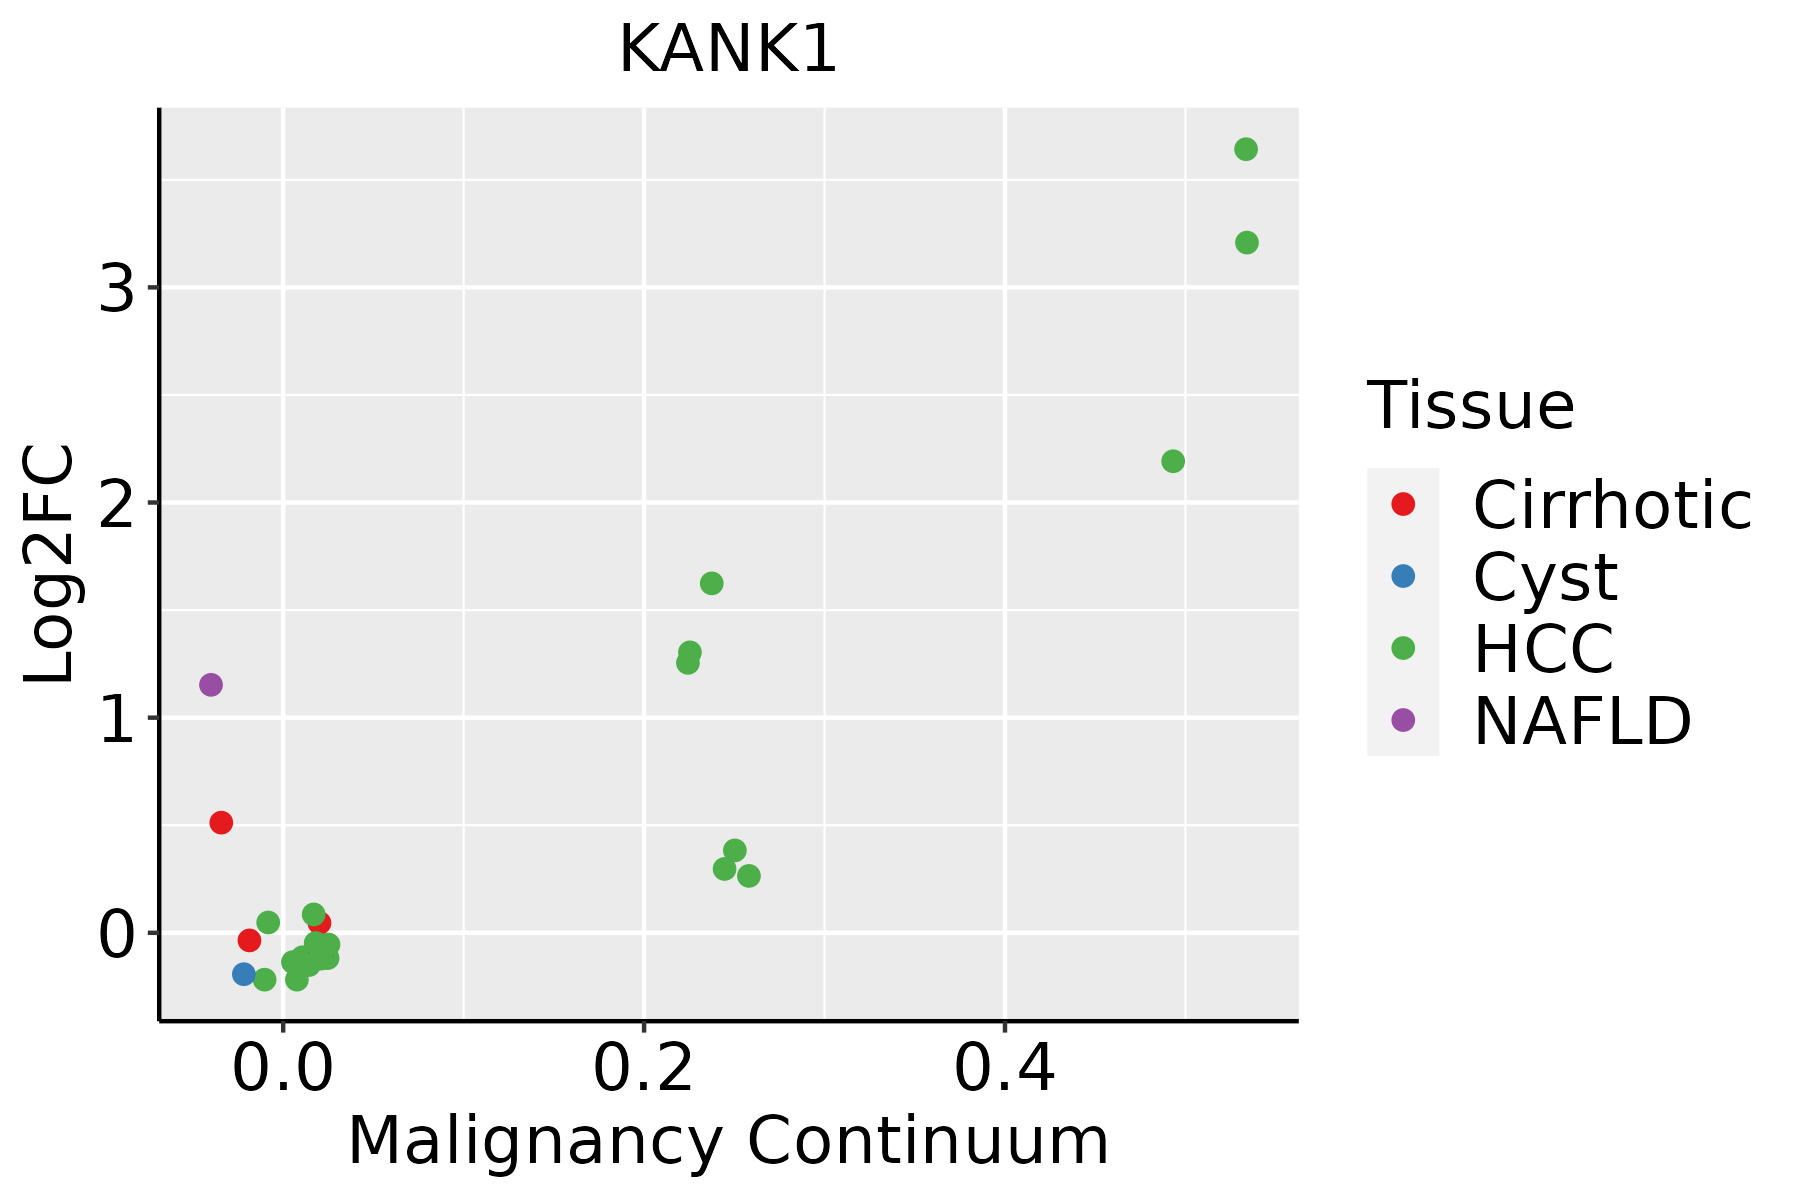 | HCC: Hepatocellular carcinoma |
| NAFLD: Non-alcoholic fatty liver disease |
| Lung |  | AAH: Atypical adenomatous hyperplasia |
| AIS: Adenocarcinoma in situ |
| IAC: Invasive lung adenocarcinoma |
| MIA: Minimally invasive adenocarcinoma |
| Oral Cavity |  | EOLP: Erosive Oral lichen planus |
| LP: leukoplakia |
| NEOLP: Non-erosive oral lichen planus |
| OSCC: Oral squamous cell carcinoma |
| Prostate | 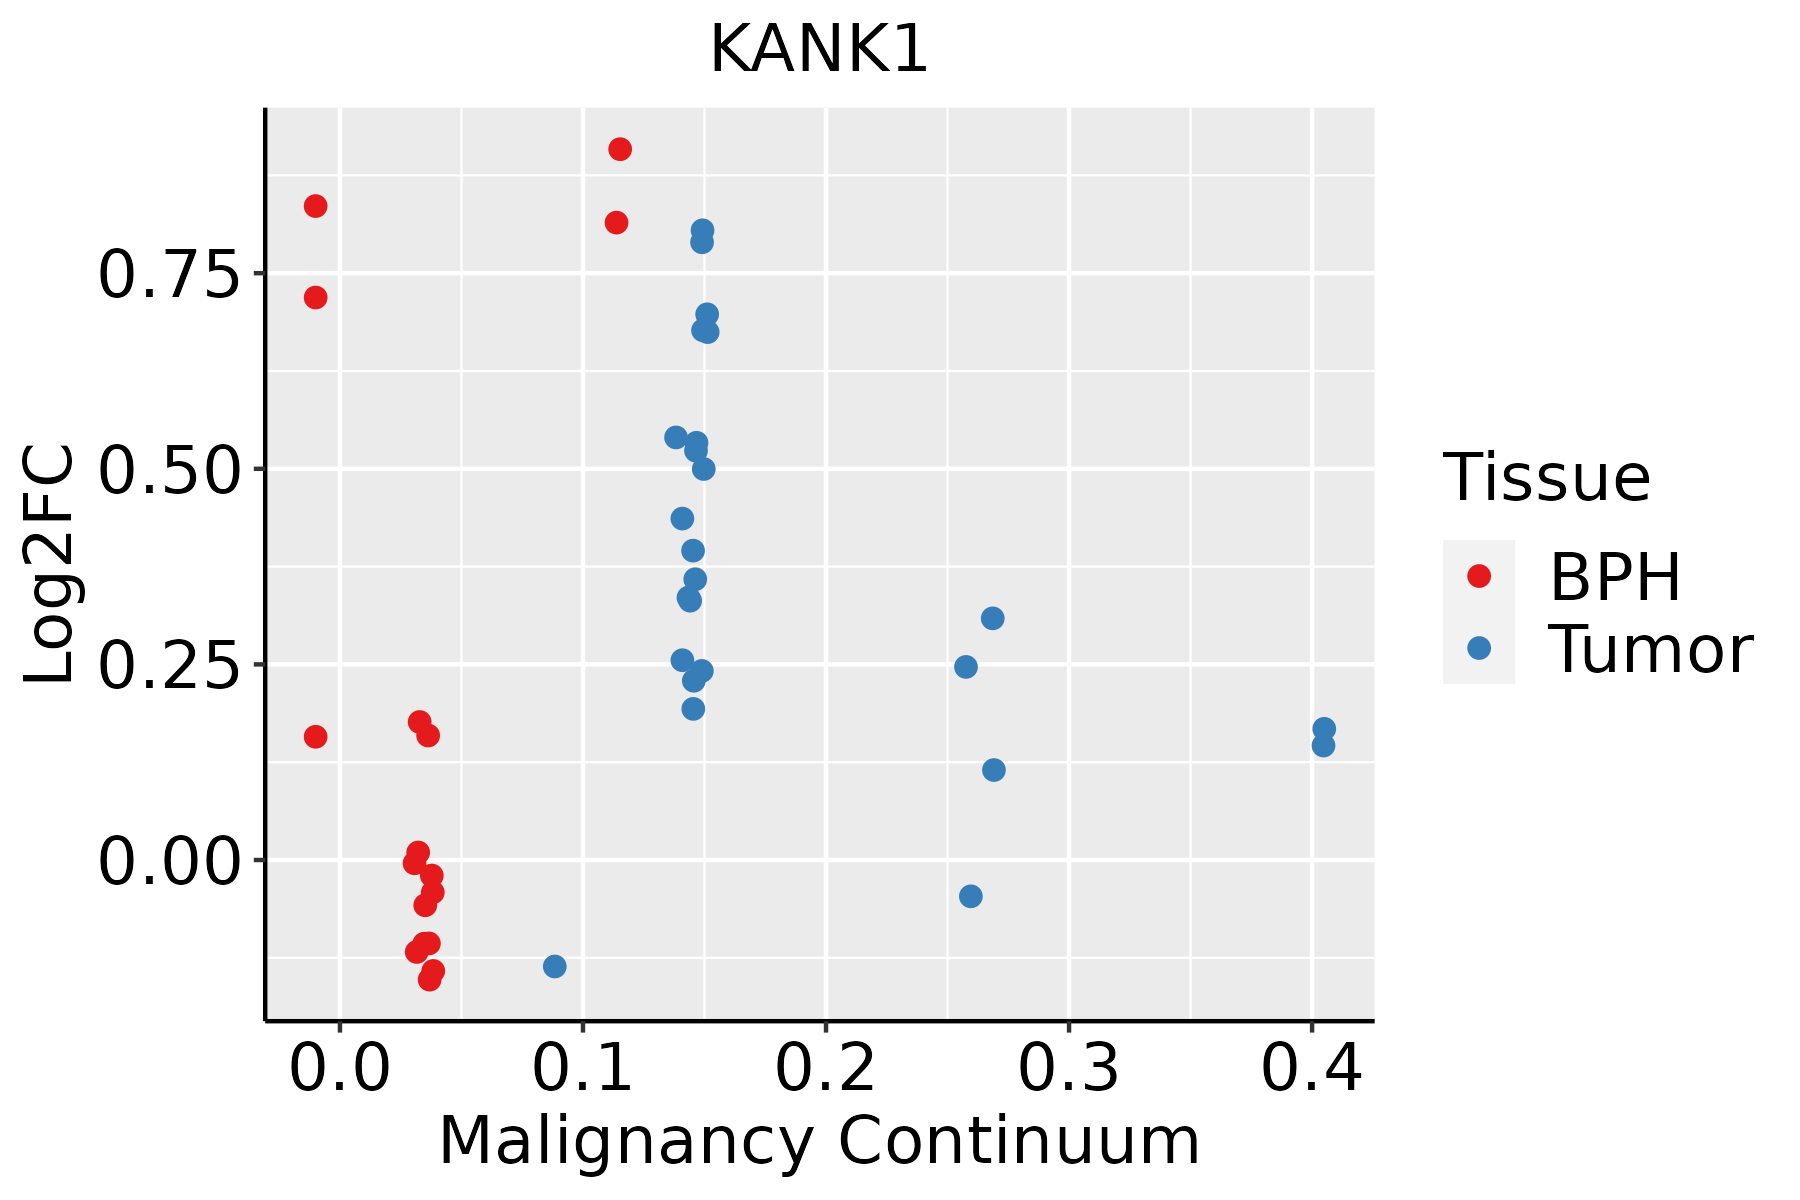 | BPH: Benign Prostatic Hyperplasia |
| Thyroid | 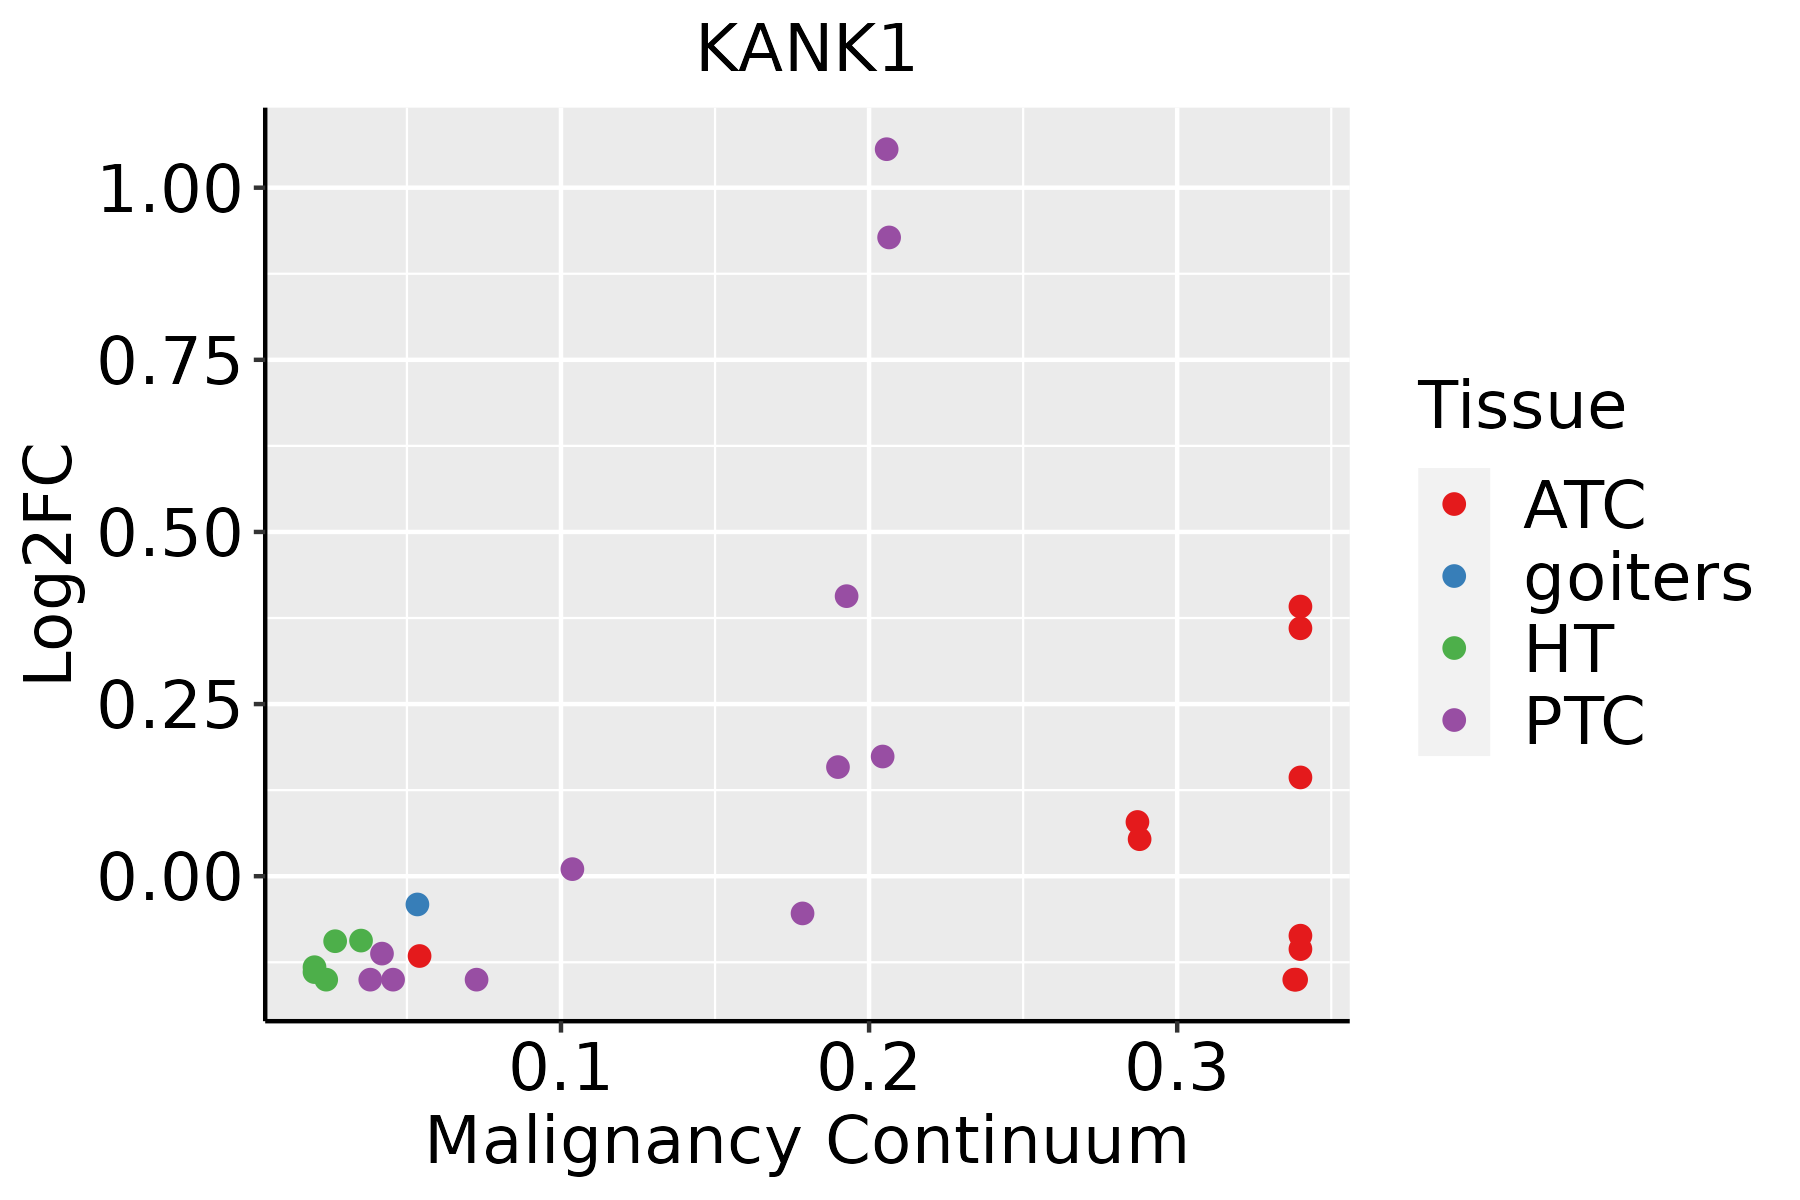 | ATC: Anaplastic thyroid cancer |
| HT: Hashimoto's thyroiditis |
| PTC: Papillary thyroid cancer |
| GO ID | Tissue | Disease Stage | Description | Gene Ratio | Bg Ratio | pvalue | p.adjust | Count |
| GO:001076927 | Thyroid | ATC | regulation of cell morphogenesis involved in differentiation | 59/6293 | 96/18723 | 2.08e-08 | 4.05e-07 | 59 |
| GO:0030041111 | Thyroid | ATC | actin filament polymerization | 101/6293 | 191/18723 | 2.91e-08 | 5.50e-07 | 101 |
| GO:004343428 | Thyroid | ATC | response to peptide hormone | 192/6293 | 414/18723 | 3.63e-08 | 6.70e-07 | 192 |
| GO:003444634 | Thyroid | ATC | substrate adhesion-dependent cell spreading | 64/6293 | 108/18723 | 3.98e-08 | 7.31e-07 | 64 |
| GO:001063131 | Thyroid | ATC | epithelial cell migration | 169/6293 | 357/18723 | 4.21e-08 | 7.69e-07 | 169 |
| GO:0030010111 | Thyroid | ATC | establishment of cell polarity | 79/6293 | 143/18723 | 8.08e-08 | 1.40e-06 | 79 |
| GO:190002427 | Thyroid | ATC | regulation of substrate adhesion-dependent cell spreading | 39/6293 | 57/18723 | 8.16e-08 | 1.41e-06 | 39 |
| GO:009013031 | Thyroid | ATC | tissue migration | 171/6293 | 365/18723 | 8.55e-08 | 1.47e-06 | 171 |
| GO:009013231 | Thyroid | ATC | epithelium migration | 169/6293 | 360/18723 | 8.57e-08 | 1.47e-06 | 169 |
| GO:0090263110 | Thyroid | ATC | positive regulation of canonical Wnt signaling pathway | 62/6293 | 106/18723 | 1.26e-07 | 2.09e-06 | 62 |
| GO:0030833110 | Thyroid | ATC | regulation of actin filament polymerization | 91/6293 | 172/18723 | 1.34e-07 | 2.20e-06 | 91 |
| GO:007137524 | Thyroid | ATC | cellular response to peptide hormone stimulus | 138/6293 | 290/18723 | 4.90e-07 | 7.05e-06 | 138 |
| GO:012003223 | Thyroid | ATC | regulation of plasma membrane bounded cell projection assembly | 95/6293 | 186/18723 | 6.13e-07 | 8.49e-06 | 95 |
| GO:0060491111 | Thyroid | ATC | regulation of cell projection assembly | 95/6293 | 188/18723 | 1.14e-06 | 1.47e-05 | 95 |
| GO:003286824 | Thyroid | ATC | response to insulin | 126/6293 | 264/18723 | 1.24e-06 | 1.59e-05 | 126 |
| GO:003286923 | Thyroid | ATC | cellular response to insulin stimulus | 101/6293 | 203/18723 | 1.34e-06 | 1.69e-05 | 101 |
| GO:005105618 | Thyroid | ATC | regulation of small GTPase mediated signal transduction | 141/6293 | 302/18723 | 1.43e-06 | 1.77e-05 | 141 |
| GO:000726619 | Thyroid | ATC | Rho protein signal transduction | 73/6293 | 137/18723 | 1.58e-06 | 1.93e-05 | 73 |
| GO:004657818 | Thyroid | ATC | regulation of Ras protein signal transduction | 94/6293 | 189/18723 | 3.12e-06 | 3.55e-05 | 94 |
| GO:190290426 | Thyroid | ATC | negative regulation of supramolecular fiber organization | 82/6293 | 167/18723 | 2.35e-05 | 2.06e-04 | 82 |
| Hugo Symbol | Variant Class | Variant Classification | dbSNP RS | HGVSc | HGVSp | HGVSp Short | SWISSPROT | BIOTYPE | SIFT | PolyPhen | Tumor Sample Barcode | Tissue | Histology | Sex | Age | Stage | Therapy Types | Drugs | Outcome |
| KANK1 | SNV | Missense_Mutation | rs761714605 | c.2255N>T | p.Ser752Leu | p.S752L | Q14678 | protein_coding | deleterious(0.01) | benign(0.219) | TCGA-AC-A23H-01 | Breast | breast invasive carcinoma | Female | >=65 | I/II | Unknown | Unknown | PD |
| KANK1 | SNV | Missense_Mutation | rs775231755 | c.3806N>T | p.Thr1269Met | p.T1269M | Q14678 | protein_coding | deleterious(0) | probably_damaging(0.989) | TCGA-AC-A62V-01 | Breast | breast invasive carcinoma | Male | <65 | III/IV | Targeted Molecular therapy | denosumab | PD |
| KANK1 | SNV | Missense_Mutation | novel | c.2756N>T | p.Ser919Ile | p.S919I | Q14678 | protein_coding | tolerated(0.2) | benign(0.08) | TCGA-AN-A046-01 | Breast | breast invasive carcinoma | Female | >=65 | I/II | Unknown | Unknown | SD |
| KANK1 | SNV | Missense_Mutation | | c.2482N>C | p.Glu828Gln | p.E828Q | Q14678 | protein_coding | tolerated(0.08) | probably_damaging(0.981) | TCGA-AO-A03O-01 | Breast | breast invasive carcinoma | Female | >=65 | I/II | Chemotherapy | doxorubicin | SD |
| KANK1 | SNV | Missense_Mutation | novel | c.3775N>A | p.Asp1259Asn | p.D1259N | Q14678 | protein_coding | deleterious(0.04) | possibly_damaging(0.737) | TCGA-BH-A0B6-01 | Breast | breast invasive carcinoma | Female | <65 | I/II | Unknown | Unknown | SD |
| KANK1 | SNV | Missense_Mutation | novel | c.2071N>T | p.Leu691Phe | p.L691F | Q14678 | protein_coding | tolerated(0.41) | benign(0.003) | TCGA-BH-A0E1-01 | Breast | breast invasive carcinoma | Female | <65 | I/II | Chemotherapy | cytoxan | SD |
| KANK1 | SNV | Missense_Mutation | novel | c.847N>G | p.Thr283Ala | p.T283A | Q14678 | protein_coding | tolerated(0.09) | probably_damaging(0.917) | TCGA-BH-A0HA-01 | Breast | breast invasive carcinoma | Female | <65 | I/II | Unknown | Unknown | SD |
| KANK1 | SNV | Missense_Mutation | | c.3232N>A | p.Glu1078Lys | p.E1078K | Q14678 | protein_coding | deleterious(0.04) | benign(0.147) | TCGA-BH-A0HF-01 | Breast | breast invasive carcinoma | Female | >=65 | I/II | Hormone Therapy | arimidex | SD |
| KANK1 | SNV | Missense_Mutation | novel | c.908C>T | p.Ser303Leu | p.S303L | Q14678 | protein_coding | deleterious(0.03) | benign(0.005) | TCGA-E2-A2P6-01 | Breast | breast invasive carcinoma | Female | >=65 | I/II | Hormone Therapy | anastrozole | SD |
| KANK1 | SNV | Missense_Mutation | novel | c.1960G>A | p.Ala654Thr | p.A654T | Q14678 | protein_coding | tolerated(0.62) | benign(0) | TCGA-OL-A5RW-01 | Breast | breast invasive carcinoma | Female | <65 | I/II | Chemotherapy | adriamycin | CR |


