Schematic overview of the cellular and molecular mechanisms involved in the cancer progression, including the proposed cellular and molecular mechanisms in cancer cells trajectory. AT1: alveolar type 1 cells; AT2: alveolar type 2 cells; AAH: atypical adenomatous hyperplasia; AIS: adenocarcinoma in situ; MIA: minimally invasive adenocarcinoma; IA: invasive adenocarcinoma; EMT: epithelial-mesenchymal transition

Home

Download

Statistics

Help

Contact

Center for Computational Systems Medicine
leaf

Gene summary

leaf

Malignant transformation analysis

leaf

Malignant transformation related pathway analysis

leaf

Cell-cell communication analysis

leaf

Single-cell gene regulatory network inference analysis

leaf

Somatic mutation of malignant transformation related genes

leaf

Related drugs of malignant transformation related genes

Gene: SMAD3

Gene summary for SMAD3

check button Gene summary.

Gene informationSpeciesHuman
Gene symbol

SMAD3

Gene ID

4088

Gene nameSMAD family member 3
Gene AliasHSPC193
Cytomap15q22.33
Gene Typeprotein-coding
GO ID

GO:0000122

UniProtAcc

P84022


Top

Malignant transformation analysis

check button Identification of the aberrant gene expression in precancerous and cancerous lesions by comparing the gene expression of stem-like cells in diseased tissues with normal stem cells
check button Malignant transformation involving gene list.
Entrez IDSymbolReplicatesSpeciesOrganTissueAdj P-valueLog2FCMalignancy
4088SMAD3CCI_1HumanCervixCC2.90e-171.82e+000.528
4088SMAD3CCI_2HumanCervixCC1.28e-191.89e+000.5249
4088SMAD3CCI_3HumanCervixCC4.06e-271.85e+000.516
4088SMAD3TumorHumanCervixCC1.06e-123.99e-010.1241
4088SMAD3sample3HumanCervixCC1.83e-225.39e-010.1387
4088SMAD3T3HumanCervixCC5.09e-255.80e-010.1389
4088SMAD3HTA11_347_2000001011HumanColorectumAD3.53e-063.99e-01-0.1954
4088SMAD3HTA11_411_2000001011HumanColorectumSER3.23e-021.04e+00-0.2602
4088SMAD3HTA11_1391_2000001011HumanColorectumAD2.06e-025.25e-01-0.059
4088SMAD3A015-C-203HumanColorectumFAP5.24e-15-1.60e-01-0.1294
4088SMAD3A002-C-201HumanColorectumFAP4.13e-04-1.05e-010.0324
4088SMAD3A001-C-108HumanColorectumFAP6.05e-09-1.35e-01-0.0272
4088SMAD3A002-C-205HumanColorectumFAP4.11e-09-1.17e-01-0.1236
4088SMAD3A015-C-006HumanColorectumFAP5.40e-06-2.48e-01-0.0994
4088SMAD3A015-C-106HumanColorectumFAP5.40e-08-1.36e-01-0.0511
4088SMAD3A002-C-114HumanColorectumFAP3.14e-06-1.79e-01-0.1561
4088SMAD3A015-C-104HumanColorectumFAP9.75e-17-2.49e-01-0.1899
4088SMAD3A001-C-014HumanColorectumFAP2.24e-05-9.96e-020.0135
4088SMAD3A002-C-016HumanColorectumFAP4.45e-09-1.52e-010.0521
4088SMAD3A015-C-002HumanColorectumFAP8.60e-04-9.05e-02-0.0763
Page: 1 2 3 4 5 6 7 8 9 

check button Transcriptomic changes along malignancy continuum.
TissueExpression DynamicsAbbreviation
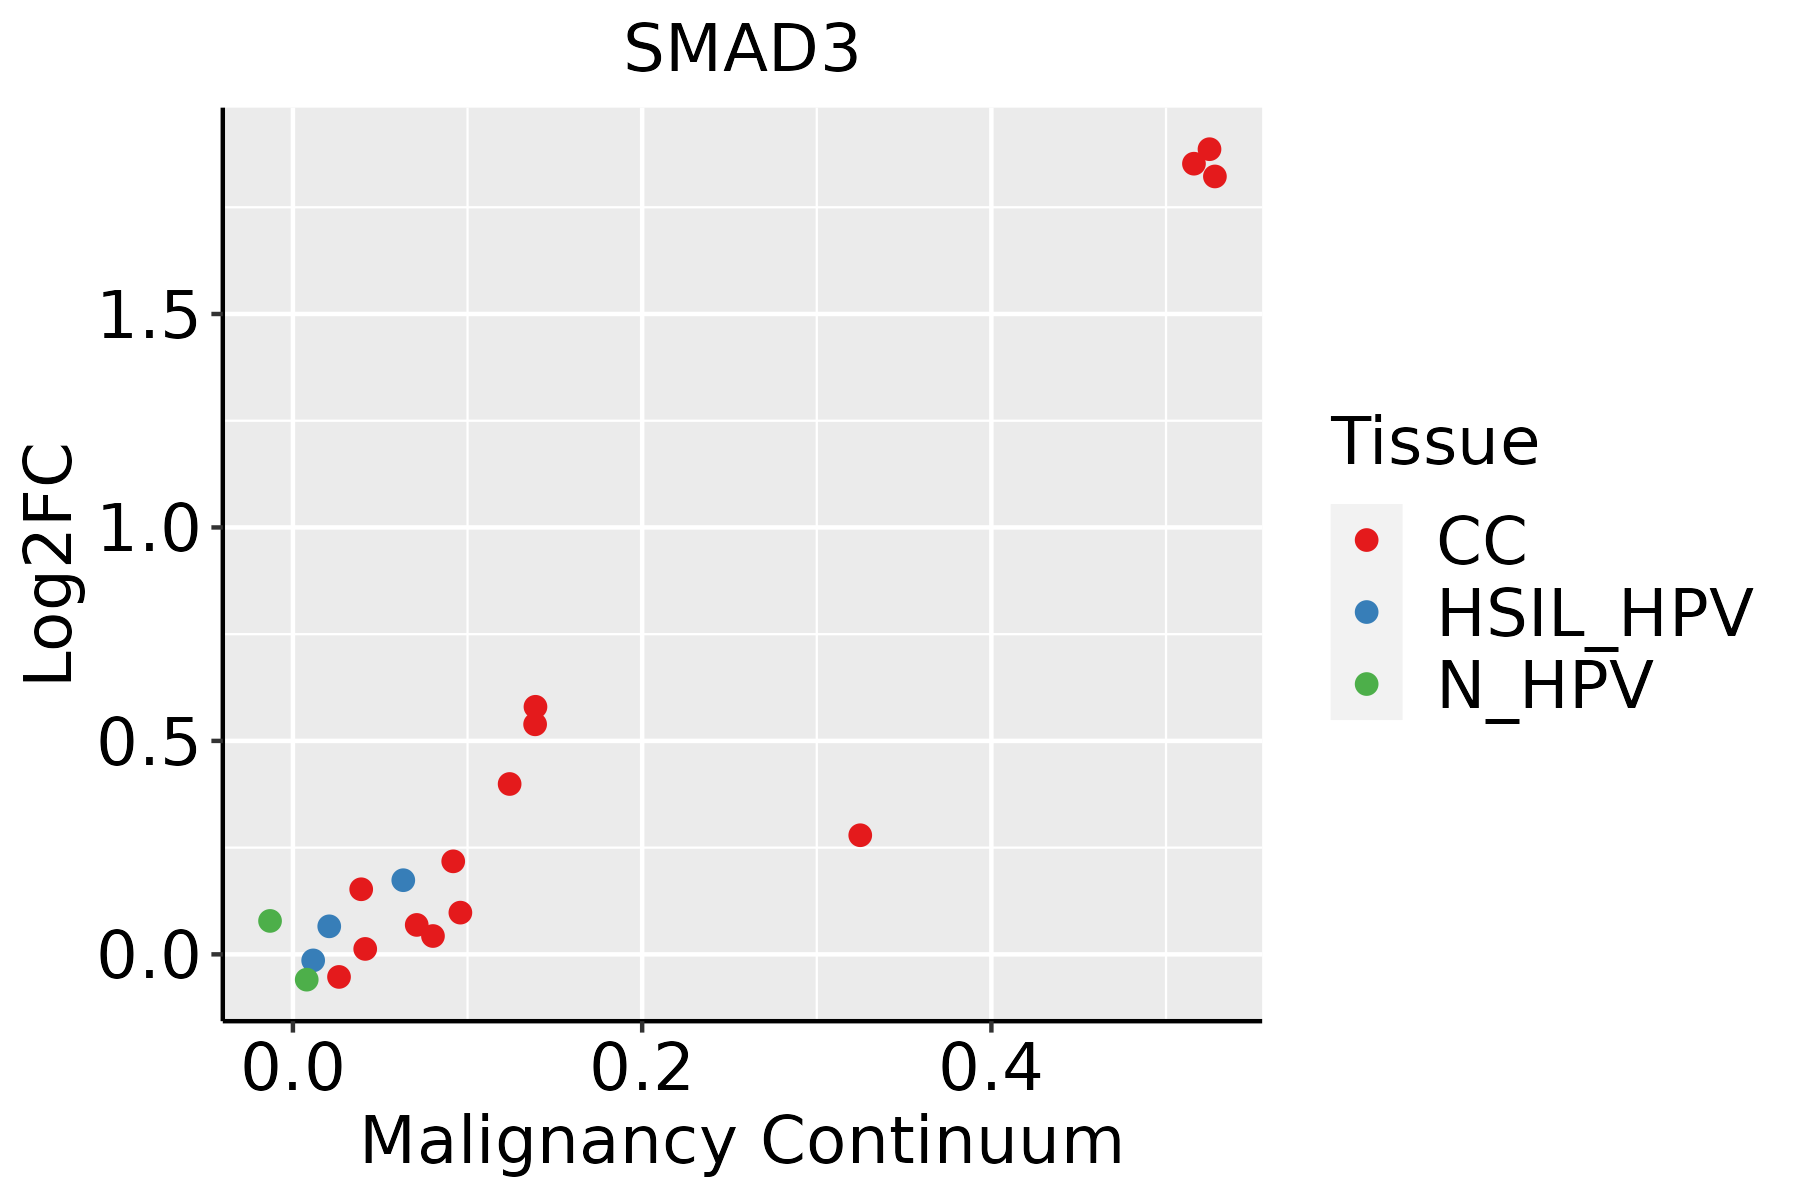
CervixThe image shows the transcriptomic changes along malignancy continuum.log2FC in expression of this searched gene in stem-like cells from each diseased tissue sample relative to stem-like cells in normal samples in each tissue plotted against the malignancy continuum. Samples are colored based on if they are from different disease stage.CC: Cervix cancer
HSIL_HPV: HPV-infected high-grade squamous intraepithelial lesions
N_HPV: HPV-infected normal cervix
Colorectum (GSE201348)The image shows the transcriptomic changes along malignancy continuum.log2FC in expression of this searched gene in stem-like cells from each diseased tissue sample relative to stem-like cells in normal samples in each tissue plotted against the malignancy continuum. Samples are colored based on if they are from different disease stage.FAP: Familial adenomatous polyposis
CRC: Colorectal cancer
Colorectum (HTA11)The image shows the transcriptomic changes along malignancy continuum.log2FC in expression of this searched gene in stem-like cells from each diseased tissue sample relative to stem-like cells in normal samples in each tissue plotted against the malignancy continuum. Samples are colored based on if they are from different disease stage.AD: Adenomas
SER: Sessile serrated lesions
MSI-H: Microsatellite-high colorectal cancer
MSS: Microsatellite stable colorectal cancer
EsophagusThe image shows the transcriptomic changes along malignancy continuum.log2FC in expression of this searched gene in stem-like cells from each diseased tissue sample relative to stem-like cells in normal samples in each tissue plotted against the malignancy continuum. Samples are colored based on if they are from different disease stage.ESCC: Esophageal squamous cell carcinoma
HGIN: High-grade intraepithelial neoplasias
LGIN: Low-grade intraepithelial neoplasias
GCThe image shows the transcriptomic changes along malignancy continuum.log2FC in expression of this searched gene in stem-like cells from each diseased tissue sample relative to stem-like cells in normal samples in each tissue plotted against the malignancy continuum. Samples are colored based on if they are from different disease stage.CAG: Chronic atrophic gastritis
CAG with IM: Chronic atrophic gastritis with intestinal metaplasia
CSG: Chronic superficial gastritis
GC: Gastric cancer
SIM: Severe intestinal metaplasia
WIM: Wild intestinal metaplasia
LiverThe image shows the transcriptomic changes along malignancy continuum.log2FC in expression of this searched gene in stem-like cells from each diseased tissue sample relative to stem-like cells in normal samples in each tissue plotted against the malignancy continuum. Samples are colored based on if they are from different disease stage.HCC: Hepatocellular carcinoma
NAFLD: Non-alcoholic fatty liver disease
Oral CavityThe image shows the transcriptomic changes along malignancy continuum.log2FC in expression of this searched gene in stem-like cells from each diseased tissue sample relative to stem-like cells in normal samples in each tissue plotted against the malignancy continuum. Samples are colored based on if they are from different disease stage.EOLP: Erosive Oral lichen planus
LP: leukoplakia
NEOLP: Non-erosive oral lichen planus
OSCC: Oral squamous cell carcinoma
ProstateThe image shows the transcriptomic changes along malignancy continuum.log2FC in expression of this searched gene in stem-like cells from each diseased tissue sample relative to stem-like cells in normal samples in each tissue plotted against the malignancy continuum. Samples are colored based on if they are from different disease stage.BPH: Benign Prostatic Hyperplasia
ThyroidThe image shows the transcriptomic changes along malignancy continuum.log2FC in expression of this searched gene in stem-like cells from each diseased tissue sample relative to stem-like cells in normal samples in each tissue plotted against the malignancy continuum. Samples are colored based on if they are from different disease stage.ATC: Anaplastic thyroid cancer
HT: Hashimoto's thyroiditis
PTC: Papillary thyroid cancer
∗log2FC in expression of this searched gene in stem-like cells from each diseased tissue sample relative to stem-like cells in normal samples in each tissue plotted against the malignancy continuum. Samples are colored based on if they are from different disease stage.

Top

Malignant transformation related pathway analysis

check buttonFind out the enriched GO biological processes and KEGG pathways involved in transition from healthy to precancer to cancer
check button Figure of enriched GO biological processes.
TissueDisease StageEnriched GO biological Processes
ColorectumADGO analysis - Figure of enriched GO biological processes: Top 15 enriched GO BP terms are showed in the bar plot of each disease state in each tissue. Each row represents a significant GO biological process which is colored according to the -log10(p.adjust).
ColorectumSERGO analysis - Figure of enriched GO biological processes: Top 15 enriched GO BP terms are showed in the bar plot of each disease state in each tissue. Each row represents a significant GO biological process which is colored according to the -log10(p.adjust).
ColorectumMSSGO analysis - Figure of enriched GO biological processes: Top 15 enriched GO BP terms are showed in the bar plot of each disease state in each tissue. Each row represents a significant GO biological process which is colored according to the -log10(p.adjust).
ColorectumMSI-HGO analysis - Figure of enriched GO biological processes: Top 15 enriched GO BP terms are showed in the bar plot of each disease state in each tissue. Each row represents a significant GO biological process which is colored according to the -log10(p.adjust).
ColorectumFAPGO analysis - Figure of enriched GO biological processes: Top 15 enriched GO BP terms are showed in the bar plot of each disease state in each tissue. Each row represents a significant GO biological process which is colored according to the -log10(p.adjust).
∗Top 15 enriched GO BP terms are showed in the bar plot of each disease state in each tissue. Each row represents a significant GO biological process which is colored according to the -log10(p.adjust).
Page: 1 2 3 4 5 6 7 8 9 

check button Enriched GO biological processes.
GO IDTissueDisease StageDescriptionGene RatioBg Ratiopvaluep.adjustCount
GO:00301779Oral cavityOSCCpositive regulation of Wnt signaling pathway73/7305140/187231.06e-035.46e-0373
GO:00985866Oral cavityOSCCcellular response to virus47/730584/187231.20e-036.06e-0347
GO:00107173Oral cavityOSCCregulation of epithelial to mesenchymal transition54/730599/187231.21e-036.10e-0354
GO:003003819Oral cavityOSCCcontractile actin filament bundle assembly57/7305106/187231.42e-036.84e-0357
GO:004314919Oral cavityOSCCstress fiber assembly57/7305106/187231.42e-036.84e-0357
GO:000181910Oral cavityOSCCpositive regulation of cytokine production213/7305467/187231.93e-038.96e-03213
GO:003223119Oral cavityOSCCregulation of actin filament bundle assembly56/7305105/187231.99e-039.23e-0356
GO:006104116Oral cavityOSCCregulation of wound healing69/7305134/187232.19e-039.95e-0369
GO:19028958Oral cavityOSCCpositive regulation of pri-miRNA transcription by RNA polymerase II26/730542/187232.22e-031.00e-0226
GO:00071789Oral cavityOSCCtransmembrane receptor protein serine/threonine kinase signaling pathway165/7305355/187232.31e-031.02e-02165
GO:001092110Oral cavityOSCCregulation of phosphatase activity46/730584/187232.43e-031.07e-0246
GO:00605378Oral cavityOSCCmuscle tissue development185/7305403/187232.60e-031.14e-02185
GO:00353065Oral cavityOSCCpositive regulation of dephosphorylation34/730559/187232.86e-031.24e-0234
GO:00716045Oral cavityOSCCtransforming growth factor beta production26/730543/187233.55e-031.49e-0226
GO:00716346Oral cavityOSCCregulation of transforming growth factor beta production25/730541/187233.60e-031.51e-0225
GO:004521618Oral cavityOSCCcell-cell junction organization97/7305200/187233.83e-031.57e-0297
GO:00310507Oral cavityOSCCdsRNA processing31/730554/187234.66e-031.87e-0231
GO:00709187Oral cavityOSCCproduction of small RNA involved in gene silencing by RNA31/730554/187234.66e-031.87e-0231
GO:00351968Oral cavityOSCCproduction of miRNAs involved in gene silencing by miRNA30/730552/187234.84e-031.92e-0230
GO:00514969Oral cavityOSCCpositive regulation of stress fiber assembly30/730552/187234.84e-031.92e-0230
Page: 1 2 3 4 5 6 7 8 9 10 11 12 13 14 15 16 17 18 19 20 21 22 23 24 25 26 27 28 29 30 31 32 33 34 35 36 37 38 39 40 41 42 43 44 45 46 47 48 49 50 51 52 53 54 55 56 57 58 59 60 61 62 63 64 65 66 67 68 69 70 71 72 73 74 75 76 77 78 79 80 81 82 83 84 85 86 87 88 89 90 91 92 93 94 95 96 97 98 99 100 101 102 103 104 105 106 107 108 109 110 111 112 113 114 115 116 117 118 119 120 121 122 123 124 125 126 127 128 129 130 131 132 133 134 135 

check button Enriched KEGG pathways.
Pathway IDTissueDisease StageDescriptionGene RatioBg Ratiopvaluep.adjustqvalueCount
hsa0541520CervixCCDiabetic cardiomyopathy76/1267203/84651.40e-156.46e-143.82e-1476
hsa0421810CervixCCCellular senescence49/1267156/84651.30e-071.63e-069.61e-0749
hsa0452020CervixCCAdherens junction33/126793/84656.99e-077.31e-064.32e-0633
hsa0516620CervixCCHuman T-cell leukemia virus 1 infection61/1267222/84658.13e-077.98e-064.72e-0661
hsa0414418CervixCCEndocytosis64/1267251/84656.97e-066.10e-053.61e-0564
hsa0521010CervixCCColorectal cancer27/126786/84658.60e-055.57e-043.30e-0427
hsa052128CervixCCPancreatic cancer24/126776/84651.89e-041.11e-036.55e-0424
hsa043109CervixCCWnt signaling pathway43/1267171/84653.03e-041.64e-039.68e-0443
hsa043908CervixCCHippo signaling pathway40/1267157/84653.64e-041.82e-031.07e-0340
hsa0522510CervixCCHepatocellular carcinoma40/1267168/84651.52e-036.39e-033.78e-0340
hsa046596CervixCCTh17 cell differentiation28/1267108/84651.99e-037.98e-034.72e-0328
hsa0522014CervixCCChronic myeloid leukemia21/126776/84653.08e-031.19e-027.03e-0321
hsa041106CervixCCCell cycle36/1267157/84654.94e-031.67e-029.86e-0336
hsa049336CervixCCAGE-RAGE signaling pathway in diabetic complications25/1267100/84655.64e-031.88e-021.11e-0225
hsa05415110CervixCCDiabetic cardiomyopathy76/1267203/84651.40e-156.46e-143.82e-1476
hsa0421815CervixCCCellular senescence49/1267156/84651.30e-071.63e-069.61e-0749
hsa04520110CervixCCAdherens junction33/126793/84656.99e-077.31e-064.32e-0633
hsa05166110CervixCCHuman T-cell leukemia virus 1 infection61/1267222/84658.13e-077.98e-064.72e-0661
hsa0414419CervixCCEndocytosis64/1267251/84656.97e-066.10e-053.61e-0564
hsa0521015CervixCCColorectal cancer27/126786/84658.60e-055.57e-043.30e-0427
Page: 1 2 3 4 5 6 7 8 9 10 11 12 13 14 15 16 17 18 19 20 

Top

Cell-cell communication analysis

check buttonIdentification of potential cell-cell interactions between two cell types and their ligand-receptor pairs for different disease states
LigandReceptorLRpairPathwayTissueDisease Stage
Page: 1 

Top

Single-cell gene regulatory network inference analysis

check buttonFind out the significant the regulons (TFs) and the target genes of each regulon across cell types for different disease states
TFCell TypeTissueDisease StageTarget GeneRSSRegulon Activity
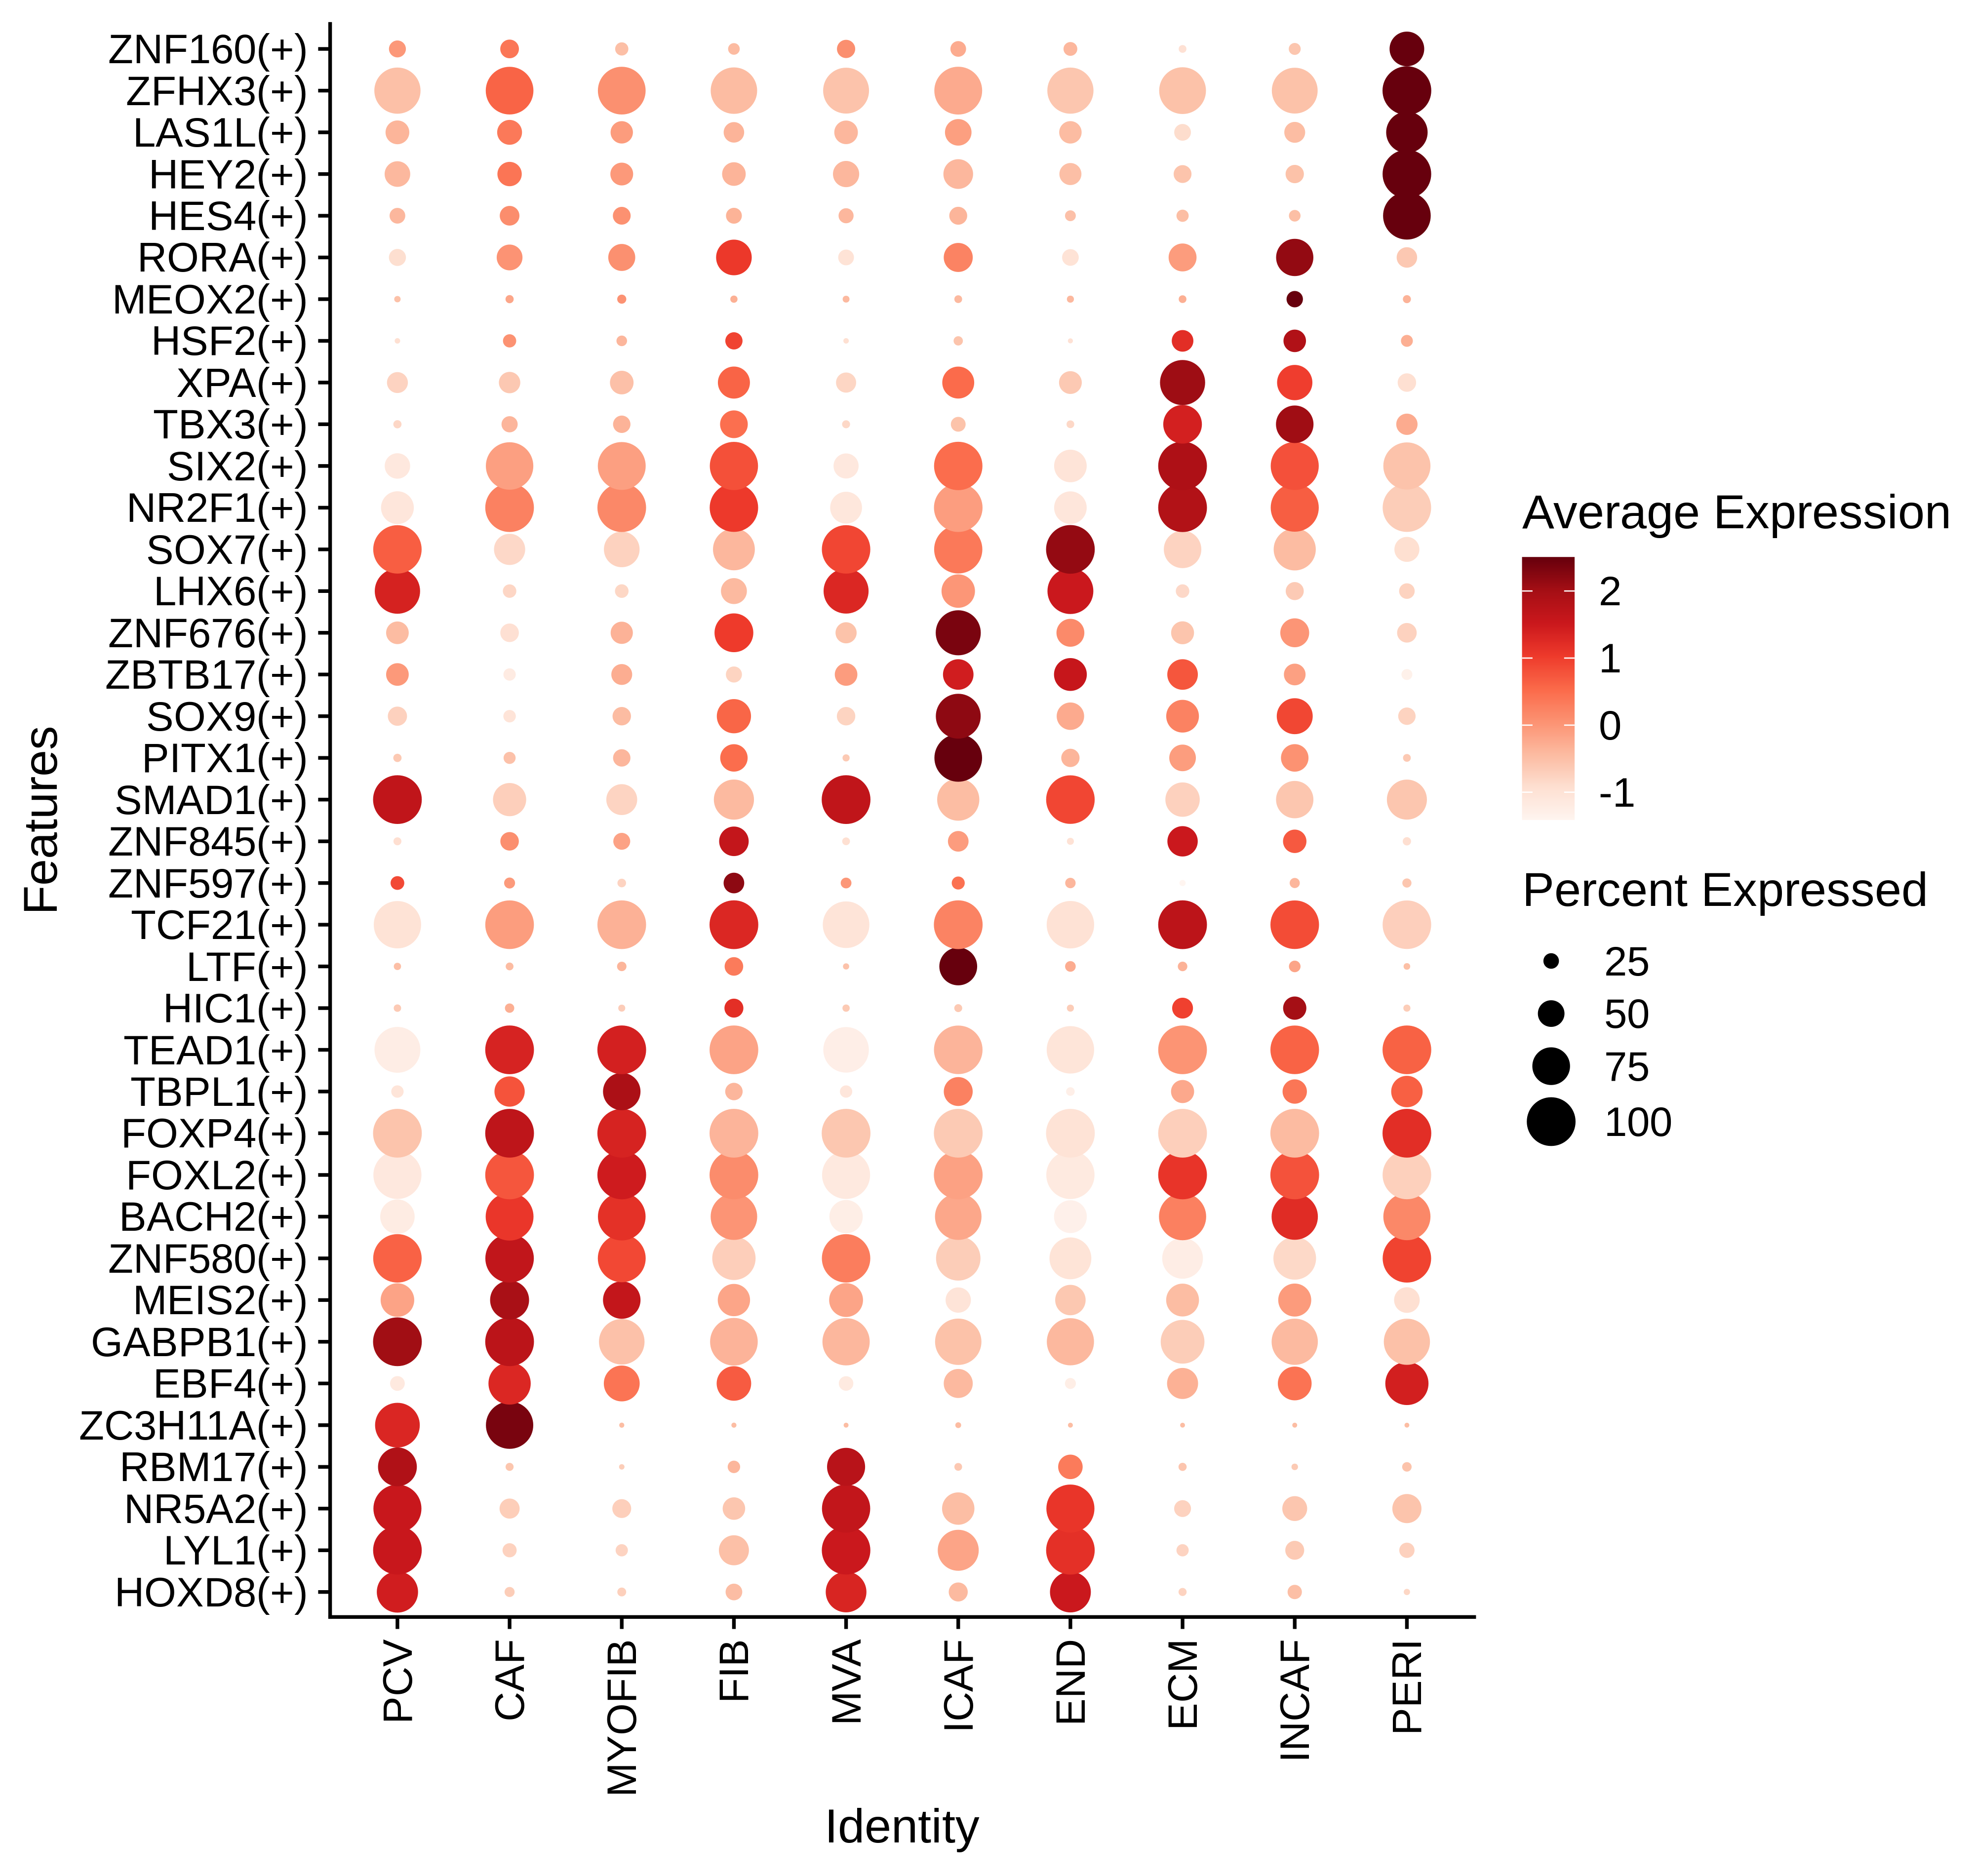
SMAD3MESCervixHealthyEPAS1,GAS5,ALDH1A3, etc.2.53e-01The dot plots of a searched regulon are shown for all cell subpopulations in each disease state of each tissue based on the regulon specific score inferred using pySCENIC and by calculating the average expression.
SMAD3CD8TCMCervixADJACTN4,NDE1,PVT1, etc.7.66e-02The dot plots of a searched regulon are shown for all cell subpopulations in each disease state of each tissue based on the regulon specific score inferred using pySCENIC and by calculating the average expression.
SMAD3NKCervixHSIL_HPVACTN4,NDE1,PVT1, etc.1.19e-01The dot plots of a searched regulon are shown for all cell subpopulations in each disease state of each tissue based on the regulon specific score inferred using pySCENIC and by calculating the average expression.
SMAD3CD8TCMCervixN_HPVACTN4,NDE1,PVT1, etc.1.09e-01The dot plots of a searched regulon are shown for all cell subpopulations in each disease state of each tissue based on the regulon specific score inferred using pySCENIC and by calculating the average expression.
SMAD3NKCervixN_HPVACTN4,NDE1,PVT1, etc.7.47e-02The dot plots of a searched regulon are shown for all cell subpopulations in each disease state of each tissue based on the regulon specific score inferred using pySCENIC and by calculating the average expression.
SMAD3BNLiverHCCEPHX1,CMC1,P2RY8, etc.5.41e-02The dot plots of a searched regulon are shown for all cell subpopulations in each disease state of each tissue based on the regulon specific score inferred using pySCENIC and by calculating the average expression.
SMAD3MASTLungIACPID1,PLCB1,GRK5, etc.3.55e-02The dot plots of a searched regulon are shown for all cell subpopulations in each disease state of each tissue based on the regulon specific score inferred using pySCENIC and by calculating the average expression.
SMAD3NEUTLungIACPID1,PLCB1,GRK5, etc.2.31e-02The dot plots of a searched regulon are shown for all cell subpopulations in each disease state of each tissue based on the regulon specific score inferred using pySCENIC and by calculating the average expression.
SMAD3CD4TNLungIACPID1,PLCB1,GRK5, etc.1.96e-01The dot plots of a searched regulon are shown for all cell subpopulations in each disease state of each tissue based on the regulon specific score inferred using pySCENIC and by calculating the average expression.
SMAD3MMCLungIACPID1,PLCB1,GRK5, etc.2.32e-02The dot plots of a searched regulon are shown for all cell subpopulations in each disease state of each tissue based on the regulon specific score inferred using pySCENIC and by calculating the average expression.
∗The dot plots of a searched regulon are shown for all cell subpopulations in each disease state of each tissue based on the regulon specific score inferred using pySCENIC and by calculating the average expression.
Page: 1 2 3 

Top

Somatic mutation of malignant transformation related genes

check buttonAnnotation of somatic variants for genes involved in malignant transformation
Hugo SymbolVariant ClassVariant ClassificationdbSNP RSHGVScHGVSpHGVSp ShortSWISSPROTBIOTYPESIFTPolyPhenTumor Sample BarcodeTissueHistologySexAgeStageTherapy TypesDrugsOutcome
SMAD3SNVMissense_Mutationnovelc.1094N>Cp.Gln365Prop.Q365PP84022protein_codingdeleterious(0.01)possibly_damaging(0.882)TCGA-A2-A04R-01Breastbreast invasive carcinomaFemale<65I/IIChemotherapytaxolSD
SMAD3SNVMissense_Mutationrs779602560c.1145C>Tp.Ala382Valp.A382VP84022protein_codingdeleterious(0.04)benign(0.167)TCGA-A2-A0T6-01Breastbreast invasive carcinomaFemale<65I/IIChemotherapyadriamycinSD
SMAD3SNVMissense_Mutationrs863223765c.278N>Ap.Arg93Glnp.R93QP84022protein_codingdeleterious(0)probably_damaging(1)TCGA-E2-A152-01Breastbreast invasive carcinomaFemale<65I/IITargeted Molecular therapytrastuzumabPD
SMAD3SNVMissense_Mutationnovelc.611N>Ap.Ser204Tyrp.S204YP84022protein_codingtolerated(0.09)benign(0)TCGA-E9-A244-01Breastbreast invasive carcinomaFemale<65I/IIChemotherapycyclophosphamideSD
SMAD3SNVMissense_Mutationc.68N>Gp.Gln23Argp.Q23RP84022protein_codingdeleterious(0.01)benign(0.091)TCGA-EW-A1IZ-01Breastbreast invasive carcinomaFemale<65III/IVChemotherapytaxotereSD
SMAD3insertionNonsense_Mutationnovelc.263_264insTCTCTACTAAAAATACAAAAACAAAATTAGp.Tyr88_Cys89insLeuTyrTerLysTyrLysAsnLysIleSerp.Y88_C89insLY*KYKNKISP84022protein_codingTCGA-A2-A0D1-01Breastbreast invasive carcinomaFemale>=65I/IIChemotherapytaxotereSD
SMAD3SNVMissense_Mutationrs863223736c.728N>Ap.Arg243Hisp.R243HP84022protein_codingdeleterious(0)probably_damaging(1)TCGA-2W-A8YY-01Cervixcervical & endocervical cancerFemale<65I/IIChemotherapycisplatinCR
SMAD3SNVMissense_Mutationrs773543026c.730G>Ap.Val244Ilep.V244IP84022protein_codingtolerated(0.12)benign(0.395)TCGA-EA-A410-01Cervixcervical & endocervical cancerFemale<65I/IIUnknownUnknownSD
SMAD3SNVMissense_Mutationrs387906850c.859C>Tp.Arg287Trpp.R287WP84022protein_codingdeleterious(0)probably_damaging(1)TCGA-EA-A410-01Cervixcervical & endocervical cancerFemale<65I/IIUnknownUnknownSD
SMAD3SNVMissense_Mutationc.384G>Cp.Gln128Hisp.Q128HP84022protein_codingdeleterious(0.02)possibly_damaging(0.528)TCGA-EK-A2RJ-01Cervixcervical & endocervical cancerFemale<65I/IIUnknownUnknownSD
Page: 1 2 3 4 5 6 7 8 9 

Top

Related drugs of malignant transformation related genes

check buttonIdentification of chemicals and drugs interact with genes involved in malignant transfromation
(DGIdb 4.0)
Entrez IDSymbolCategoryInteraction TypesDrug Claim NameDrug NamePMIDs
4088SMAD3DRUGGABLE GENOME, KINASE, CLINICALLY ACTIONABLE, TRANSCRIPTION FACTOR COMPLEXGNF-PF-1295CHEMBL579837
4088SMAD3DRUGGABLE GENOME, KINASE, CLINICALLY ACTIONABLE, TRANSCRIPTION FACTOR COMPLEXHELENALINHELENALIN
4088SMAD3DRUGGABLE GENOME, KINASE, CLINICALLY ACTIONABLE, TRANSCRIPTION FACTOR COMPLEXTRICLOCARBANTRICLOCARBAN
4088SMAD3DRUGGABLE GENOME, KINASE, CLINICALLY ACTIONABLE, TRANSCRIPTION FACTOR COMPLEXDNDI1417601CHEMBL1503729
4088SMAD3DRUGGABLE GENOME, KINASE, CLINICALLY ACTIONABLE, TRANSCRIPTION FACTOR COMPLEXCID 663143CHEMBL1342336
4088SMAD3DRUGGABLE GENOME, KINASE, CLINICALLY ACTIONABLE, TRANSCRIPTION FACTOR COMPLEXBISINDOLYLMALEIMIDE IXBISINDOLYLMALEIMIDE IX
4088SMAD3DRUGGABLE GENOME, KINASE, CLINICALLY ACTIONABLE, TRANSCRIPTION FACTOR COMPLEXMITOXANTRONEMITOXANTRONE
4088SMAD3DRUGGABLE GENOME, KINASE, CLINICALLY ACTIONABLE, TRANSCRIPTION FACTOR COMPLEXNSC-724440CHEMBL515617
4088SMAD3DRUGGABLE GENOME, KINASE, CLINICALLY ACTIONABLE, TRANSCRIPTION FACTOR COMPLEXGNF-PF-1134CHEMBL600694
4088SMAD3DRUGGABLE GENOME, KINASE, CLINICALLY ACTIONABLE, TRANSCRIPTION FACTOR COMPLEXAZACITIDINEAZACITIDINE
Page: 1 2 3 4 5 6 7 8 9 10 11 12 13 14 15 16 17 18 19 20 21 22 23