
|
|||||
|
 | |
| |
| |
| |
| |
| |
|
Gene: RCC1 |
Gene summary for RCC1 |
| Gene information | Species | Human | Gene symbol | RCC1 | Gene ID | 1104 |
| Gene name | regulator of chromosome condensation 1 | |
| Gene Alias | CHC1 | |
| Cytomap | 1p35.3 | |
| Gene Type | protein-coding | GO ID | GO:0000082 | UniProtAcc | A0A0S2Z404 |
Top |
Malignant transformation analysis |
| Identification of the aberrant gene expression in precancerous and cancerous lesions by comparing the gene expression of stem-like cells in diseased tissues with normal stem cells |
| Entrez ID | Symbol | Replicates | Species | Organ | Tissue | Adj P-value | Log2FC | Malignancy |
| 1104 | RCC1 | LZE4T | Human | Esophagus | ESCC | 5.76e-04 | 7.72e-02 | 0.0811 |
| 1104 | RCC1 | LZE8T | Human | Esophagus | ESCC | 6.08e-04 | 1.90e-01 | 0.067 |
| 1104 | RCC1 | LZE20T | Human | Esophagus | ESCC | 1.40e-02 | 1.44e-01 | 0.0662 |
| 1104 | RCC1 | LZE22T | Human | Esophagus | ESCC | 4.75e-06 | 6.62e-01 | 0.068 |
| 1104 | RCC1 | LZE24T | Human | Esophagus | ESCC | 1.83e-09 | 3.92e-01 | 0.0596 |
| 1104 | RCC1 | LZE6T | Human | Esophagus | ESCC | 1.28e-02 | 2.94e-01 | 0.0845 |
| 1104 | RCC1 | P1T-E | Human | Esophagus | ESCC | 1.12e-13 | 7.63e-01 | 0.0875 |
| 1104 | RCC1 | P2T-E | Human | Esophagus | ESCC | 1.18e-41 | 1.05e+00 | 0.1177 |
| 1104 | RCC1 | P4T-E | Human | Esophagus | ESCC | 1.32e-40 | 1.10e+00 | 0.1323 |
| 1104 | RCC1 | P5T-E | Human | Esophagus | ESCC | 4.84e-37 | 8.63e-01 | 0.1327 |
| 1104 | RCC1 | P8T-E | Human | Esophagus | ESCC | 8.89e-41 | 9.26e-01 | 0.0889 |
| 1104 | RCC1 | P9T-E | Human | Esophagus | ESCC | 1.81e-31 | 8.80e-01 | 0.1131 |
| 1104 | RCC1 | P10T-E | Human | Esophagus | ESCC | 3.16e-62 | 1.23e+00 | 0.116 |
| 1104 | RCC1 | P11T-E | Human | Esophagus | ESCC | 2.47e-13 | 7.90e-01 | 0.1426 |
| 1104 | RCC1 | P12T-E | Human | Esophagus | ESCC | 9.73e-37 | 8.13e-01 | 0.1122 |
| 1104 | RCC1 | P15T-E | Human | Esophagus | ESCC | 1.10e-32 | 7.94e-01 | 0.1149 |
| 1104 | RCC1 | P16T-E | Human | Esophagus | ESCC | 3.81e-18 | 4.84e-01 | 0.1153 |
| 1104 | RCC1 | P17T-E | Human | Esophagus | ESCC | 2.92e-15 | 7.90e-01 | 0.1278 |
| 1104 | RCC1 | P19T-E | Human | Esophagus | ESCC | 4.29e-07 | 1.00e+00 | 0.1662 |
| 1104 | RCC1 | P20T-E | Human | Esophagus | ESCC | 1.58e-41 | 1.19e+00 | 0.1124 |
| Page: 1 2 3 4 5 |
| Tissue | Expression Dynamics | Abbreviation |
| Esophagus |  | ESCC: Esophageal squamous cell carcinoma |
| HGIN: High-grade intraepithelial neoplasias | ||
| LGIN: Low-grade intraepithelial neoplasias | ||
| Liver | 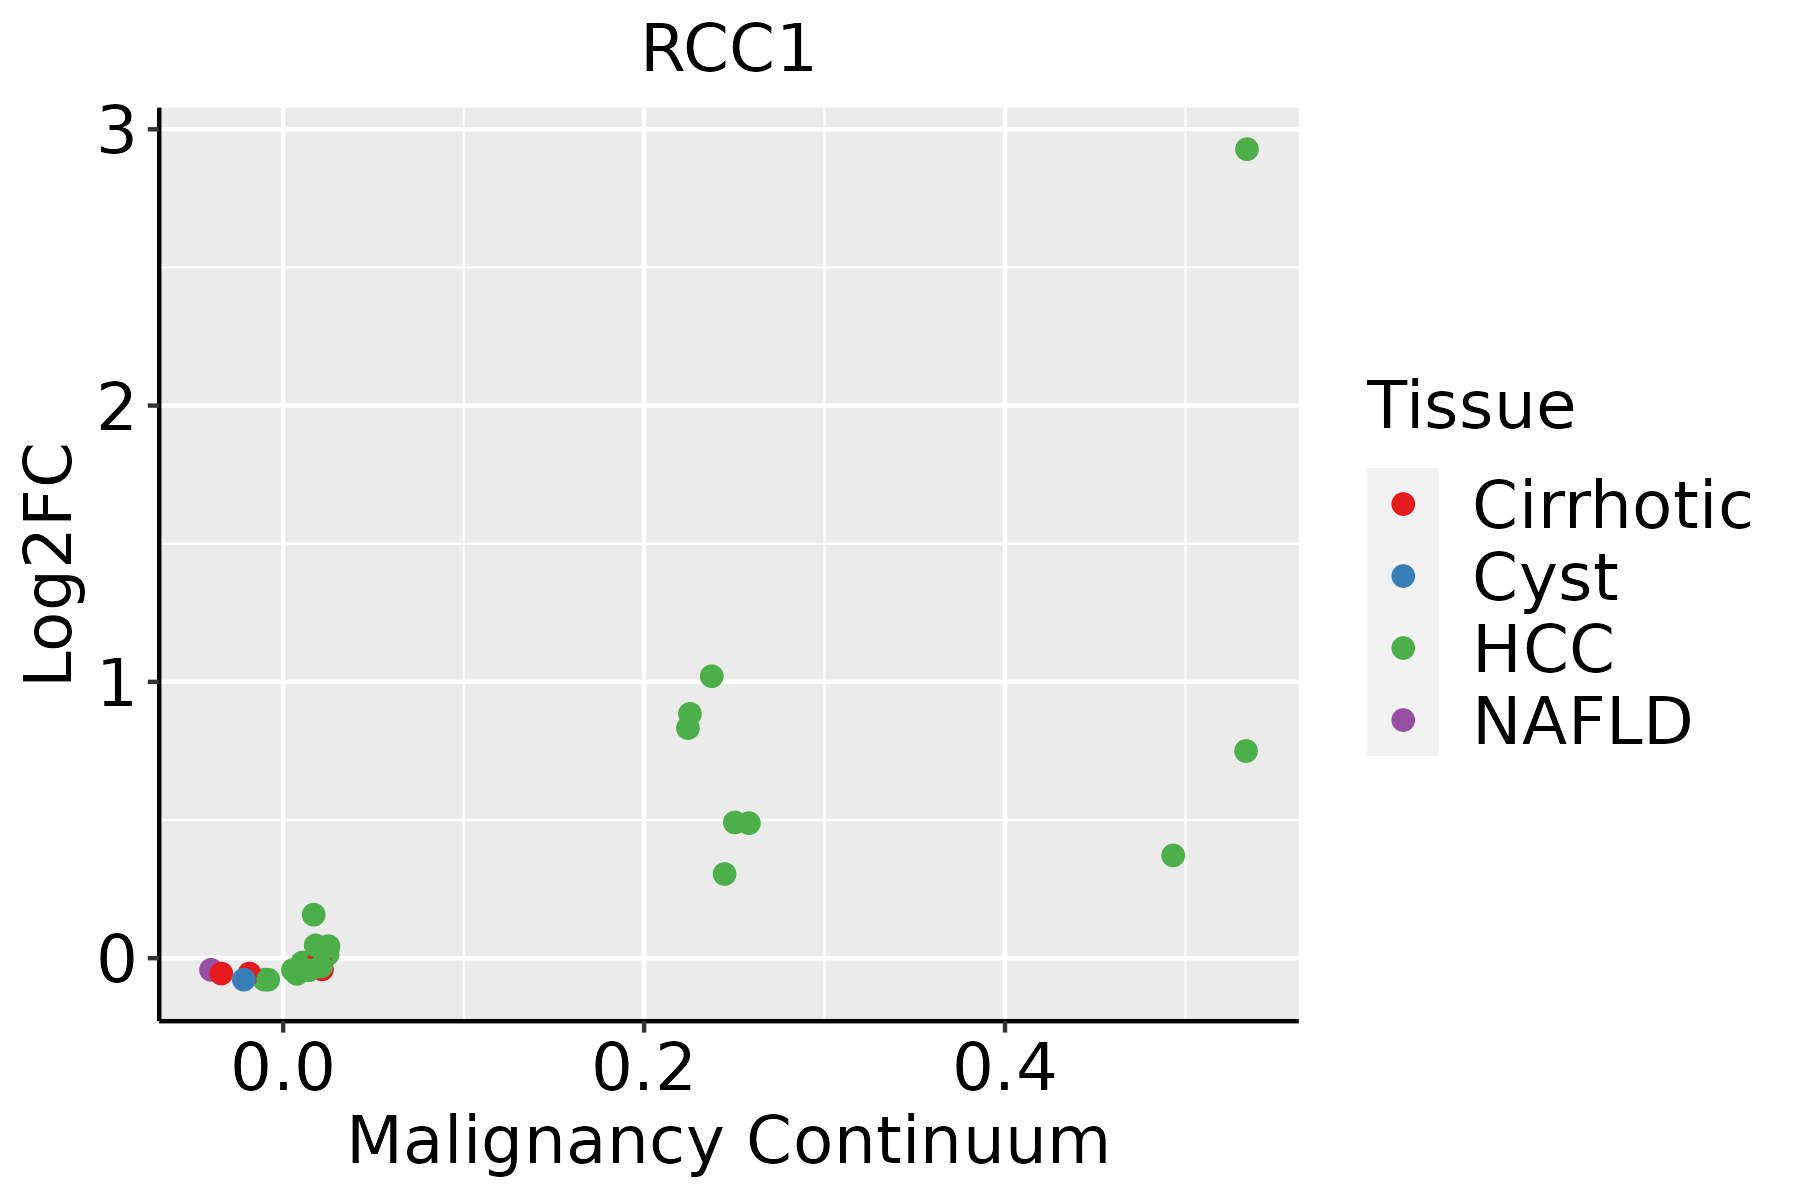 | HCC: Hepatocellular carcinoma |
| NAFLD: Non-alcoholic fatty liver disease | ||
| Oral Cavity | 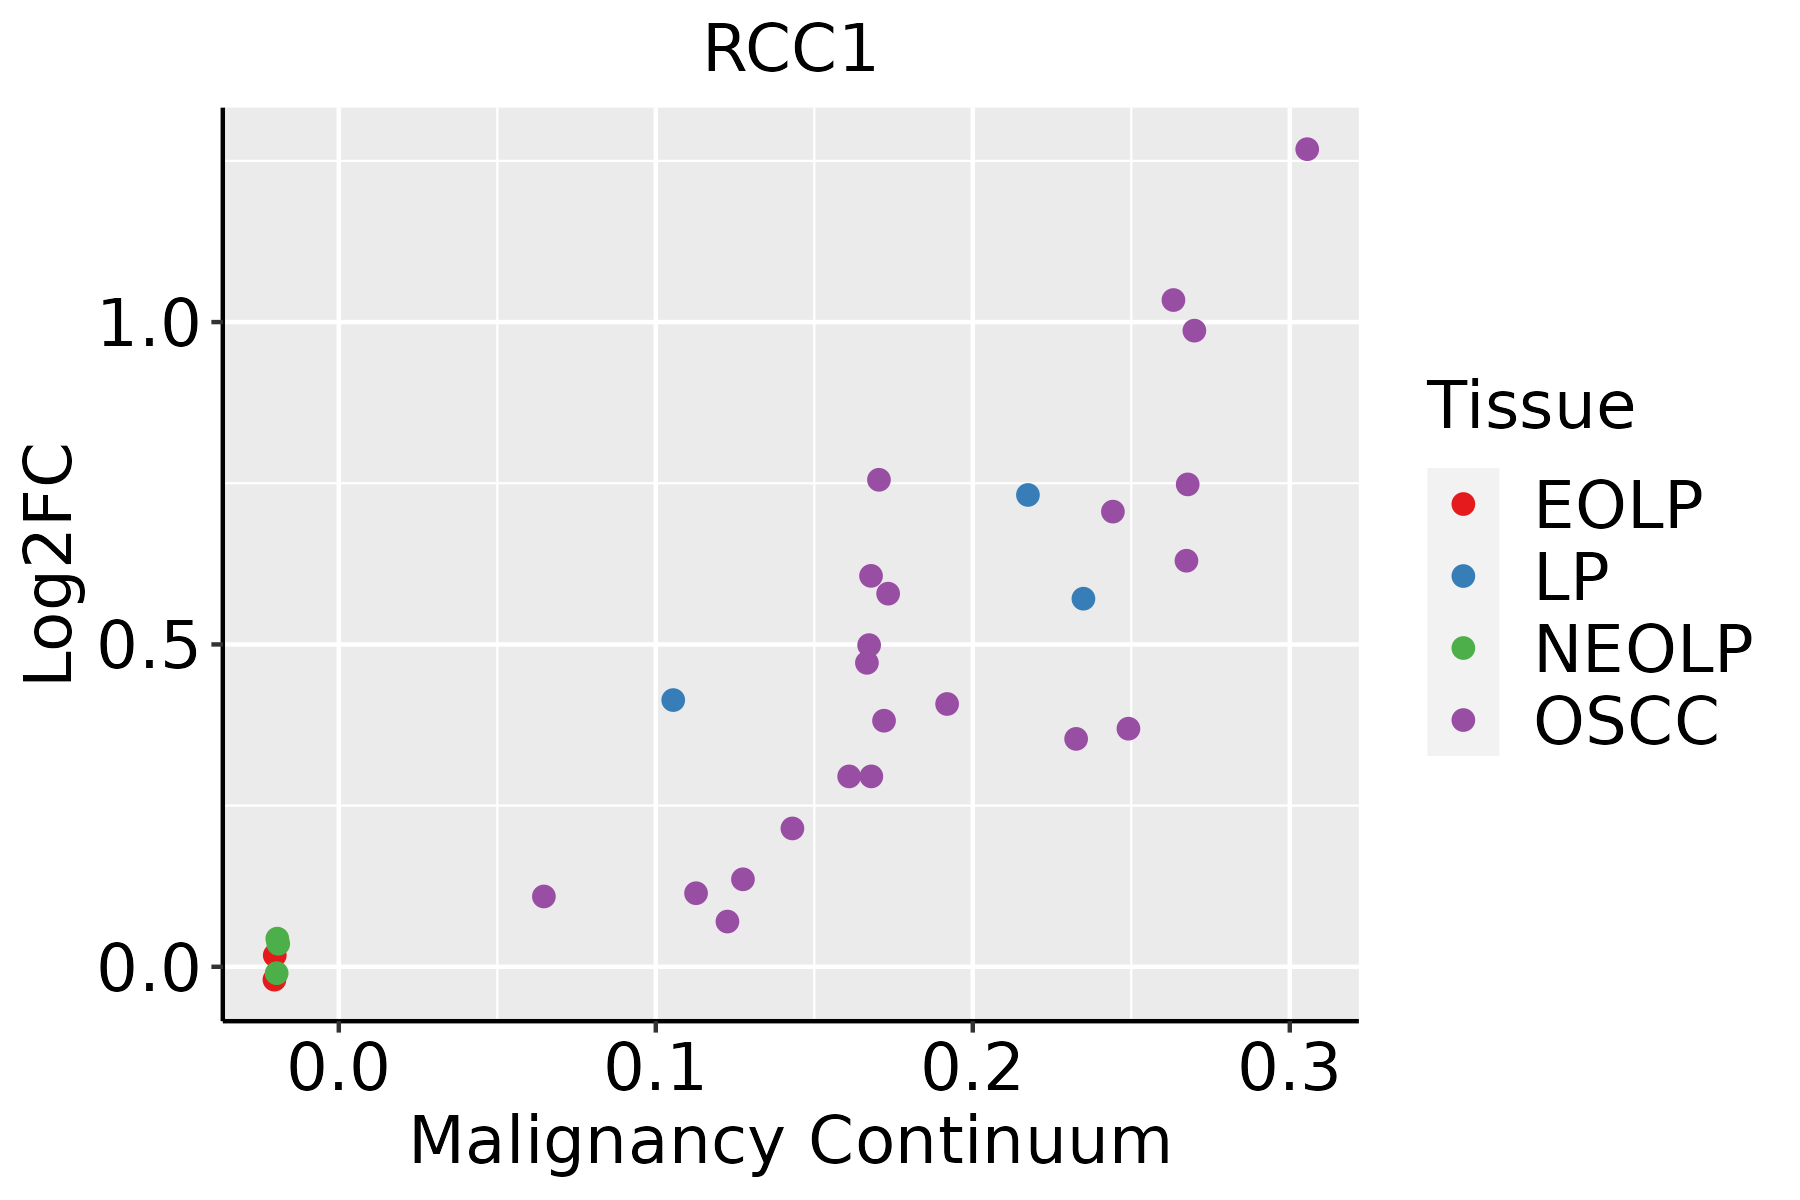 | EOLP: Erosive Oral lichen planus |
| LP: leukoplakia | ||
| NEOLP: Non-erosive oral lichen planus | ||
| OSCC: Oral squamous cell carcinoma | ||
| Skin |  | AK: Actinic keratosis |
| cSCC: Cutaneous squamous cell carcinoma | ||
| SCCIS:squamous cell carcinoma in situ |
| ∗log2FC in expression of this searched gene in stem-like cells from each diseased tissue sample relative to stem-like cells in normal samples in each tissue plotted against the malignancy continuum. Samples are colored based on if they are from different disease stage. |
Top |
Malignant transformation related pathway analysis |
| Find out the enriched GO biological processes and KEGG pathways involved in transition from healthy to precancer to cancer |
| Tissue | Disease Stage | Enriched GO biological Processes |
| Colorectum | AD |  |
| Colorectum | SER |  |
| Colorectum | MSS |  |
| Colorectum | MSI-H |  |
| Colorectum | FAP |  |
| ∗Top 15 enriched GO BP terms are showed in the bar plot of each disease state in each tissue. Each row represents a significant GO biological process which is colored according to the -log10(p.adjust). |
| Page: 1 2 3 4 5 6 7 8 9 |
| GO ID | Tissue | Disease Stage | Description | Gene Ratio | Bg Ratio | pvalue | p.adjust | Count |
| GO:0006417113 | Thyroid | PTC | regulation of translation | 236/5968 | 468/18723 | 2.70e-17 | 2.52e-15 | 236 |
| GO:0034250113 | Thyroid | PTC | positive regulation of cellular amide metabolic process | 98/5968 | 162/18723 | 5.26e-14 | 3.04e-12 | 98 |
| GO:0045727113 | Thyroid | PTC | positive regulation of translation | 84/5968 | 136/18723 | 6.52e-13 | 3.08e-11 | 84 |
| GO:003304419 | Thyroid | PTC | regulation of chromosome organization | 102/5968 | 187/18723 | 1.04e-10 | 3.58e-09 | 102 |
| GO:0070482113 | Thyroid | PTC | response to oxygen levels | 167/5968 | 347/18723 | 1.51e-10 | 5.03e-09 | 167 |
| GO:005105218 | Thyroid | PTC | regulation of DNA metabolic process | 171/5968 | 359/18723 | 2.52e-10 | 8.33e-09 | 171 |
| GO:0031330113 | Thyroid | PTC | negative regulation of cellular catabolic process | 131/5968 | 262/18723 | 6.63e-10 | 2.03e-08 | 131 |
| GO:0009895113 | Thyroid | PTC | negative regulation of catabolic process | 154/5968 | 320/18723 | 7.77e-10 | 2.31e-08 | 154 |
| GO:2001020112 | Thyroid | PTC | regulation of response to DNA damage stimulus | 113/5968 | 219/18723 | 9.37e-10 | 2.77e-08 | 113 |
| GO:1901653111 | Thyroid | PTC | cellular response to peptide | 169/5968 | 359/18723 | 9.81e-10 | 2.89e-08 | 169 |
| GO:0071214111 | Thyroid | PTC | cellular response to abiotic stimulus | 158/5968 | 331/18723 | 9.90e-10 | 2.89e-08 | 158 |
| GO:0104004111 | Thyroid | PTC | cellular response to environmental stimulus | 158/5968 | 331/18723 | 9.90e-10 | 2.89e-08 | 158 |
| GO:0032204110 | Thyroid | PTC | regulation of telomere maintenance | 52/5968 | 80/18723 | 1.15e-09 | 3.34e-08 | 52 |
| GO:0032984110 | Thyroid | PTC | protein-containing complex disassembly | 114/5968 | 224/18723 | 2.26e-09 | 6.33e-08 | 114 |
| GO:000700624 | Thyroid | PTC | mitochondrial membrane organization | 68/5968 | 116/18723 | 2.47e-09 | 6.88e-08 | 68 |
| GO:0036293113 | Thyroid | PTC | response to decreased oxygen levels | 153/5968 | 322/18723 | 2.71e-09 | 7.52e-08 | 153 |
| GO:0010639112 | Thyroid | PTC | negative regulation of organelle organization | 163/5968 | 348/18723 | 3.04e-09 | 8.39e-08 | 163 |
| GO:0043434113 | Thyroid | PTC | response to peptide hormone | 188/5968 | 414/18723 | 4.13e-09 | 1.09e-07 | 188 |
| GO:0000723111 | Thyroid | PTC | telomere maintenance | 74/5968 | 131/18723 | 4.85e-09 | 1.26e-07 | 74 |
| GO:0001666113 | Thyroid | PTC | response to hypoxia | 145/5968 | 307/18723 | 1.14e-08 | 2.74e-07 | 145 |
| Page: 1 2 3 4 5 6 7 8 9 10 11 12 13 14 15 16 17 18 19 20 21 22 23 24 25 26 27 28 29 30 31 32 33 34 35 36 37 38 39 40 41 42 43 44 45 46 47 48 49 50 51 52 53 54 55 56 57 58 59 60 61 62 63 64 65 66 67 68 69 70 71 72 73 74 |
| Pathway ID | Tissue | Disease Stage | Description | Gene Ratio | Bg Ratio | pvalue | p.adjust | qvalue | Count |
| Page: 1 |
Top |
Cell-cell communication analysis |
| Identification of potential cell-cell interactions between two cell types and their ligand-receptor pairs for different disease states |
| Ligand | Receptor | LRpair | Pathway | Tissue | Disease Stage |
| Page: 1 |
Top |
Single-cell gene regulatory network inference analysis |
| Find out the significant the regulons (TFs) and the target genes of each regulon across cell types for different disease states |
| TF | Cell Type | Tissue | Disease Stage | Target Gene | RSS | Regulon Activity |
| ∗The dot plots of a searched regulon are shown for all cell subpopulations in each disease state of each tissue based on the regulon specific score inferred using pySCENIC and by calculating the average expression. |
| Page: 1 |
Top |
Somatic mutation of malignant transformation related genes |
| Annotation of somatic variants for genes involved in malignant transformation |
| Hugo Symbol | Variant Class | Variant Classification | dbSNP RS | HGVSc | HGVSp | HGVSp Short | SWISSPROT | BIOTYPE | SIFT | PolyPhen | Tumor Sample Barcode | Tissue | Histology | Sex | Age | Stage | Therapy Types | Drugs | Outcome |
| RCC1 | insertion | Frame_Shift_Ins | novel | c.781_782insTACTC | p.Met261IlefsTer4 | p.M261Ifs*4 | P18754 | protein_coding | TCGA-AO-A0JD-01 | Breast | breast invasive carcinoma | Female | <65 | III/IV | Chemotherapy | cyclophosphamide | SD | ||
| RCC1 | insertion | Frame_Shift_Ins | novel | c.783_784insAACATAGTTTCTTCATCACTAAGTCTACCTAC | p.Leu262AsnfsTer12 | p.L262Nfs*12 | P18754 | protein_coding | TCGA-AO-A0JD-01 | Breast | breast invasive carcinoma | Female | <65 | III/IV | Chemotherapy | cyclophosphamide | SD | ||
| RCC1 | SNV | Missense_Mutation | novel | c.98N>A | p.Arg33His | p.R33H | P18754 | protein_coding | tolerated(0.24) | benign(0.182) | TCGA-A6-3809-01 | Colorectum | colon adenocarcinoma | Female | >=65 | I/II | Unknown | Unknown | SD |
| RCC1 | SNV | Missense_Mutation | c.1051N>T | p.Arg351Trp | p.R351W | P18754 | protein_coding | deleterious(0.02) | probably_damaging(0.997) | TCGA-AA-3715-01 | Colorectum | colon adenocarcinoma | Male | >=65 | I/II | Unknown | Unknown | PD | |
| RCC1 | SNV | Missense_Mutation | rs528320406 | c.743G>A | p.Arg248Gln | p.R248Q | P18754 | protein_coding | deleterious(0) | possibly_damaging(0.607) | TCGA-AA-3864-01 | Colorectum | colon adenocarcinoma | Male | >=65 | I/II | Unknown | Unknown | SD |
| RCC1 | SNV | Missense_Mutation | rs760969624 | c.1186C>T | p.Arg396Cys | p.R396C | P18754 | protein_coding | tolerated(0.12) | benign(0.025) | TCGA-G4-6309-01 | Colorectum | colon adenocarcinoma | Female | <65 | III/IV | Chemotherapy | xeloda | PD |
| RCC1 | SNV | Missense_Mutation | rs745611564 | c.1025C>T | p.Ser342Leu | p.S342L | P18754 | protein_coding | deleterious(0.05) | benign(0.147) | TCGA-AG-A002-01 | Colorectum | rectum adenocarcinoma | Male | <65 | I/II | Unknown | Unknown | SD |
| RCC1 | deletion | Frame_Shift_Del | c.32delN | p.Pro13GlnfsTer11 | p.P13Qfs*11 | P18754 | protein_coding | TCGA-AA-3492-01 | Colorectum | colon adenocarcinoma | Female | >=65 | I/II | Unknown | Unknown | SD | |||
| RCC1 | deletion | Frame_Shift_Del | c.32delN | p.Pro13GlnfsTer11 | p.P13Qfs*11 | P18754 | protein_coding | TCGA-AA-3663-01 | Colorectum | colon adenocarcinoma | Male | <65 | I/II | Unknown | Unknown | SD | |||
| RCC1 | deletion | Frame_Shift_Del | c.38delC | p.Pro13GlnfsTer11 | p.P13Qfs*11 | P18754 | protein_coding | TCGA-AA-3710-01 | Colorectum | colon adenocarcinoma | Female | >=65 | I/II | Unknown | Unknown | SD |
| Page: 1 2 3 4 5 |
Top |
Related drugs of malignant transformation related genes |
| Identification of chemicals and drugs interact with genes involved in malignant transfromation |
| (DGIdb 4.0) |
| Entrez ID | Symbol | Category | Interaction Types | Drug Claim Name | Drug Name | PMIDs |
| Page: 1 |

Copyright 2023-Present -The University of Texas Health Science Center at Houston |