
|
|||||
|
 | |
| |
| |
| |
| |
| |
|
Gene: MAPK1 |
Gene summary for MAPK1 |
| Gene information | Species | Human | Gene symbol | MAPK1 | Gene ID | 5594 |
| Gene name | mitogen-activated protein kinase 1 | |
| Gene Alias | ERK | |
| Cytomap | 22q11.22 | |
| Gene Type | protein-coding | GO ID | GO:0000003 | UniProtAcc | P28482 |
Top |
Malignant transformation analysis |
| Identification of the aberrant gene expression in precancerous and cancerous lesions by comparing the gene expression of stem-like cells in diseased tissues with normal stem cells |
| Entrez ID | Symbol | Replicates | Species | Organ | Tissue | Adj P-value | Log2FC | Malignancy |
| 5594 | MAPK1 | LZE4T | Human | Esophagus | ESCC | 1.53e-08 | -1.67e-02 | 0.0811 |
| 5594 | MAPK1 | LZE7T | Human | Esophagus | ESCC | 2.01e-04 | 1.25e-01 | 0.0667 |
| 5594 | MAPK1 | LZE8T | Human | Esophagus | ESCC | 7.17e-05 | -5.36e-02 | 0.067 |
| 5594 | MAPK1 | LZE24T | Human | Esophagus | ESCC | 3.35e-12 | 2.52e-01 | 0.0596 |
| 5594 | MAPK1 | LZE21T | Human | Esophagus | ESCC | 4.39e-06 | 1.56e-01 | 0.0655 |
| 5594 | MAPK1 | P1T-E | Human | Esophagus | ESCC | 3.69e-07 | 1.56e-01 | 0.0875 |
| 5594 | MAPK1 | P2T-E | Human | Esophagus | ESCC | 3.35e-28 | 3.53e-01 | 0.1177 |
| 5594 | MAPK1 | P4T-E | Human | Esophagus | ESCC | 3.45e-33 | 7.06e-01 | 0.1323 |
| 5594 | MAPK1 | P5T-E | Human | Esophagus | ESCC | 3.03e-12 | 1.44e-01 | 0.1327 |
| 5594 | MAPK1 | P8T-E | Human | Esophagus | ESCC | 1.10e-20 | 3.12e-01 | 0.0889 |
| 5594 | MAPK1 | P9T-E | Human | Esophagus | ESCC | 3.75e-14 | 2.21e-01 | 0.1131 |
| 5594 | MAPK1 | P10T-E | Human | Esophagus | ESCC | 6.05e-27 | 4.18e-01 | 0.116 |
| 5594 | MAPK1 | P11T-E | Human | Esophagus | ESCC | 4.98e-20 | 4.32e-01 | 0.1426 |
| 5594 | MAPK1 | P12T-E | Human | Esophagus | ESCC | 1.14e-20 | 4.10e-01 | 0.1122 |
| 5594 | MAPK1 | P15T-E | Human | Esophagus | ESCC | 4.67e-15 | 2.76e-01 | 0.1149 |
| 5594 | MAPK1 | P16T-E | Human | Esophagus | ESCC | 4.99e-17 | 2.27e-01 | 0.1153 |
| 5594 | MAPK1 | P17T-E | Human | Esophagus | ESCC | 3.77e-11 | 3.38e-01 | 0.1278 |
| 5594 | MAPK1 | P19T-E | Human | Esophagus | ESCC | 1.24e-10 | 3.63e-01 | 0.1662 |
| 5594 | MAPK1 | P20T-E | Human | Esophagus | ESCC | 2.18e-18 | 6.41e-02 | 0.1124 |
| 5594 | MAPK1 | P21T-E | Human | Esophagus | ESCC | 5.32e-17 | 1.57e-01 | 0.1617 |
| Page: 1 2 3 4 5 6 7 |
| Tissue | Expression Dynamics | Abbreviation |
| Esophagus | 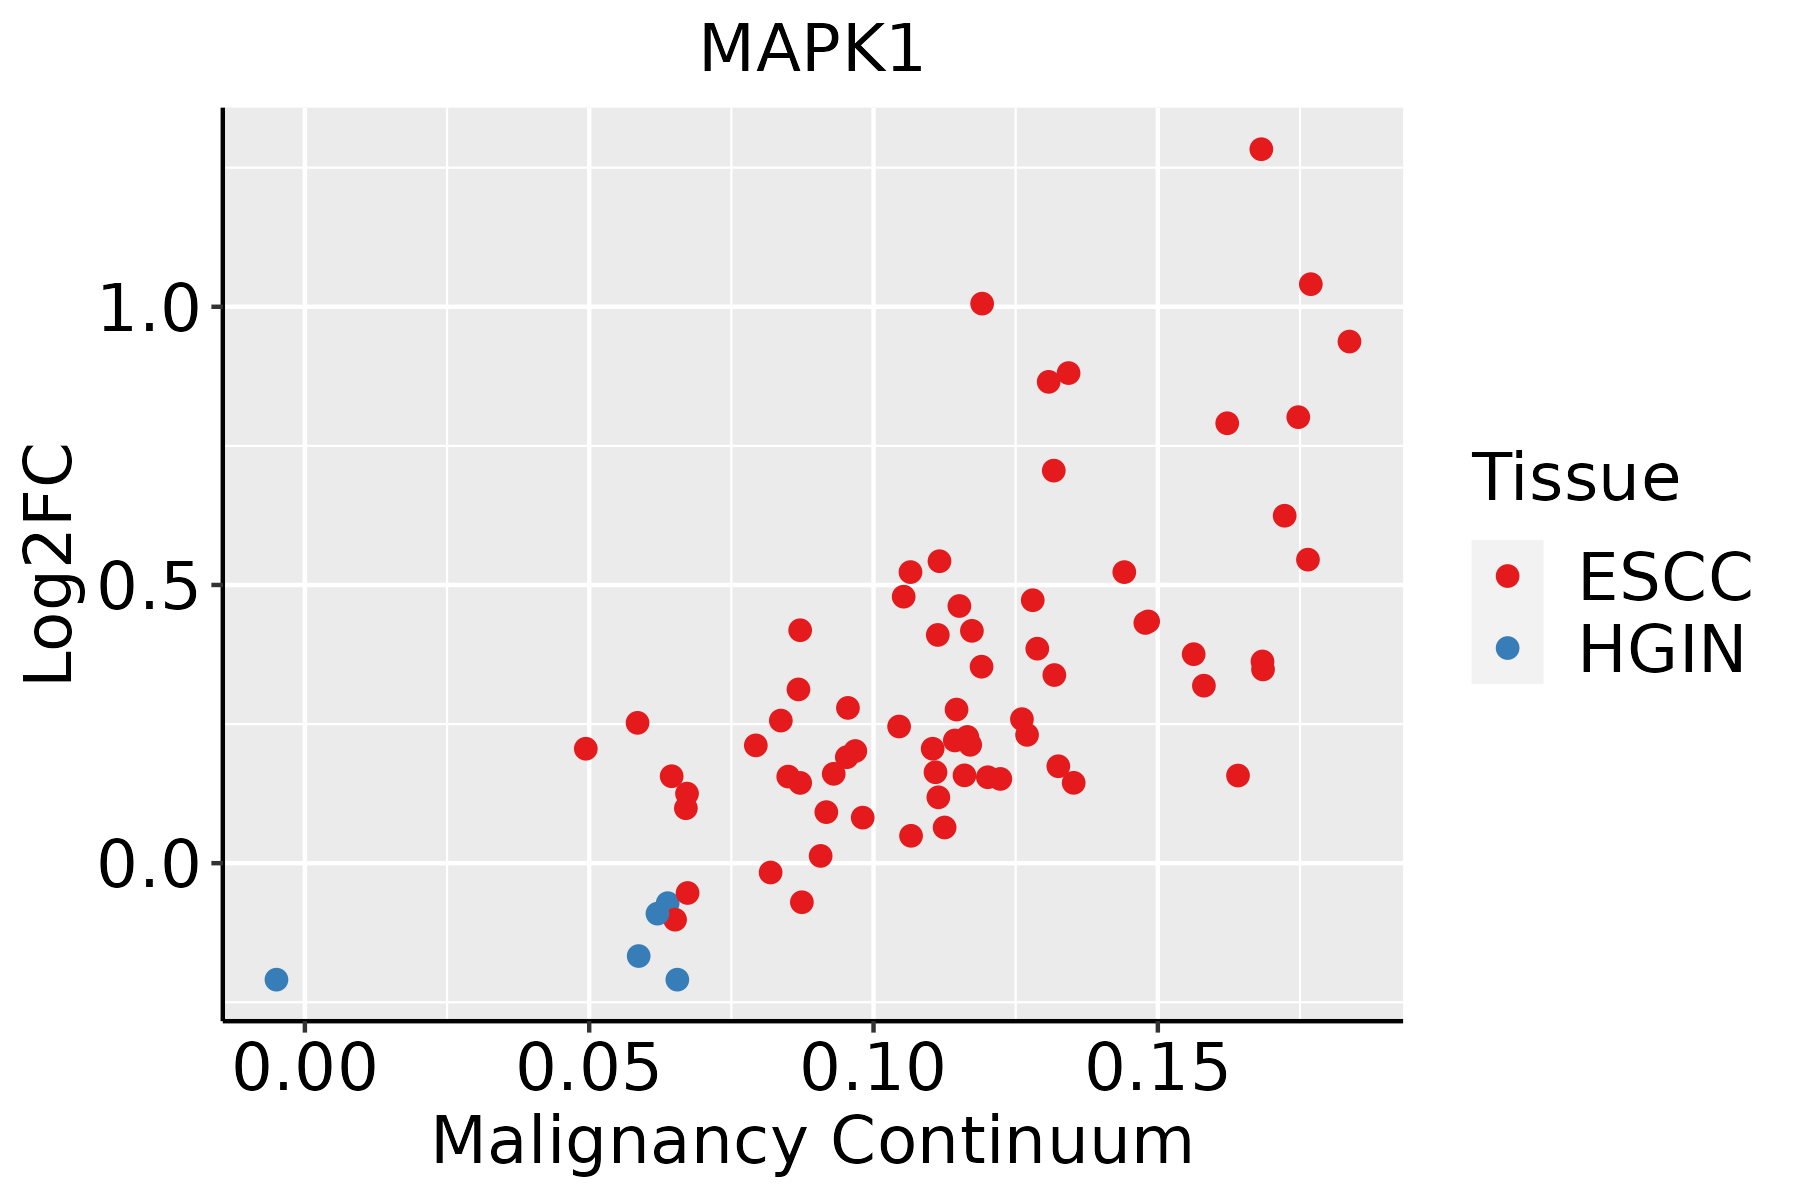 | ESCC: Esophageal squamous cell carcinoma |
| HGIN: High-grade intraepithelial neoplasias | ||
| LGIN: Low-grade intraepithelial neoplasias | ||
| Liver | 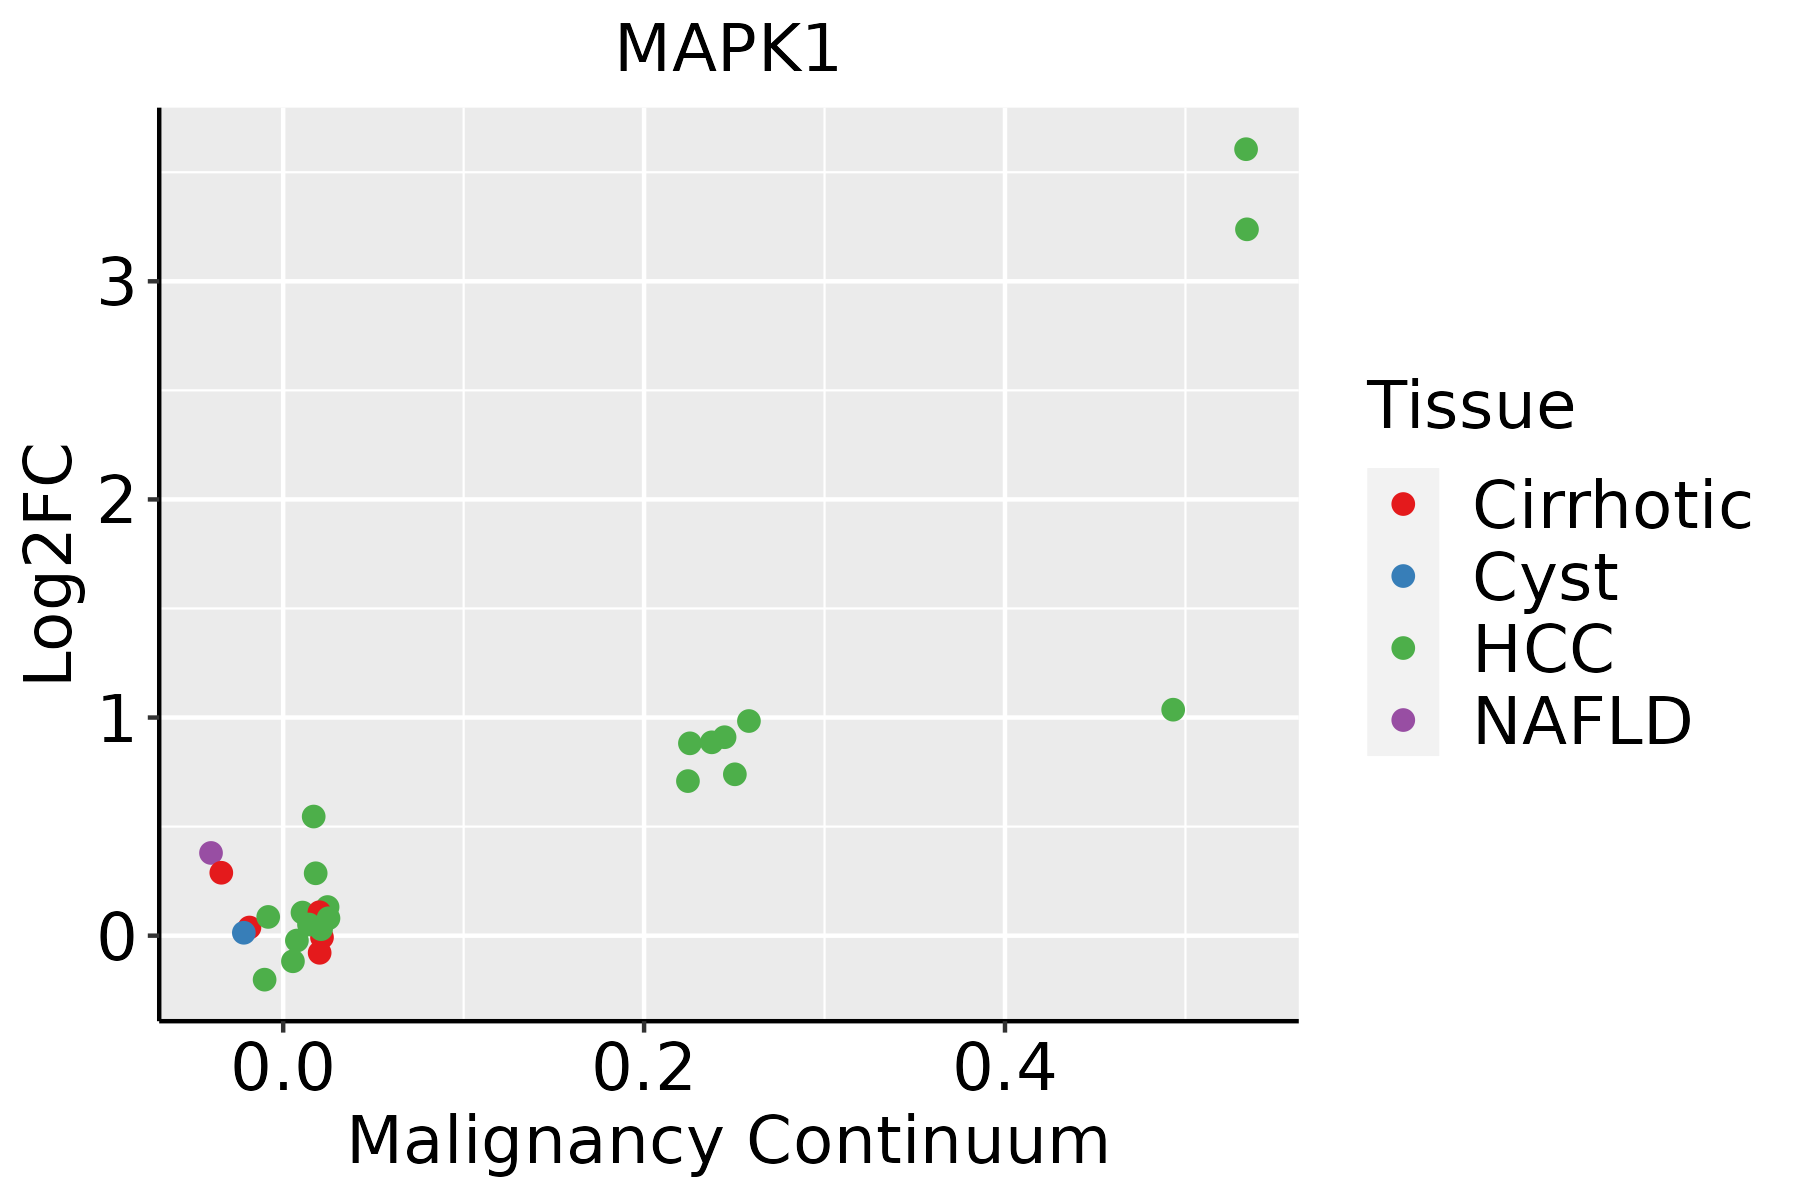 | HCC: Hepatocellular carcinoma |
| NAFLD: Non-alcoholic fatty liver disease | ||
| Oral Cavity |  | EOLP: Erosive Oral lichen planus |
| LP: leukoplakia | ||
| NEOLP: Non-erosive oral lichen planus | ||
| OSCC: Oral squamous cell carcinoma | ||
| Prostate | 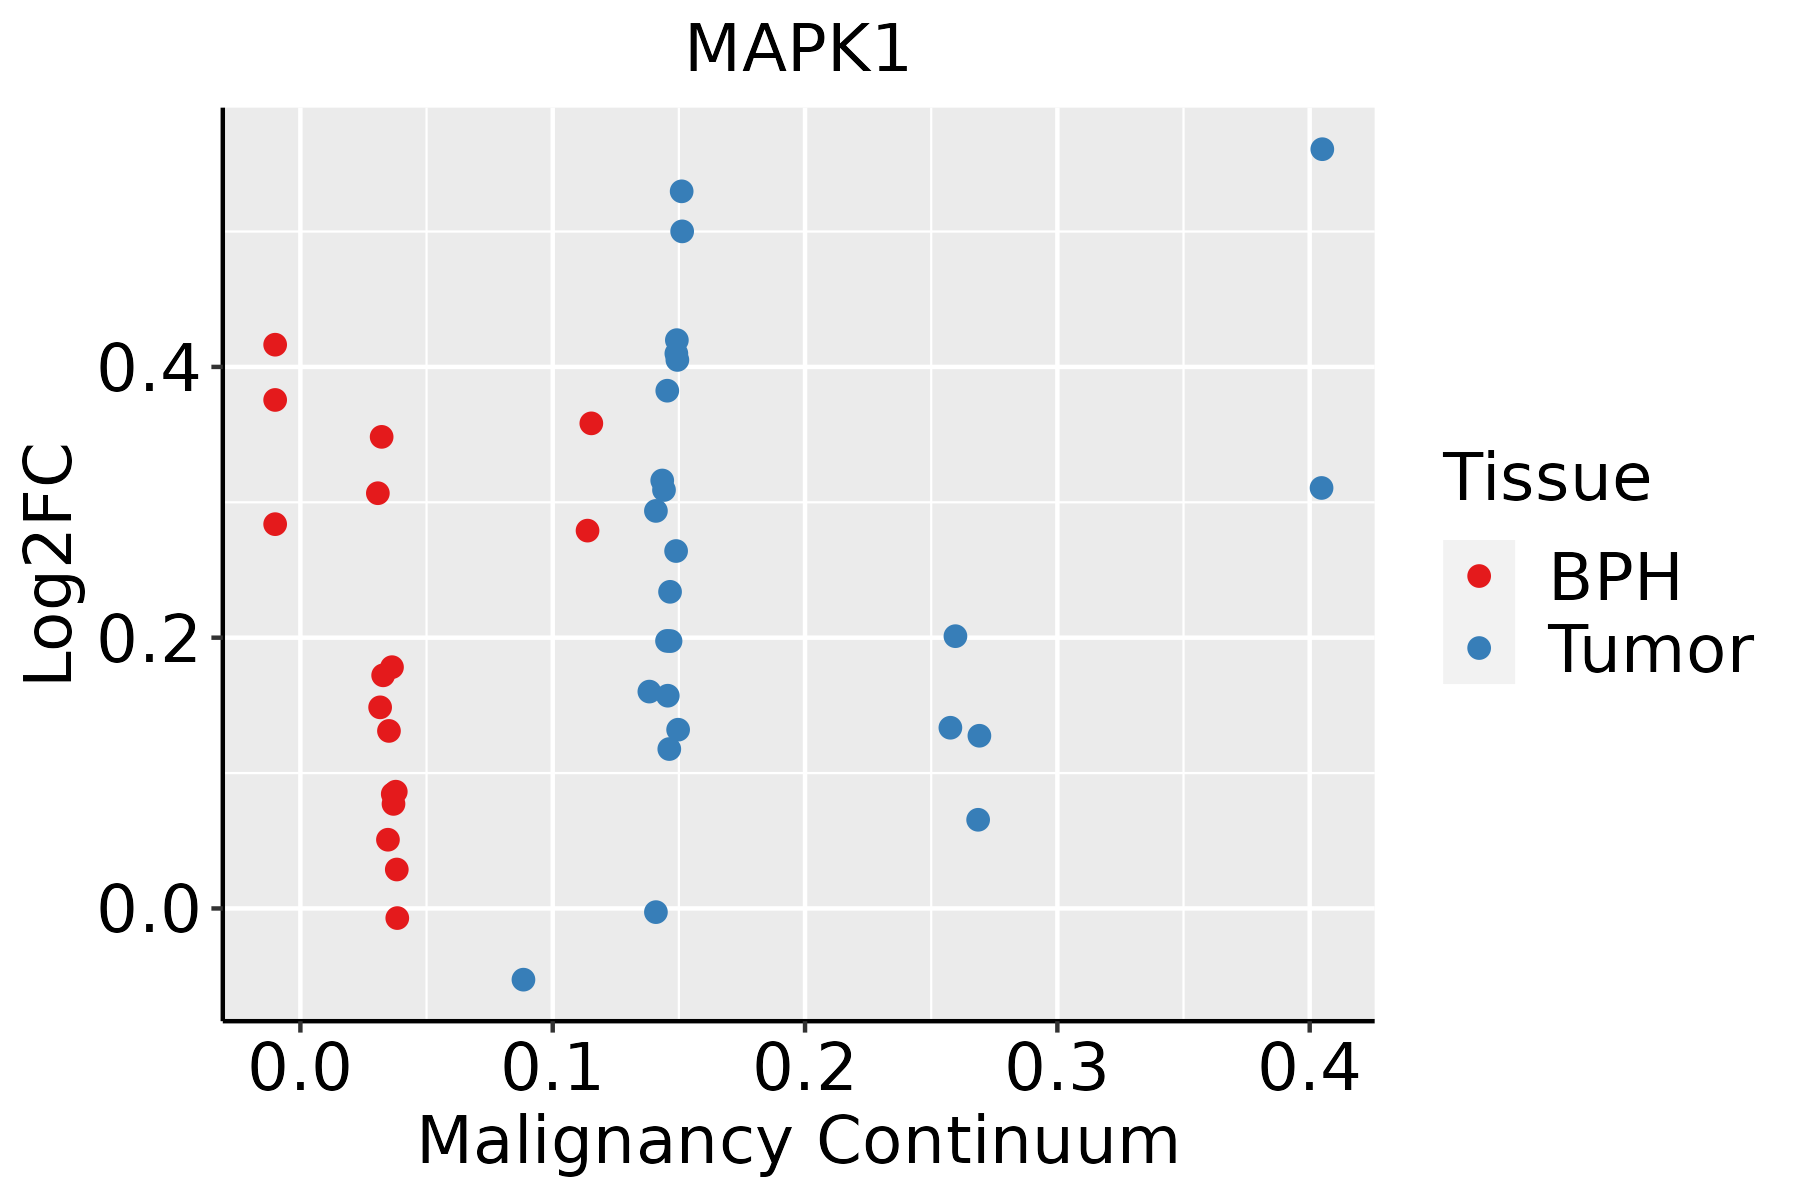 | BPH: Benign Prostatic Hyperplasia |
| Skin | 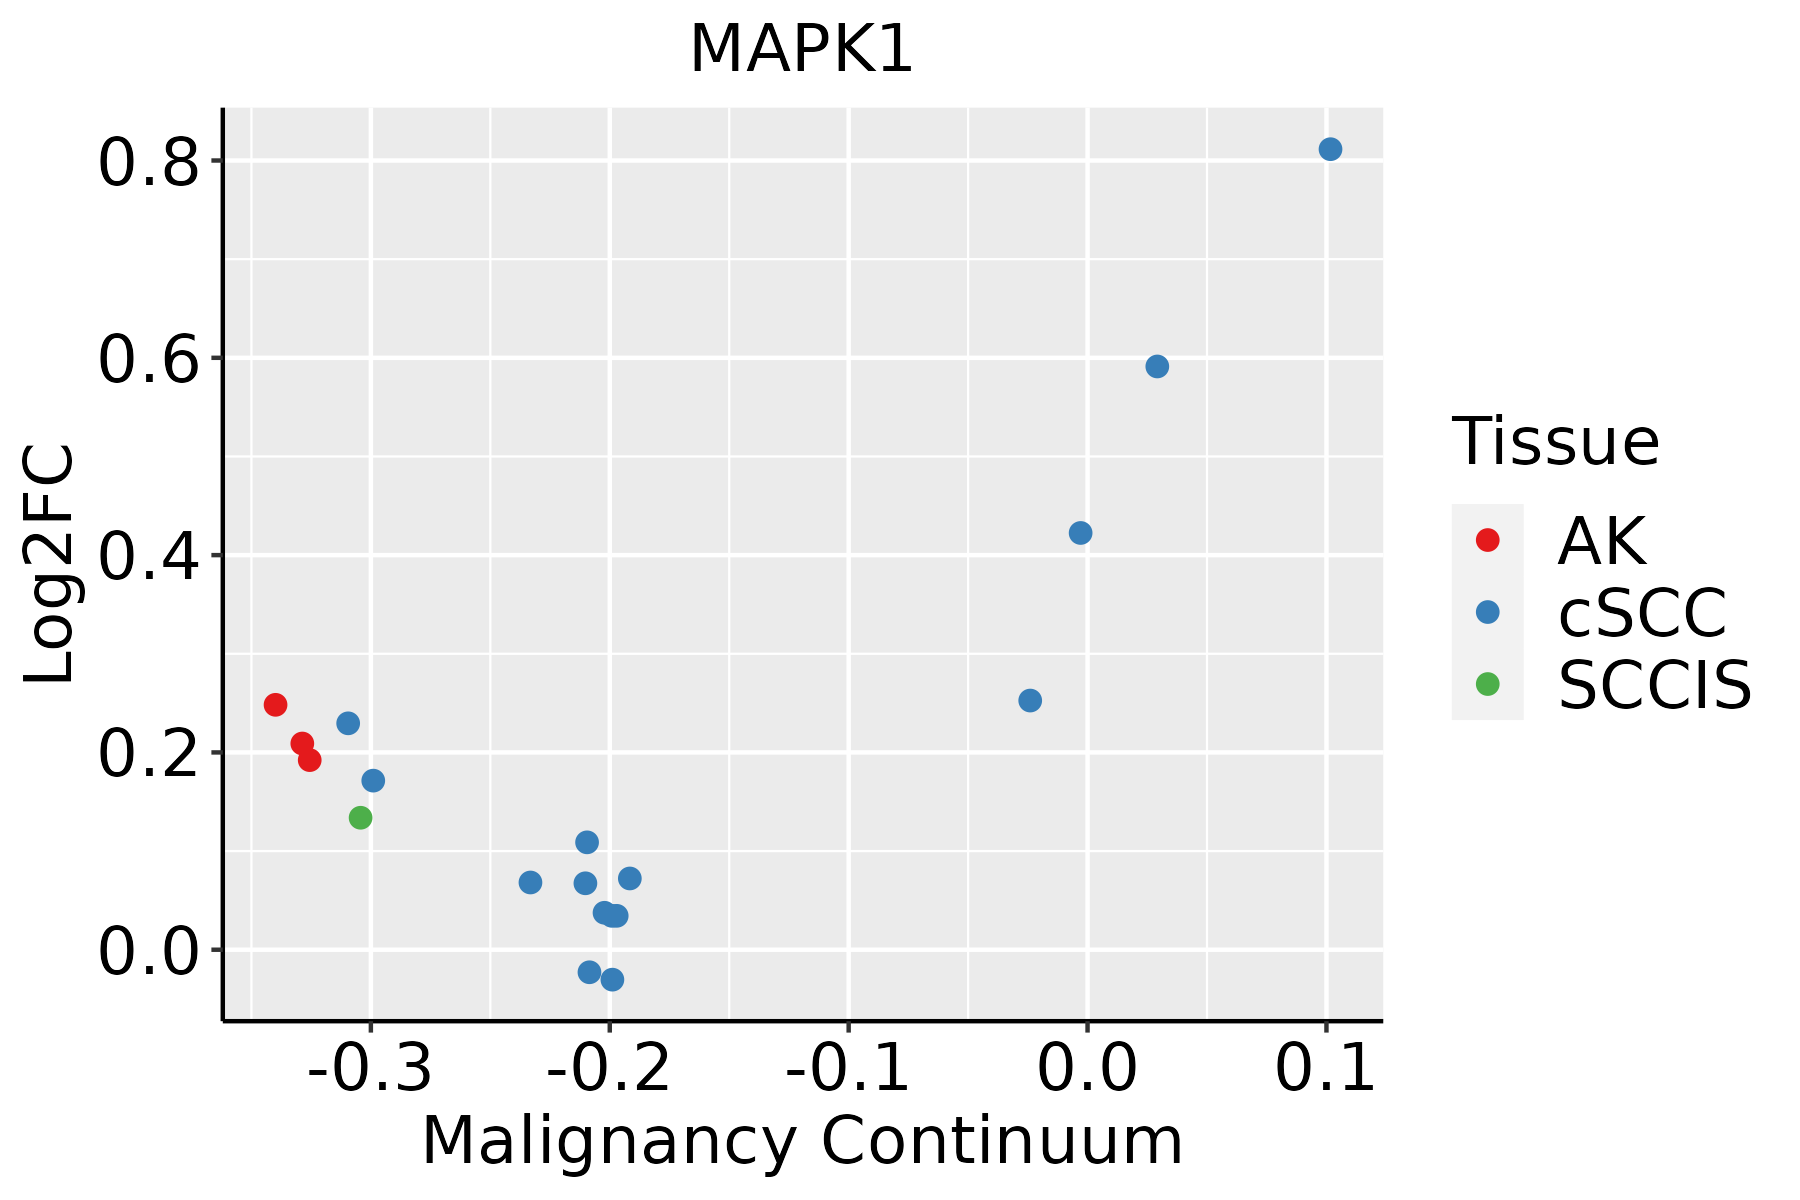 | AK: Actinic keratosis |
| cSCC: Cutaneous squamous cell carcinoma | ||
| SCCIS:squamous cell carcinoma in situ | ||
| Thyroid | 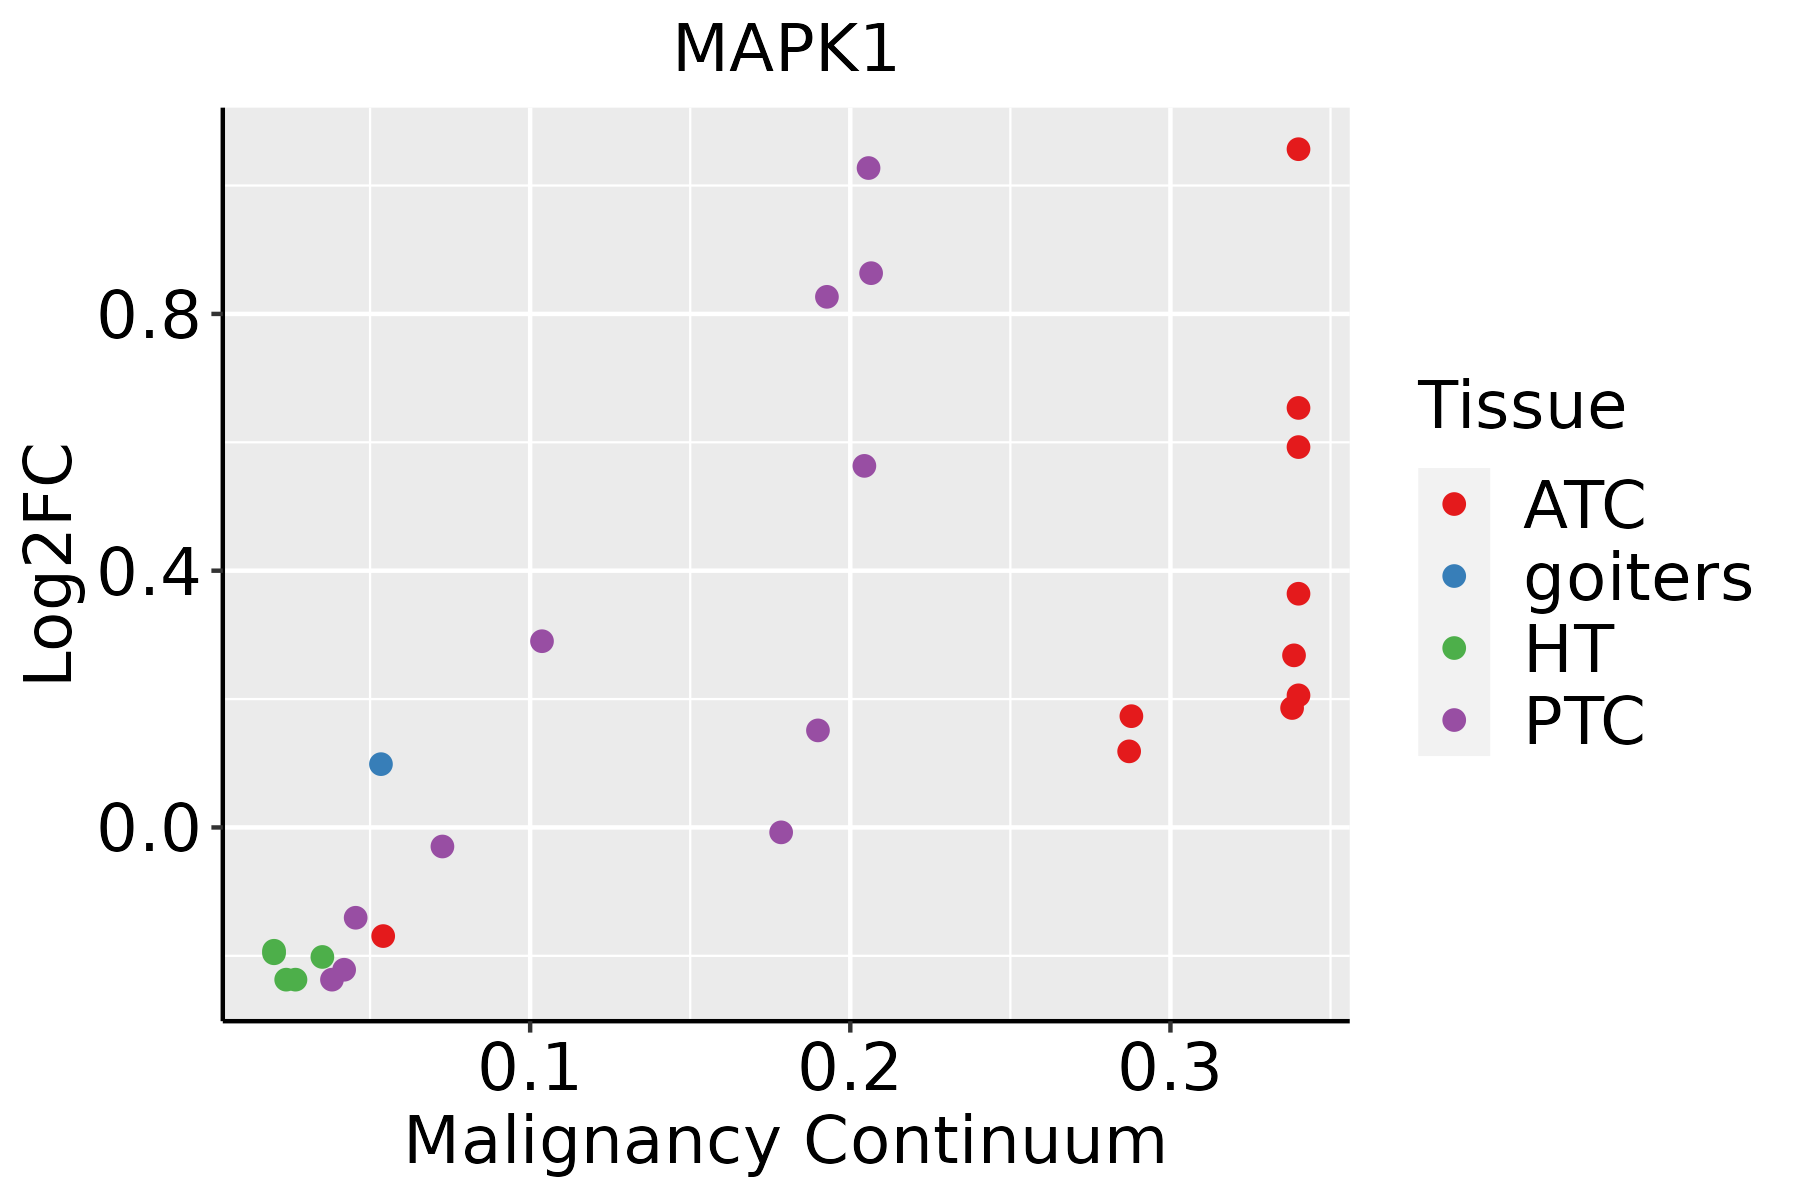 | ATC: Anaplastic thyroid cancer |
| HT: Hashimoto's thyroiditis | ||
| PTC: Papillary thyroid cancer |
| ∗log2FC in expression of this searched gene in stem-like cells from each diseased tissue sample relative to stem-like cells in normal samples in each tissue plotted against the malignancy continuum. Samples are colored based on if they are from different disease stage. |
Top |
Malignant transformation related pathway analysis |
| Find out the enriched GO biological processes and KEGG pathways involved in transition from healthy to precancer to cancer |
| Tissue | Disease Stage | Enriched GO biological Processes |
| Colorectum | AD |  |
| Colorectum | SER |  |
| Colorectum | MSS |  |
| Colorectum | MSI-H |  |
| Colorectum | FAP |  |
| ∗Top 15 enriched GO BP terms are showed in the bar plot of each disease state in each tissue. Each row represents a significant GO biological process which is colored according to the -log10(p.adjust). |
| Page: 1 2 3 4 5 6 7 8 9 |
| GO ID | Tissue | Disease Stage | Description | Gene Ratio | Bg Ratio | pvalue | p.adjust | Count |
| GO:0000302110 | Oral cavity | LP | response to reactive oxygen species | 95/4623 | 222/18723 | 2.23e-09 | 9.98e-08 | 95 |
| GO:190136116 | Oral cavity | LP | organic cyclic compound catabolic process | 180/4623 | 495/18723 | 3.11e-09 | 1.35e-07 | 180 |
| GO:0031330110 | Oral cavity | LP | negative regulation of cellular catabolic process | 107/4623 | 262/18723 | 5.25e-09 | 2.16e-07 | 107 |
| GO:000640219 | Oral cavity | LP | mRNA catabolic process | 97/4623 | 232/18723 | 6.51e-09 | 2.65e-07 | 97 |
| GO:0042542110 | Oral cavity | LP | response to hydrogen peroxide | 68/4623 | 146/18723 | 6.95e-09 | 2.81e-07 | 68 |
| GO:0062197110 | Oral cavity | LP | cellular response to chemical stress | 130/4623 | 337/18723 | 8.94e-09 | 3.52e-07 | 130 |
| GO:004682218 | Oral cavity | LP | regulation of nucleocytoplasmic transport | 52/4623 | 106/18723 | 4.82e-08 | 1.67e-06 | 52 |
| GO:0034599110 | Oral cavity | LP | cellular response to oxidative stress | 110/4623 | 288/18723 | 2.19e-07 | 6.65e-06 | 110 |
| GO:000756819 | Oral cavity | LP | aging | 125/4623 | 339/18723 | 3.29e-07 | 9.62e-06 | 125 |
| GO:004668513 | Oral cavity | LP | response to arsenic-containing substance | 22/4623 | 33/18723 | 4.25e-07 | 1.21e-05 | 22 |
| GO:200037717 | Oral cavity | LP | regulation of reactive oxygen species metabolic process | 67/4623 | 157/18723 | 5.54e-07 | 1.51e-05 | 67 |
| GO:001021216 | Oral cavity | LP | response to ionizing radiation | 64/4623 | 148/18723 | 5.60e-07 | 1.51e-05 | 64 |
| GO:007121417 | Oral cavity | LP | cellular response to abiotic stimulus | 121/4623 | 331/18723 | 8.45e-07 | 2.20e-05 | 121 |
| GO:010400417 | Oral cavity | LP | cellular response to environmental stimulus | 121/4623 | 331/18723 | 8.45e-07 | 2.20e-05 | 121 |
| GO:004682415 | Oral cavity | LP | positive regulation of nucleocytoplasmic transport | 33/4623 | 62/18723 | 1.30e-06 | 3.16e-05 | 33 |
| GO:000941112 | Oral cavity | LP | response to UV | 63/4623 | 149/18723 | 1.74e-06 | 4.05e-05 | 63 |
| GO:000931417 | Oral cavity | LP | response to radiation | 155/4623 | 456/18723 | 4.12e-06 | 8.49e-05 | 155 |
| GO:005117013 | Oral cavity | LP | import into nucleus | 65/4623 | 159/18723 | 4.78e-06 | 9.69e-05 | 65 |
| GO:007147815 | Oral cavity | LP | cellular response to radiation | 73/4623 | 186/18723 | 7.44e-06 | 1.41e-04 | 73 |
| GO:1903312110 | Oral cavity | LP | negative regulation of mRNA metabolic process | 42/4623 | 92/18723 | 9.38e-06 | 1.75e-04 | 42 |
| Page: 1 2 3 4 5 6 7 8 9 10 11 12 13 14 15 16 17 18 19 20 21 22 23 24 25 26 27 28 29 30 31 32 33 34 35 36 37 38 39 40 41 42 43 44 45 46 47 48 49 50 51 52 53 54 55 56 57 58 59 60 61 62 63 64 65 66 67 68 69 70 71 72 73 74 75 76 77 78 79 80 81 82 83 84 85 86 87 88 89 90 91 92 93 94 95 96 97 98 99 100 101 102 103 104 105 106 107 108 109 110 111 112 113 114 115 116 117 118 119 120 121 122 123 124 125 126 127 128 129 130 131 132 133 134 135 136 137 138 139 140 141 142 143 144 145 146 147 |
| Pathway ID | Tissue | Disease Stage | Description | Gene Ratio | Bg Ratio | pvalue | p.adjust | qvalue | Count |
| hsa05132211 | Esophagus | ESCC | Salmonella infection | 191/4205 | 249/8465 | 6.51e-19 | 5.45e-17 | 2.79e-17 | 191 |
| hsa05208211 | Esophagus | ESCC | Chemical carcinogenesis - reactive oxygen species | 168/4205 | 223/8465 | 1.83e-15 | 6.81e-14 | 3.49e-14 | 168 |
| hsa05022210 | Esophagus | ESCC | Pathways of neurodegeneration - multiple diseases | 318/4205 | 476/8465 | 6.10e-15 | 2.04e-13 | 1.05e-13 | 318 |
| hsa05010210 | Esophagus | ESCC | Alzheimer disease | 263/4205 | 384/8465 | 1.80e-14 | 5.47e-13 | 2.80e-13 | 263 |
| hsa05166211 | Esophagus | ESCC | Human T-cell leukemia virus 1 infection | 164/4205 | 222/8465 | 8.13e-14 | 2.09e-12 | 1.07e-12 | 164 |
| hsa05020210 | Esophagus | ESCC | Prion disease | 193/4205 | 273/8465 | 6.42e-13 | 1.34e-11 | 6.89e-12 | 193 |
| hsa05131211 | Esophagus | ESCC | Shigellosis | 176/4205 | 247/8465 | 2.27e-12 | 4.01e-11 | 2.05e-11 | 176 |
| hsa0421829 | Esophagus | ESCC | Cellular senescence | 119/4205 | 156/8465 | 5.89e-12 | 9.40e-11 | 4.81e-11 | 119 |
| hsa05130211 | Esophagus | ESCC | Pathogenic Escherichia coli infection | 142/4205 | 197/8465 | 8.21e-11 | 1.06e-09 | 5.42e-10 | 142 |
| hsa0466810 | Esophagus | ESCC | TNF signaling pathway | 89/4205 | 114/8465 | 3.36e-10 | 4.01e-09 | 2.06e-09 | 89 |
| hsa0421027 | Esophagus | ESCC | Apoptosis | 102/4205 | 136/8465 | 1.05e-09 | 1.21e-08 | 6.21e-09 | 102 |
| hsa05170210 | Esophagus | ESCC | Human immunodeficiency virus 1 infection | 147/4205 | 212/8465 | 3.37e-09 | 3.53e-08 | 1.81e-08 | 147 |
| hsa0521020 | Esophagus | ESCC | Colorectal cancer | 69/4205 | 86/8465 | 4.06e-09 | 4.13e-08 | 2.11e-08 | 69 |
| hsa05167211 | Esophagus | ESCC | Kaposi sarcoma-associated herpesvirus infection | 136/4205 | 194/8465 | 4.28e-09 | 4.22e-08 | 2.16e-08 | 136 |
| hsa0516425 | Esophagus | ESCC | Influenza A | 122/4205 | 171/8465 | 5.01e-09 | 4.79e-08 | 2.45e-08 | 122 |
| hsa0521216 | Esophagus | ESCC | Pancreatic cancer | 62/4205 | 76/8465 | 7.37e-09 | 6.85e-08 | 3.51e-08 | 62 |
| hsa0516510 | Esophagus | ESCC | Human papillomavirus infection | 215/4205 | 331/8465 | 7.86e-09 | 7.12e-08 | 3.65e-08 | 215 |
| hsa0513526 | Esophagus | ESCC | Yersinia infection | 100/4205 | 137/8465 | 1.80e-08 | 1.59e-07 | 8.12e-08 | 100 |
| hsa05171211 | Esophagus | ESCC | Coronavirus disease - COVID-19 | 156/4205 | 232/8465 | 3.18e-08 | 2.68e-07 | 1.37e-07 | 156 |
| hsa0522020 | Esophagus | ESCC | Chronic myeloid leukemia | 61/4205 | 76/8465 | 3.20e-08 | 2.68e-07 | 1.37e-07 | 61 |
| Page: 1 2 3 4 5 6 7 8 9 10 11 12 13 14 15 16 17 18 19 20 21 22 23 24 25 26 27 28 29 30 31 32 33 34 35 36 37 38 39 40 41 42 43 44 45 46 47 48 49 50 51 52 |
Top |
Cell-cell communication analysis |
| Identification of potential cell-cell interactions between two cell types and their ligand-receptor pairs for different disease states |
| Ligand | Receptor | LRpair | Pathway | Tissue | Disease Stage |
| Page: 1 |
Top |
Single-cell gene regulatory network inference analysis |
| Find out the significant the regulons (TFs) and the target genes of each regulon across cell types for different disease states |
| TF | Cell Type | Tissue | Disease Stage | Target Gene | RSS | Regulon Activity |
| MAPK1 | CD8TEXINT | Colorectum | AD | ITGA1,YPEL1,UBASH3B, etc. | 2.57e-01 |  |
| MAPK1 | CD8TEREX | Colorectum | AD | ITGA1,YPEL1,UBASH3B, etc. | 2.43e-01 | |
| MAPK1 | MAIT | Colorectum | ADJ | ITGA1,YPEL1,UBASH3B, etc. | 1.38e-01 |  |
| MAPK1 | CD8TEREX | Colorectum | ADJ | ITGA1,YPEL1,UBASH3B, etc. | 1.84e-01 | |
| MAPK1 | CD8TEXINT | Colorectum | ADJ | ITGA1,YPEL1,UBASH3B, etc. | 1.00e-01 | |
| MAPK1 | CD8TEREX | Colorectum | CRC | ITGA1,YPEL1,UBASH3B, etc. | 6.38e-02 |  |
| MAPK1 | TREG | Colorectum | CRC | ITGA1,YPEL1,UBASH3B, etc. | 1.20e-01 | |
| MAPK1 | TH17 | Colorectum | FAP | ITGA1,YPEL1,UBASH3B, etc. | 8.39e-02 |  |
| MAPK1 | CD8TEREX | Colorectum | FAP | ITGA1,YPEL1,UBASH3B, etc. | 2.37e-01 | |
| MAPK1 | MAIT | Colorectum | FAP | ITGA1,YPEL1,UBASH3B, etc. | 1.13e-01 | |
| ∗The dot plots of a searched regulon are shown for all cell subpopulations in each disease state of each tissue based on the regulon specific score inferred using pySCENIC and by calculating the average expression. |
| Page: 1 2 |
Top |
Somatic mutation of malignant transformation related genes |
| Annotation of somatic variants for genes involved in malignant transformation |
| Hugo Symbol | Variant Class | Variant Classification | dbSNP RS | HGVSc | HGVSp | HGVSp Short | SWISSPROT | BIOTYPE | SIFT | PolyPhen | Tumor Sample Barcode | Tissue | Histology | Sex | Age | Stage | Therapy Types | Drugs | Outcome |
| MAPK1 | SNV | Missense_Mutation | c.241G>A | p.Glu81Lys | p.E81K | P28482 | protein_coding | deleterious(0) | probably_damaging(0.995) | TCGA-BH-A0B5-01 | Breast | breast invasive carcinoma | Female | <65 | III/IV | Chemotherapy | adriamycin | CR | |
| MAPK1 | SNV | Missense_Mutation | rs747124623 | c.994G>A | p.Asp332Asn | p.D332N | P28482 | protein_coding | deleterious(0.03) | benign(0.001) | TCGA-E2-A14N-01 | Breast | breast invasive carcinoma | Female | <65 | I/II | Chemotherapy | cyclophosphamide | SD |
| MAPK1 | insertion | Frame_Shift_Ins | novel | c.1024_1025insTTGTGAGCCAAGGTAGAAGCAGTTGCTGGGGAGATGC | p.Lys342IlefsTer20 | p.K342Ifs*20 | P28482 | protein_coding | TCGA-AN-A03Y-01 | Breast | breast invasive carcinoma | Female | >=65 | I/II | Unknown | Unknown | SD | ||
| MAPK1 | SNV | Missense_Mutation | c.964N>A | p.Glu322Lys | p.E322K | P28482 | protein_coding | deleterious(0) | probably_damaging(0.995) | TCGA-C5-A1BI-01 | Cervix | cervical & endocervical cancer | Female | <65 | III/IV | Chemotherapy | cisplatin | SD | |
| MAPK1 | SNV | Missense_Mutation | c.964G>A | p.Glu322Lys | p.E322K | P28482 | protein_coding | deleterious(0) | probably_damaging(0.995) | TCGA-C5-A1MH-01 | Cervix | cervical & endocervical cancer | Female | >=65 | III/IV | Chemotherapy | cisplatin | PD | |
| MAPK1 | SNV | Missense_Mutation | c.961G>A | p.Asp321Asn | p.D321N | P28482 | protein_coding | deleterious(0) | probably_damaging(0.981) | TCGA-DG-A2KL-01 | Cervix | cervical & endocervical cancer | Female | <65 | I/II | Chemotherapy | cisplatin | SD | |
| MAPK1 | SNV | Missense_Mutation | c.964N>A | p.Glu322Lys | p.E322K | P28482 | protein_coding | deleterious(0) | probably_damaging(0.995) | TCGA-DS-A0VN-01 | Cervix | cervical & endocervical cancer | Female | <65 | I/II | Chemotherapy | cisplatin | SD | |
| MAPK1 | SNV | Missense_Mutation | c.964N>A | p.Glu322Lys | p.E322K | P28482 | protein_coding | deleterious(0) | probably_damaging(0.995) | TCGA-EA-A1QS-01 | Cervix | cervical & endocervical cancer | Female | <65 | I/II | Unknown | Unknown | SD | |
| MAPK1 | SNV | Missense_Mutation | c.404G>A | p.Arg135Lys | p.R135K | P28482 | protein_coding | deleterious(0) | probably_damaging(0.992) | TCGA-EA-A3HT-01 | Cervix | cervical & endocervical cancer | Female | >=65 | I/II | Unknown | Unknown | SD | |
| MAPK1 | SNV | Missense_Mutation | c.964G>A | p.Glu322Lys | p.E322K | P28482 | protein_coding | deleterious(0) | probably_damaging(0.995) | TCGA-EA-A5ZD-01 | Cervix | cervical & endocervical cancer | Female | <65 | I/II | Unknown | Unknown | SD |
| Page: 1 2 3 4 5 6 |
Top |
Related drugs of malignant transformation related genes |
| Identification of chemicals and drugs interact with genes involved in malignant transfromation |
| (DGIdb 4.0) |
| Entrez ID | Symbol | Category | Interaction Types | Drug Claim Name | Drug Name | PMIDs |
| 5594 | MAPK1 | SERINE THREONINE KINASE, ENZYME, CLINICALLY ACTIONABLE, KINASE, DRUGGABLE GENOME, DRUG RESISTANCE, TRANSCRIPTION FACTOR | PROGESTERONE | PROGESTERONE | ||
| 5594 | MAPK1 | SERINE THREONINE KINASE, ENZYME, CLINICALLY ACTIONABLE, KINASE, DRUGGABLE GENOME, DRUG RESISTANCE, TRANSCRIPTION FACTOR | SPINASAPONIN A METHYL ESTER | SPINASAPONIN A METHYL ESTER | 20951582 | |
| 5594 | MAPK1 | SERINE THREONINE KINASE, ENZYME, CLINICALLY ACTIONABLE, KINASE, DRUGGABLE GENOME, DRUG RESISTANCE, TRANSCRIPTION FACTOR | DIHYDROGAMBOGIC ACID | DIHYDROGAMBOGIC ACID | ||
| 5594 | MAPK1 | SERINE THREONINE KINASE, ENZYME, CLINICALLY ACTIONABLE, KINASE, DRUGGABLE GENOME, DRUG RESISTANCE, TRANSCRIPTION FACTOR | TREQUINSIN HYDROCHLORIDE | TREQUINSIN HYDROCHLORIDE | ||
| 5594 | MAPK1 | SERINE THREONINE KINASE, ENZYME, CLINICALLY ACTIONABLE, KINASE, DRUGGABLE GENOME, DRUG RESISTANCE, TRANSCRIPTION FACTOR | BENZOTHIAZOL-2-YLAMINE | CHEMBL329785 | 22982122 | |
| 5594 | MAPK1 | SERINE THREONINE KINASE, ENZYME, CLINICALLY ACTIONABLE, KINASE, DRUGGABLE GENOME, DRUG RESISTANCE, TRANSCRIPTION FACTOR | PHENETHYLISOTHIOCYANATE | PHENETHYLISOTHIOCYANATE | 22607231 | |
| 5594 | MAPK1 | SERINE THREONINE KINASE, ENZYME, CLINICALLY ACTIONABLE, KINASE, DRUGGABLE GENOME, DRUG RESISTANCE, TRANSCRIPTION FACTOR | GENTIAN VIOLET | GENTIAN VIOLET | ||
| 5594 | MAPK1 | SERINE THREONINE KINASE, ENZYME, CLINICALLY ACTIONABLE, KINASE, DRUGGABLE GENOME, DRUG RESISTANCE, TRANSCRIPTION FACTOR | MITOXANTRONE DIHYDROCHLORIDE | MITOXANTRONE HYDROCHLORIDE | ||
| 5594 | MAPK1 | SERINE THREONINE KINASE, ENZYME, CLINICALLY ACTIONABLE, KINASE, DRUGGABLE GENOME, DRUG RESISTANCE, TRANSCRIPTION FACTOR | DAUNORUBICIN HYDROCHLORIDE | DAUNORUBICIN HYDROCHLORIDE | ||
| 5594 | MAPK1 | SERINE THREONINE KINASE, ENZYME, CLINICALLY ACTIONABLE, KINASE, DRUGGABLE GENOME, DRUG RESISTANCE, TRANSCRIPTION FACTOR | ZM-449829 | CHEMBL154580 |
| Page: 1 2 3 4 5 6 7 8 9 10 11 12 13 14 15 16 17 18 19 |

Copyright 2023-Present -The University of Texas Health Science Center at Houston |