
|
|||||
|
 | |
| |
| |
| |
| |
| |
|
Gene: HDAC1 |
Gene summary for HDAC1 |
| Gene information | Species | Human | Gene symbol | HDAC1 | Gene ID | 3065 |
| Gene name | histone deacetylase 1 | |
| Gene Alias | GON-10 | |
| Cytomap | 1p35.2-p35.1 | |
| Gene Type | protein-coding | GO ID | GO:0000122 | UniProtAcc | Q13547 |
Top |
Malignant transformation analysis |
| Identification of the aberrant gene expression in precancerous and cancerous lesions by comparing the gene expression of stem-like cells in diseased tissues with normal stem cells |
| Entrez ID | Symbol | Replicates | Species | Organ | Tissue | Adj P-value | Log2FC | Malignancy |
| 3065 | HDAC1 | HTA11_2487_2000001011 | Human | Colorectum | SER | 1.39e-08 | 6.33e-01 | -0.1808 |
| 3065 | HDAC1 | HTA11_1938_2000001011 | Human | Colorectum | AD | 4.02e-15 | 7.64e-01 | -0.0811 |
| 3065 | HDAC1 | HTA11_347_2000001011 | Human | Colorectum | AD | 1.06e-22 | 6.78e-01 | -0.1954 |
| 3065 | HDAC1 | HTA11_411_2000001011 | Human | Colorectum | SER | 4.38e-03 | 8.61e-01 | -0.2602 |
| 3065 | HDAC1 | HTA11_2112_2000001011 | Human | Colorectum | SER | 4.27e-02 | 6.72e-01 | -0.2196 |
| 3065 | HDAC1 | HTA11_83_2000001011 | Human | Colorectum | SER | 8.32e-10 | 6.42e-01 | -0.1526 |
| 3065 | HDAC1 | HTA11_696_2000001011 | Human | Colorectum | AD | 1.72e-11 | 6.20e-01 | -0.1464 |
| 3065 | HDAC1 | HTA11_866_2000001011 | Human | Colorectum | AD | 1.90e-04 | 3.99e-01 | -0.1001 |
| 3065 | HDAC1 | HTA11_1391_2000001011 | Human | Colorectum | AD | 2.42e-12 | 7.82e-01 | -0.059 |
| 3065 | HDAC1 | HTA11_2992_2000001011 | Human | Colorectum | SER | 2.36e-03 | 5.22e-01 | -0.1706 |
| 3065 | HDAC1 | HTA11_546_2000001011 | Human | Colorectum | AD | 7.11e-03 | 4.93e-01 | -0.0842 |
| 3065 | HDAC1 | HTA11_866_3004761011 | Human | Colorectum | AD | 1.32e-07 | 4.96e-01 | 0.096 |
| 3065 | HDAC1 | HTA11_7696_3000711011 | Human | Colorectum | AD | 5.86e-13 | 6.67e-01 | 0.0674 |
| 3065 | HDAC1 | HTA11_99999970781_79442 | Human | Colorectum | MSS | 2.73e-08 | 5.75e-01 | 0.294 |
| 3065 | HDAC1 | HTA11_99999965062_69753 | Human | Colorectum | MSI-H | 7.39e-03 | 8.72e-01 | 0.3487 |
| 3065 | HDAC1 | HTA11_99999965104_69814 | Human | Colorectum | MSS | 5.73e-04 | 4.48e-01 | 0.281 |
| 3065 | HDAC1 | HTA11_99999971662_82457 | Human | Colorectum | MSS | 2.45e-20 | 9.41e-01 | 0.3859 |
| 3065 | HDAC1 | A015-C-203 | Human | Colorectum | FAP | 3.35e-16 | -2.66e-01 | -0.1294 |
| 3065 | HDAC1 | A002-C-201 | Human | Colorectum | FAP | 6.65e-04 | -1.02e-01 | 0.0324 |
| 3065 | HDAC1 | A001-C-119 | Human | Colorectum | FAP | 3.02e-02 | -2.19e-01 | -0.1557 |
| Page: 1 2 3 4 5 6 7 8 9 |
| Tissue | Expression Dynamics | Abbreviation |
| Colorectum (GSE201348) |  | FAP: Familial adenomatous polyposis |
| CRC: Colorectal cancer | ||
| Colorectum (HTA11) |  | AD: Adenomas |
| SER: Sessile serrated lesions | ||
| MSI-H: Microsatellite-high colorectal cancer | ||
| MSS: Microsatellite stable colorectal cancer | ||
| Esophagus | 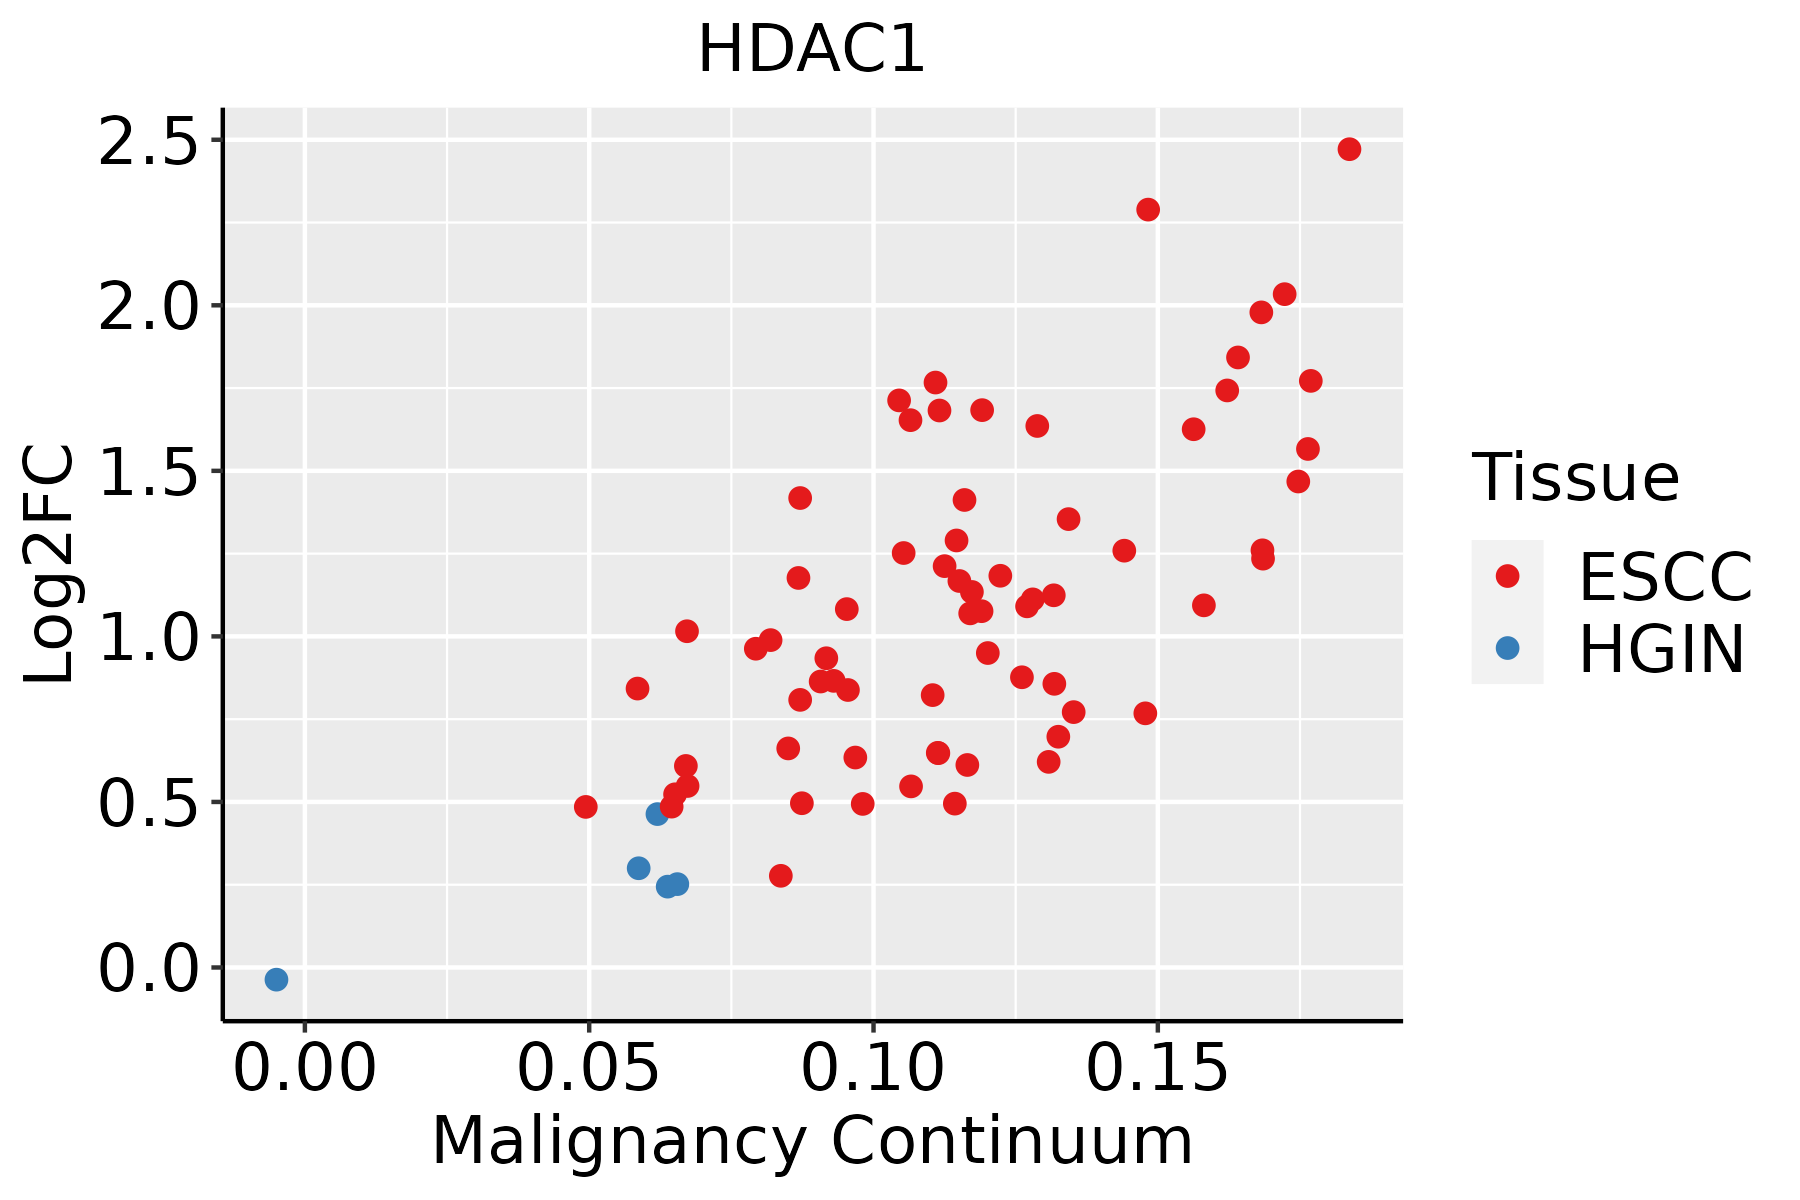 | ESCC: Esophageal squamous cell carcinoma |
| HGIN: High-grade intraepithelial neoplasias | ||
| LGIN: Low-grade intraepithelial neoplasias | ||
| Liver | 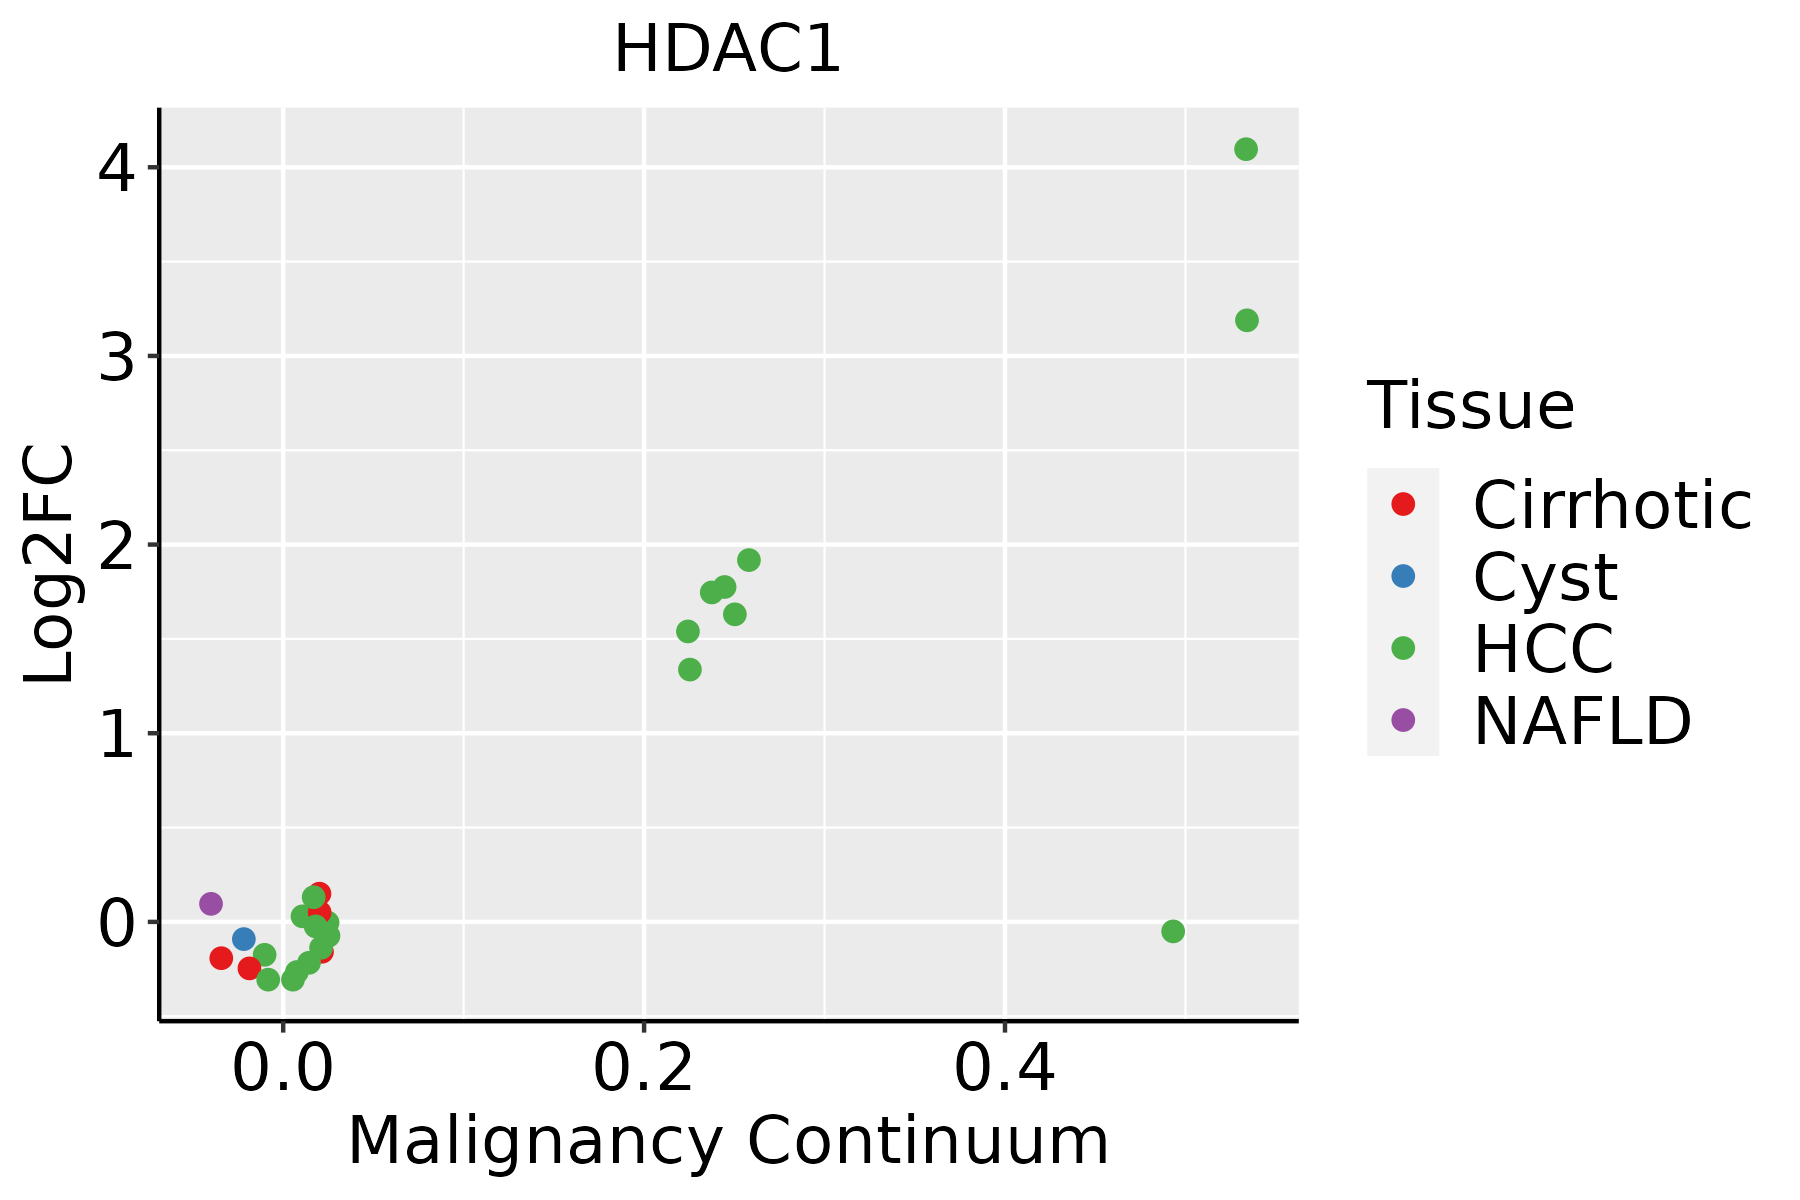 | HCC: Hepatocellular carcinoma |
| NAFLD: Non-alcoholic fatty liver disease | ||
| Oral Cavity |  | EOLP: Erosive Oral lichen planus |
| LP: leukoplakia | ||
| NEOLP: Non-erosive oral lichen planus | ||
| OSCC: Oral squamous cell carcinoma | ||
| Prostate | 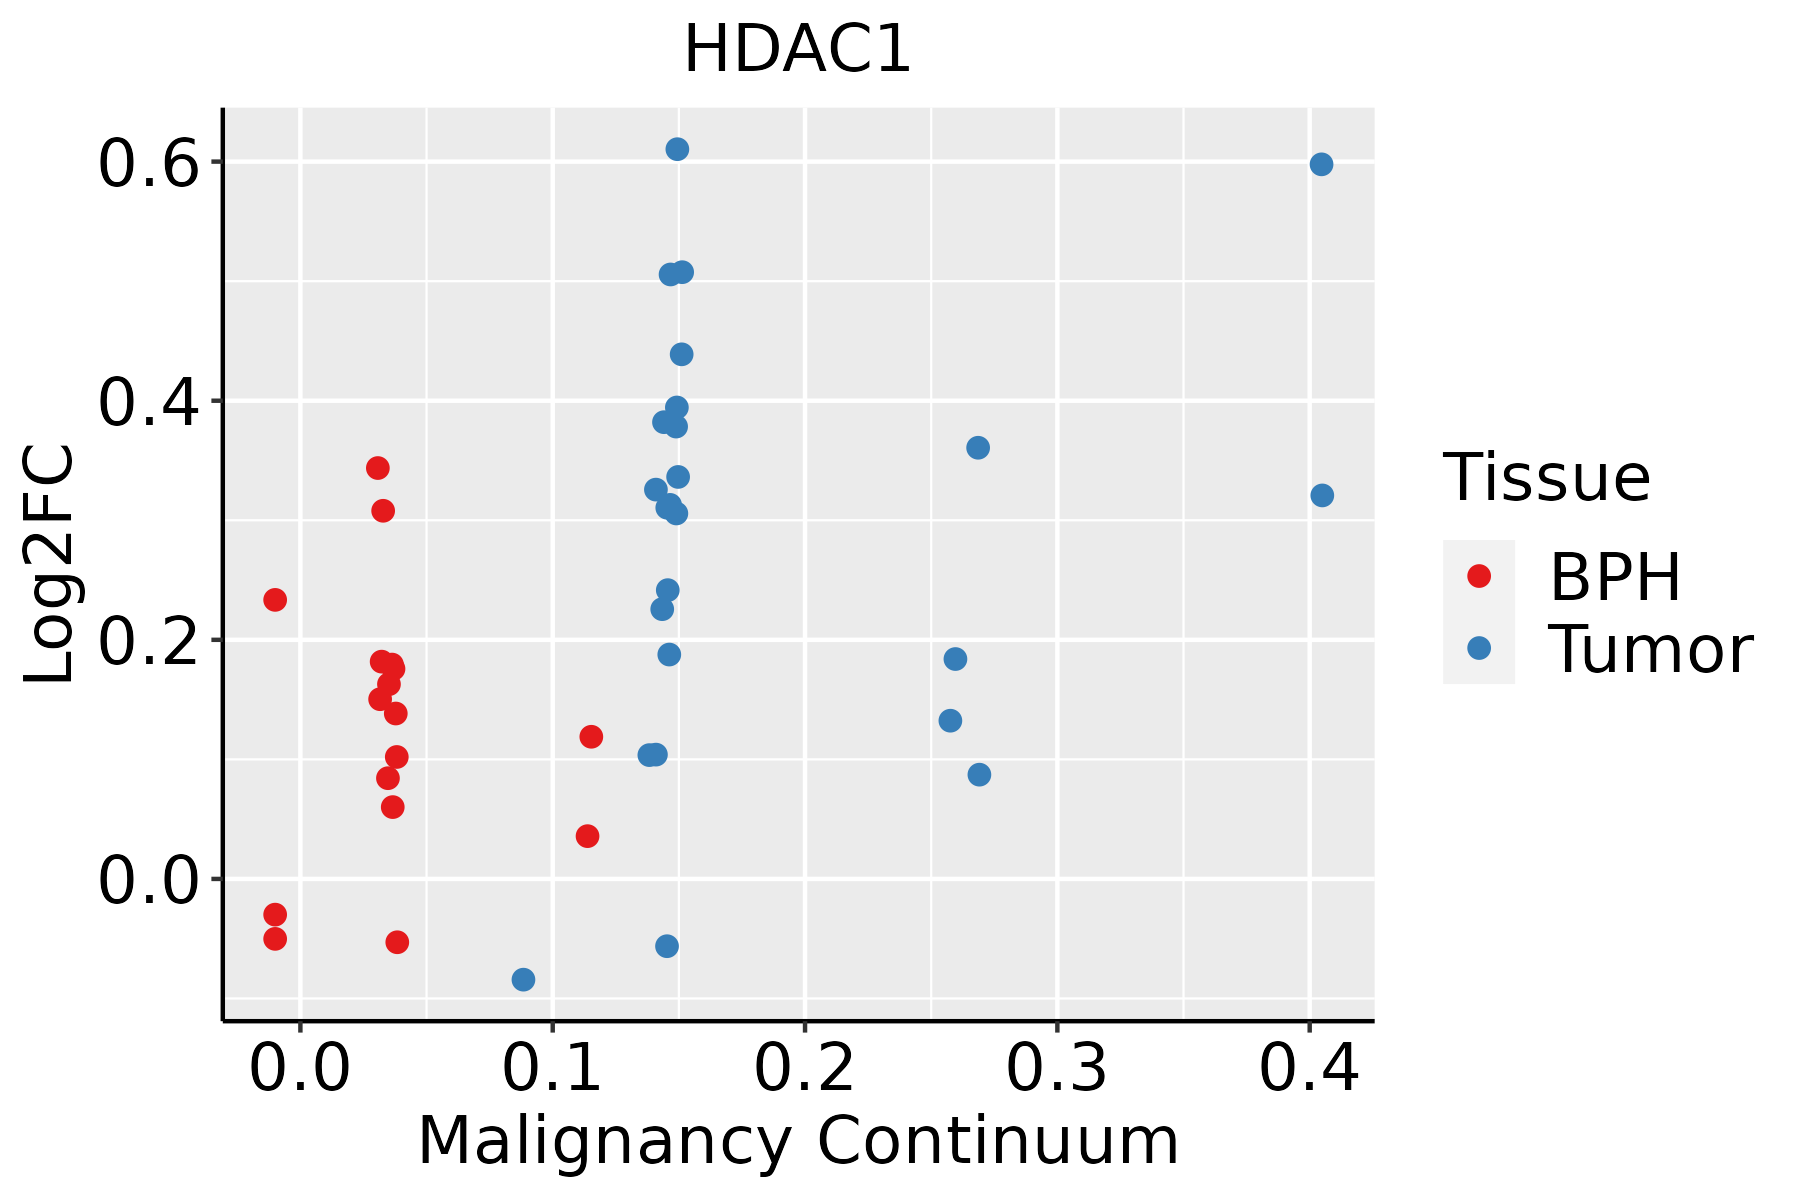 | BPH: Benign Prostatic Hyperplasia |
| Skin | 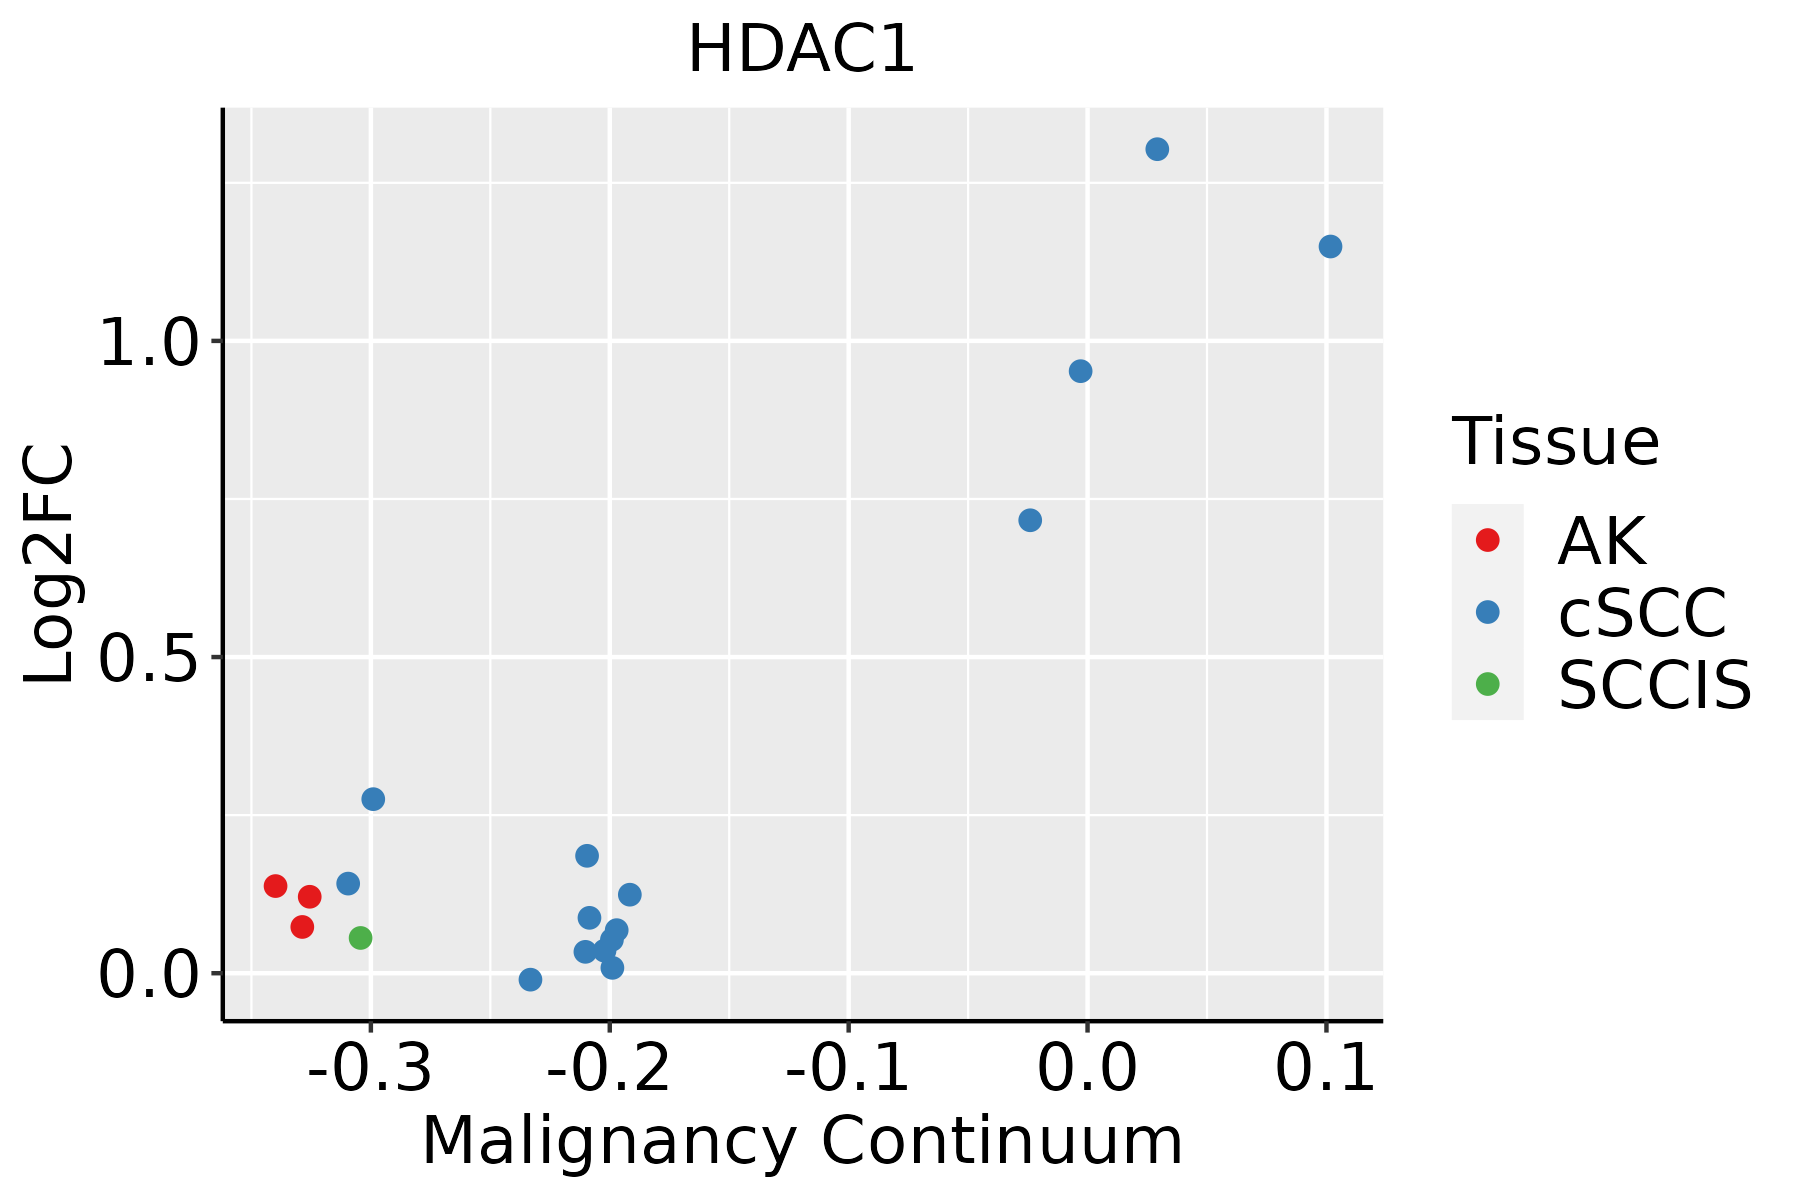 | AK: Actinic keratosis |
| cSCC: Cutaneous squamous cell carcinoma | ||
| SCCIS:squamous cell carcinoma in situ | ||
| Thyroid | 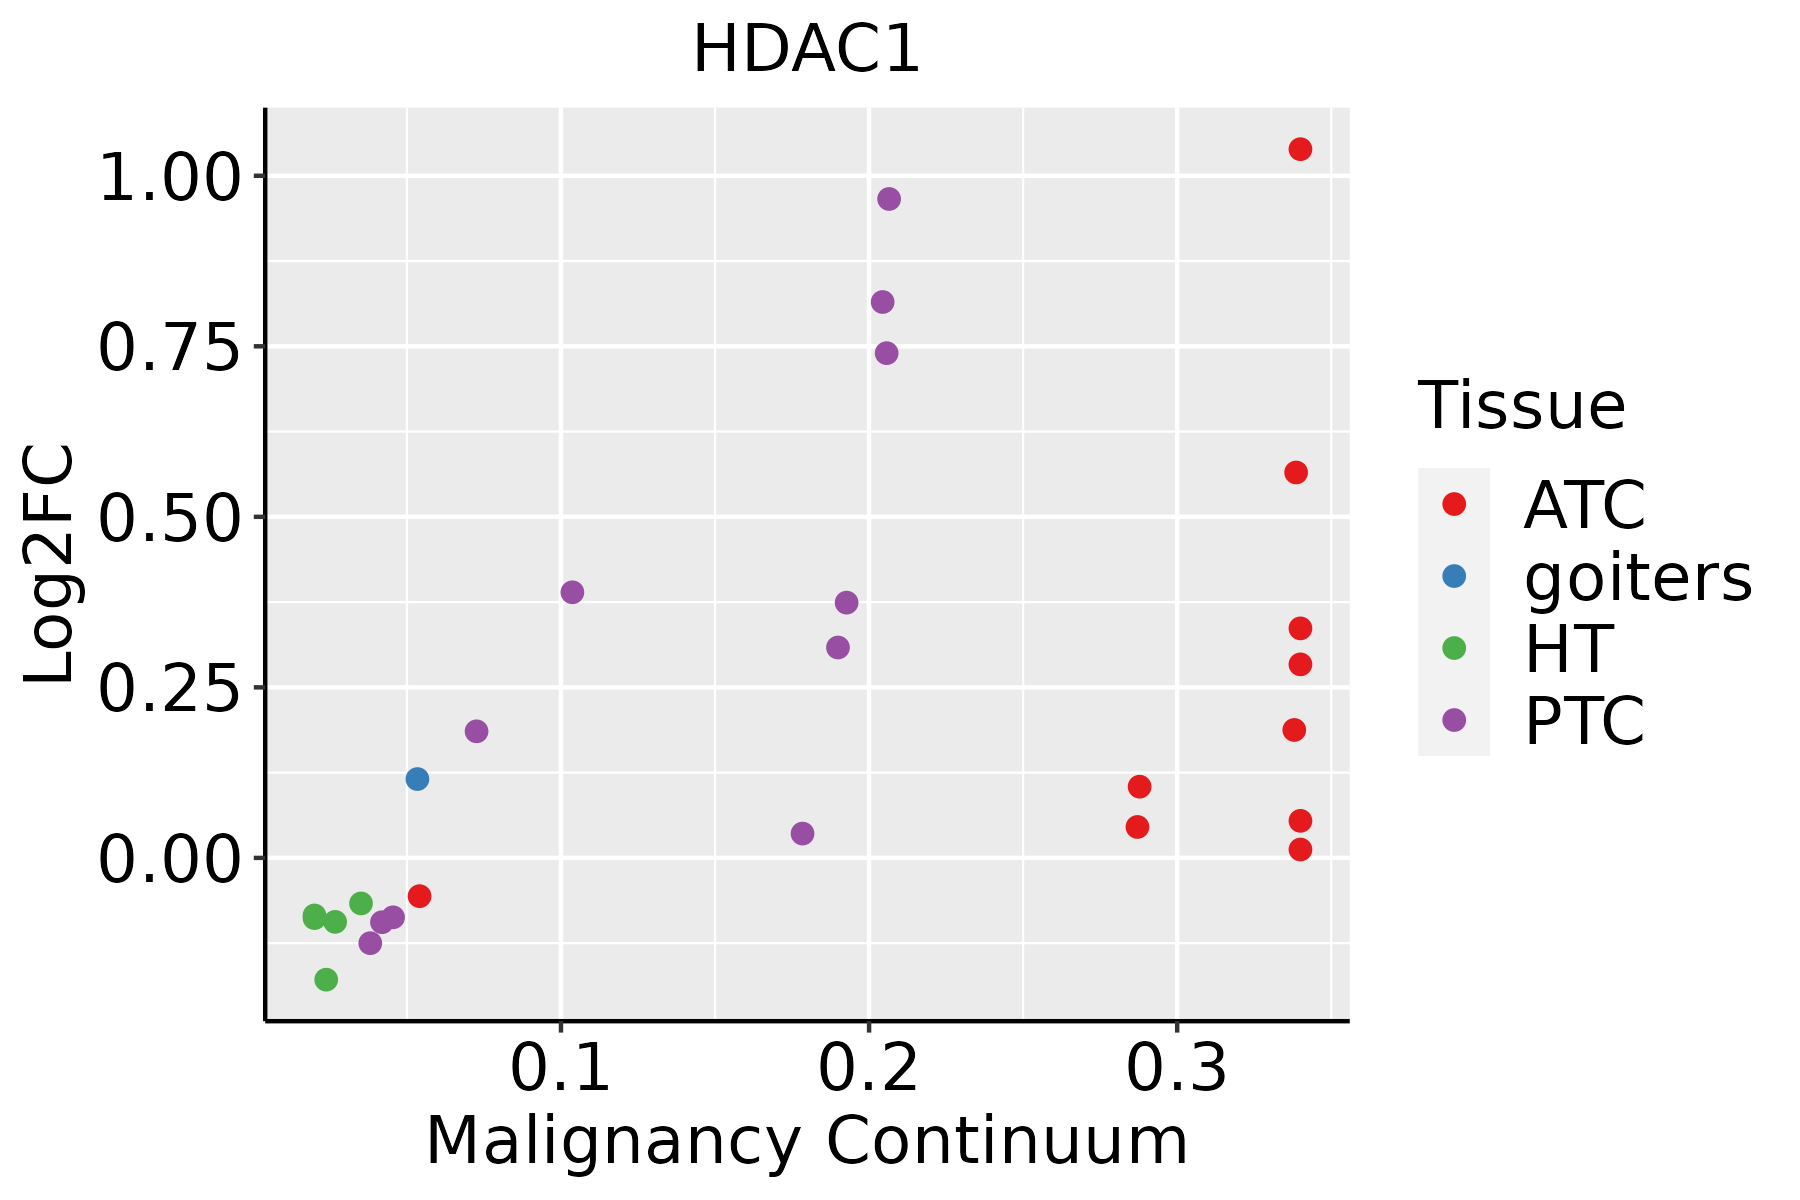 | ATC: Anaplastic thyroid cancer |
| HT: Hashimoto's thyroiditis | ||
| PTC: Papillary thyroid cancer |
| ∗log2FC in expression of this searched gene in stem-like cells from each diseased tissue sample relative to stem-like cells in normal samples in each tissue plotted against the malignancy continuum. Samples are colored based on if they are from different disease stage. |
Top |
Malignant transformation related pathway analysis |
| Find out the enriched GO biological processes and KEGG pathways involved in transition from healthy to precancer to cancer |
| Tissue | Disease Stage | Enriched GO biological Processes |
| Colorectum | AD |  |
| Colorectum | SER |  |
| Colorectum | MSS |  |
| Colorectum | MSI-H |  |
| Colorectum | FAP |  |
| ∗Top 15 enriched GO BP terms are showed in the bar plot of each disease state in each tissue. Each row represents a significant GO biological process which is colored according to the -log10(p.adjust). |
| Page: 1 2 3 4 5 6 7 8 9 |
| GO ID | Tissue | Disease Stage | Description | Gene Ratio | Bg Ratio | pvalue | p.adjust | Count |
| GO:00181086 | Thyroid | ATC | peptidyl-tyrosine phosphorylation | 153/6293 | 375/18723 | 1.96e-03 | 9.48e-03 | 153 |
| GO:00351074 | Thyroid | ATC | appendage morphogenesis | 63/6293 | 138/18723 | 2.13e-03 | 1.00e-02 | 63 |
| GO:00351084 | Thyroid | ATC | limb morphogenesis | 63/6293 | 138/18723 | 2.13e-03 | 1.00e-02 | 63 |
| GO:007169223 | Thyroid | ATC | protein localization to extracellular region | 150/6293 | 368/18723 | 2.25e-03 | 1.05e-02 | 150 |
| GO:0009755110 | Thyroid | ATC | hormone-mediated signaling pathway | 83/6293 | 190/18723 | 2.34e-03 | 1.09e-02 | 83 |
| GO:00458141 | Thyroid | ATC | negative regulation of gene expression, epigenetic | 27/6293 | 50/18723 | 2.35e-03 | 1.10e-02 | 27 |
| GO:00487368 | Thyroid | ATC | appendage development | 76/6293 | 172/18723 | 2.41e-03 | 1.12e-02 | 76 |
| GO:00601738 | Thyroid | ATC | limb development | 76/6293 | 172/18723 | 2.41e-03 | 1.12e-02 | 76 |
| GO:000941027 | Thyroid | ATC | response to xenobiotic stimulus | 184/6293 | 462/18723 | 2.70e-03 | 1.23e-02 | 184 |
| GO:003629612 | Thyroid | ATC | response to increased oxygen levels | 18/6293 | 30/18723 | 2.71e-03 | 1.24e-02 | 18 |
| GO:000930623 | Thyroid | ATC | protein secretion | 146/6293 | 359/18723 | 2.83e-03 | 1.29e-02 | 146 |
| GO:00315071 | Thyroid | ATC | heterochromatin assembly | 22/6293 | 39/18723 | 2.84e-03 | 1.29e-02 | 22 |
| GO:005170222 | Thyroid | ATC | biological process involved in interaction with symbiont | 45/6293 | 94/18723 | 2.86e-03 | 1.30e-02 | 45 |
| GO:00607657 | Thyroid | ATC | regulation of androgen receptor signaling pathway | 17/6293 | 28/18723 | 2.97e-03 | 1.35e-02 | 17 |
| GO:007082811 | Thyroid | ATC | heterochromatin organization | 25/6293 | 46/18723 | 3.00e-03 | 1.36e-02 | 25 |
| GO:003559223 | Thyroid | ATC | establishment of protein localization to extracellular region | 146/6293 | 360/18723 | 3.20e-03 | 1.44e-02 | 146 |
| GO:190198412 | Thyroid | ATC | negative regulation of protein acetylation | 15/6293 | 24/18723 | 3.52e-03 | 1.56e-02 | 15 |
| GO:007093211 | Thyroid | ATC | histone H3 deacetylation | 13/6293 | 20/18723 | 4.03e-03 | 1.73e-02 | 13 |
| GO:200075712 | Thyroid | ATC | negative regulation of peptidyl-lysine acetylation | 13/6293 | 20/18723 | 4.03e-03 | 1.73e-02 | 13 |
| GO:00327608 | Thyroid | ATC | positive regulation of tumor necrosis factor production | 48/6293 | 103/18723 | 4.14e-03 | 1.76e-02 | 48 |
| Page: 1 2 3 4 5 6 7 8 9 10 11 12 13 14 15 16 17 18 19 20 21 22 23 24 25 26 27 28 29 30 31 32 33 34 35 36 37 38 39 40 41 42 43 44 45 46 47 48 49 50 51 52 53 54 55 56 57 58 59 60 61 62 63 64 |
| Pathway ID | Tissue | Disease Stage | Description | Gene Ratio | Bg Ratio | pvalue | p.adjust | qvalue | Count |
| hsa05016 | Colorectum | AD | Huntington disease | 147/2092 | 306/8465 | 1.93e-19 | 9.26e-18 | 5.91e-18 | 147 |
| hsa04919 | Colorectum | AD | Thyroid hormone signaling pathway | 51/2092 | 121/8465 | 1.71e-05 | 1.73e-04 | 1.10e-04 | 51 |
| hsa04213 | Colorectum | AD | Longevity regulating pathway - multiple species | 27/2092 | 62/8465 | 8.72e-04 | 5.96e-03 | 3.80e-03 | 27 |
| hsa05220 | Colorectum | AD | Chronic myeloid leukemia | 31/2092 | 76/8465 | 1.41e-03 | 8.46e-03 | 5.39e-03 | 31 |
| hsa050161 | Colorectum | AD | Huntington disease | 147/2092 | 306/8465 | 1.93e-19 | 9.26e-18 | 5.91e-18 | 147 |
| hsa049191 | Colorectum | AD | Thyroid hormone signaling pathway | 51/2092 | 121/8465 | 1.71e-05 | 1.73e-04 | 1.10e-04 | 51 |
| hsa042131 | Colorectum | AD | Longevity regulating pathway - multiple species | 27/2092 | 62/8465 | 8.72e-04 | 5.96e-03 | 3.80e-03 | 27 |
| hsa052201 | Colorectum | AD | Chronic myeloid leukemia | 31/2092 | 76/8465 | 1.41e-03 | 8.46e-03 | 5.39e-03 | 31 |
| hsa050162 | Colorectum | SER | Huntington disease | 127/1580 | 306/8465 | 3.29e-21 | 1.37e-19 | 9.92e-20 | 127 |
| hsa049192 | Colorectum | SER | Thyroid hormone signaling pathway | 40/1580 | 121/8465 | 1.02e-04 | 1.06e-03 | 7.67e-04 | 40 |
| hsa04350 | Colorectum | SER | TGF-beta signaling pathway | 31/1580 | 108/8465 | 7.00e-03 | 3.77e-02 | 2.74e-02 | 31 |
| hsa042132 | Colorectum | SER | Longevity regulating pathway - multiple species | 20/1580 | 62/8465 | 7.15e-03 | 3.77e-02 | 2.74e-02 | 20 |
| hsa050163 | Colorectum | SER | Huntington disease | 127/1580 | 306/8465 | 3.29e-21 | 1.37e-19 | 9.92e-20 | 127 |
| hsa049193 | Colorectum | SER | Thyroid hormone signaling pathway | 40/1580 | 121/8465 | 1.02e-04 | 1.06e-03 | 7.67e-04 | 40 |
| hsa043501 | Colorectum | SER | TGF-beta signaling pathway | 31/1580 | 108/8465 | 7.00e-03 | 3.77e-02 | 2.74e-02 | 31 |
| hsa042133 | Colorectum | SER | Longevity regulating pathway - multiple species | 20/1580 | 62/8465 | 7.15e-03 | 3.77e-02 | 2.74e-02 | 20 |
| hsa050164 | Colorectum | MSS | Huntington disease | 141/1875 | 306/8465 | 2.90e-21 | 1.62e-19 | 9.92e-20 | 141 |
| hsa049194 | Colorectum | MSS | Thyroid hormone signaling pathway | 46/1875 | 121/8465 | 5.04e-05 | 4.97e-04 | 3.05e-04 | 46 |
| hsa042134 | Colorectum | MSS | Longevity regulating pathway - multiple species | 27/1875 | 62/8465 | 1.33e-04 | 1.17e-03 | 7.18e-04 | 27 |
| hsa052202 | Colorectum | MSS | Chronic myeloid leukemia | 29/1875 | 76/8465 | 1.10e-03 | 6.27e-03 | 3.84e-03 | 29 |
| Page: 1 2 3 4 5 6 7 8 9 |
Top |
Cell-cell communication analysis |
| Identification of potential cell-cell interactions between two cell types and their ligand-receptor pairs for different disease states |
| Ligand | Receptor | LRpair | Pathway | Tissue | Disease Stage |
| Page: 1 |
Top |
Single-cell gene regulatory network inference analysis |
| Find out the significant the regulons (TFs) and the target genes of each regulon across cell types for different disease states |
| TF | Cell Type | Tissue | Disease Stage | Target Gene | RSS | Regulon Activity |
| HDAC1 | MVA | Breast | ADJ | MARCKSL1,HYAL2,PLVAP, etc. | 2.42e-01 |  |
| HDAC1 | PVA | Breast | ADJ | MARCKSL1,HYAL2,PLVAP, etc. | 4.04e-01 | |
| HDAC1 | PVA | Breast | Healthy | MARCKSL1,HYAL2,PLVAP, etc. | 3.11e-01 |  |
| HDAC1 | MVA | Breast | Healthy | MARCKSL1,HYAL2,PLVAP, etc. | 1.26e-01 | |
| HDAC1 | MSC.ADIPO | Breast | IDC | MARCKSL1,HYAL2,PLVAP, etc. | 3.82e-01 |  |
| HDAC1 | LYMEND | Breast | IDC | MARCKSL1,HYAL2,PLVAP, etc. | 2.15e-02 | |
| HDAC1 | MVA | Breast | Precancer | MARCKSL1,HYAL2,PLVAP, etc. | 3.08e-01 |  |
| HDAC1 | PVA | Breast | Precancer | MARCKSL1,HYAL2,PLVAP, etc. | 2.51e-01 | |
| HDAC1 | TH1 | Lung | ADJ | CHI3L2,CORO1A,GZMK, etc. | 1.14e-01 |  |
| HDAC1 | NKT | Pancreas | ADJ | AL354740.1,AC022217.2,GYS1, etc. | 3.65e-01 |  |
| ∗The dot plots of a searched regulon are shown for all cell subpopulations in each disease state of each tissue based on the regulon specific score inferred using pySCENIC and by calculating the average expression. |
| Page: 1 2 |
Top |
Somatic mutation of malignant transformation related genes |
| Annotation of somatic variants for genes involved in malignant transformation |
| Hugo Symbol | Variant Class | Variant Classification | dbSNP RS | HGVSc | HGVSp | HGVSp Short | SWISSPROT | BIOTYPE | SIFT | PolyPhen | Tumor Sample Barcode | Tissue | Histology | Sex | Age | Stage | Therapy Types | Drugs | Outcome |
| HDAC1 | SNV | Missense_Mutation | novel | c.286N>A | p.Val96Ile | p.V96I | Q13547 | protein_coding | tolerated(0.06) | benign(0.275) | TCGA-A7-A5ZW-01 | Breast | breast invasive carcinoma | Female | <65 | I/II | Chemotherapy | cyclophosphamide | CR |
| HDAC1 | SNV | Missense_Mutation | rs760852226 | c.1126G>A | p.Ala376Thr | p.A376T | Q13547 | protein_coding | tolerated(0.07) | possibly_damaging(0.522) | TCGA-AN-A046-01 | Breast | breast invasive carcinoma | Female | >=65 | I/II | Unknown | Unknown | SD |
| HDAC1 | SNV | Missense_Mutation | c.1135N>T | p.Val379Phe | p.V379F | Q13547 | protein_coding | deleterious(0) | probably_damaging(0.997) | TCGA-AN-A0FJ-01 | Breast | breast invasive carcinoma | Female | <65 | III/IV | Unknown | Unknown | SD | |
| HDAC1 | SNV | Missense_Mutation | novel | c.1171G>A | p.Glu391Lys | p.E391K | Q13547 | protein_coding | deleterious(0.04) | benign(0.103) | TCGA-AN-A0FV-01 | Breast | breast invasive carcinoma | Female | <65 | I/II | Unknown | Unknown | SD |
| HDAC1 | SNV | Missense_Mutation | novel | c.608N>G | p.Glu203Gly | p.E203G | Q13547 | protein_coding | deleterious(0) | possibly_damaging(0.465) | TCGA-BH-A8G0-01 | Breast | breast invasive carcinoma | Female | <65 | I/II | Chemotherapy | taxotere | CR |
| HDAC1 | SNV | Missense_Mutation | c.1273N>C | p.Glu425Gln | p.E425Q | Q13547 | protein_coding | deleterious(0.05) | benign(0.205) | TCGA-C8-A12T-01 | Breast | breast invasive carcinoma | Female | <65 | I/II | Unknown | Unknown | SD | |
| HDAC1 | insertion | Nonsense_Mutation | novel | c.673_674insGTTG | p.Asn225SerfsTer2 | p.N225Sfs*2 | Q13547 | protein_coding | TCGA-AO-A0J6-01 | Breast | breast invasive carcinoma | Female | <65 | I/II | Chemotherapy | doxorubicin | SD | ||
| HDAC1 | insertion | Frame_Shift_Ins | novel | c.674_675insACTGTTCCAT | p.Asn225LysfsTer12 | p.N225Kfs*12 | Q13547 | protein_coding | TCGA-AO-A0J6-01 | Breast | breast invasive carcinoma | Female | <65 | I/II | Chemotherapy | doxorubicin | SD | ||
| HDAC1 | SNV | Missense_Mutation | novel | c.259T>C | p.Tyr87His | p.Y87H | Q13547 | protein_coding | tolerated(0.21) | probably_damaging(0.972) | TCGA-AA-3710-01 | Colorectum | colon adenocarcinoma | Female | >=65 | I/II | Unknown | Unknown | SD |
| HDAC1 | SNV | Missense_Mutation | c.476C>T | p.Ala159Val | p.A159V | Q13547 | protein_coding | deleterious(0) | benign(0.22) | TCGA-CK-4951-01 | Colorectum | colon adenocarcinoma | Female | >=65 | I/II | Unknown | Unknown | PD |
| Page: 1 2 3 4 |
Top |
Related drugs of malignant transformation related genes |
| Identification of chemicals and drugs interact with genes involved in malignant transfromation |
| (DGIdb 4.0) |
| Entrez ID | Symbol | Category | Interaction Types | Drug Claim Name | Drug Name | PMIDs |
| 3065 | HDAC1 | DRUGGABLE GENOME, CLINICALLY ACTIONABLE, ENZYME | inhibitor | 310264675 | CUDC-101 | |
| 3065 | HDAC1 | DRUGGABLE GENOME, CLINICALLY ACTIONABLE, ENZYME | PMID28092474-Compound-32h | |||
| 3065 | HDAC1 | DRUGGABLE GENOME, CLINICALLY ACTIONABLE, ENZYME | inhibitor | 348353661 | ||
| 3065 | HDAC1 | DRUGGABLE GENOME, CLINICALLY ACTIONABLE, ENZYME | inhibitor | ROMIDEPSIN | ROMIDEPSIN | |
| 3065 | HDAC1 | DRUGGABLE GENOME, CLINICALLY ACTIONABLE, ENZYME | inhibitor | 187051807 | SCRIPTAID | |
| 3065 | HDAC1 | DRUGGABLE GENOME, CLINICALLY ACTIONABLE, ENZYME | PMID28092474-Compound-34a | |||
| 3065 | HDAC1 | DRUGGABLE GENOME, CLINICALLY ACTIONABLE, ENZYME | inhibitor | 252166602 | NANATINOSTAT | |
| 3065 | HDAC1 | DRUGGABLE GENOME, CLINICALLY ACTIONABLE, ENZYME | PMID29671355-Compound-27 | |||
| 3065 | HDAC1 | DRUGGABLE GENOME, CLINICALLY ACTIONABLE, ENZYME | inhibitor | PANOBINOSTAT | PANOBINOSTAT | |
| 3065 | HDAC1 | DRUGGABLE GENOME, CLINICALLY ACTIONABLE, ENZYME | CHIDAMIDE | CHIDAMIDE |
| Page: 1 2 3 4 5 6 7 8 9 10 11 12 13 14 15 16 17 18 19 20 21 |

Copyright 2023-Present -The University of Texas Health Science Center at Houston |