
|
|||||
|
 | |
| |
| |
| |
| |
| |
|
Gene: RPS27 |
Gene summary for RPS27 |
| Gene information | Species | Human | Gene symbol | RPS27 | Gene ID | 6232 |
| Gene name | ribosomal protein S27 | |
| Gene Alias | DBA17 | |
| Cytomap | 1q21.3 | |
| Gene Type | protein-coding | GO ID | GO:0000028 | UniProtAcc | P42677 |
Top |
Malignant transformation analysis |
| Identification of the aberrant gene expression in precancerous and cancerous lesions by comparing the gene expression of stem-like cells in diseased tissues with normal stem cells |
| Entrez ID | Symbol | Replicates | Species | Organ | Tissue | Adj P-value | Log2FC | Malignancy |
| 6232 | RPS27 | CA_HPV_1 | Human | Cervix | CC | 3.12e-03 | 2.11e-02 | 0.0264 |
| 6232 | RPS27 | CA_HPV_2 | Human | Cervix | CC | 6.43e-09 | -1.95e-01 | 0.0391 |
| 6232 | RPS27 | HSIL_HPV_1 | Human | Cervix | HSIL_HPV | 1.26e-06 | 1.43e-01 | 0.0116 |
| 6232 | RPS27 | HSIL_HPV_2 | Human | Cervix | HSIL_HPV | 1.12e-08 | 1.15e-01 | 0.0208 |
| 6232 | RPS27 | N_HPV_1 | Human | Cervix | N_HPV | 3.39e-13 | 9.88e-02 | 0.0079 |
| 6232 | RPS27 | CCI_1 | Human | Cervix | CC | 4.43e-67 | -2.13e+00 | 0.528 |
| 6232 | RPS27 | CCI_2 | Human | Cervix | CC | 4.85e-62 | -2.14e+00 | 0.5249 |
| 6232 | RPS27 | CCI_3 | Human | Cervix | CC | 5.76e-77 | -2.19e+00 | 0.516 |
| 6232 | RPS27 | CCII_1 | Human | Cervix | CC | 2.31e-99 | -2.15e+00 | 0.3249 |
| 6232 | RPS27 | Tumor | Human | Cervix | CC | 2.81e-47 | -3.44e-01 | 0.1241 |
| 6232 | RPS27 | sample1 | Human | Cervix | CC | 1.74e-07 | -2.18e-01 | 0.0959 |
| 6232 | RPS27 | sample3 | Human | Cervix | CC | 3.87e-57 | -3.69e-01 | 0.1387 |
| 6232 | RPS27 | H2 | Human | Cervix | HSIL_HPV | 9.28e-51 | -4.45e-01 | 0.0632 |
| 6232 | RPS27 | T1 | Human | Cervix | CC | 3.25e-25 | -2.64e-01 | 0.0918 |
| 6232 | RPS27 | T3 | Human | Cervix | CC | 1.10e-63 | -3.63e-01 | 0.1389 |
| 6232 | RPS27 | HTA11_3410_2000001011 | Human | Colorectum | AD | 7.95e-139 | 2.86e+00 | 0.0155 |
| 6232 | RPS27 | HTA11_2487_2000001011 | Human | Colorectum | SER | 1.84e-85 | 3.04e+00 | -0.1808 |
| 6232 | RPS27 | HTA11_2951_2000001011 | Human | Colorectum | AD | 3.95e-40 | 2.84e+00 | 0.0216 |
| 6232 | RPS27 | HTA11_1938_2000001011 | Human | Colorectum | AD | 6.77e-78 | 2.95e+00 | -0.0811 |
| 6232 | RPS27 | HTA11_78_2000001011 | Human | Colorectum | AD | 6.07e-37 | 1.47e+00 | -0.1088 |
| Page: 1 2 3 4 5 6 7 8 9 10 11 12 13 14 15 16 17 18 19 |
| Tissue | Expression Dynamics | Abbreviation |
| Cervix | 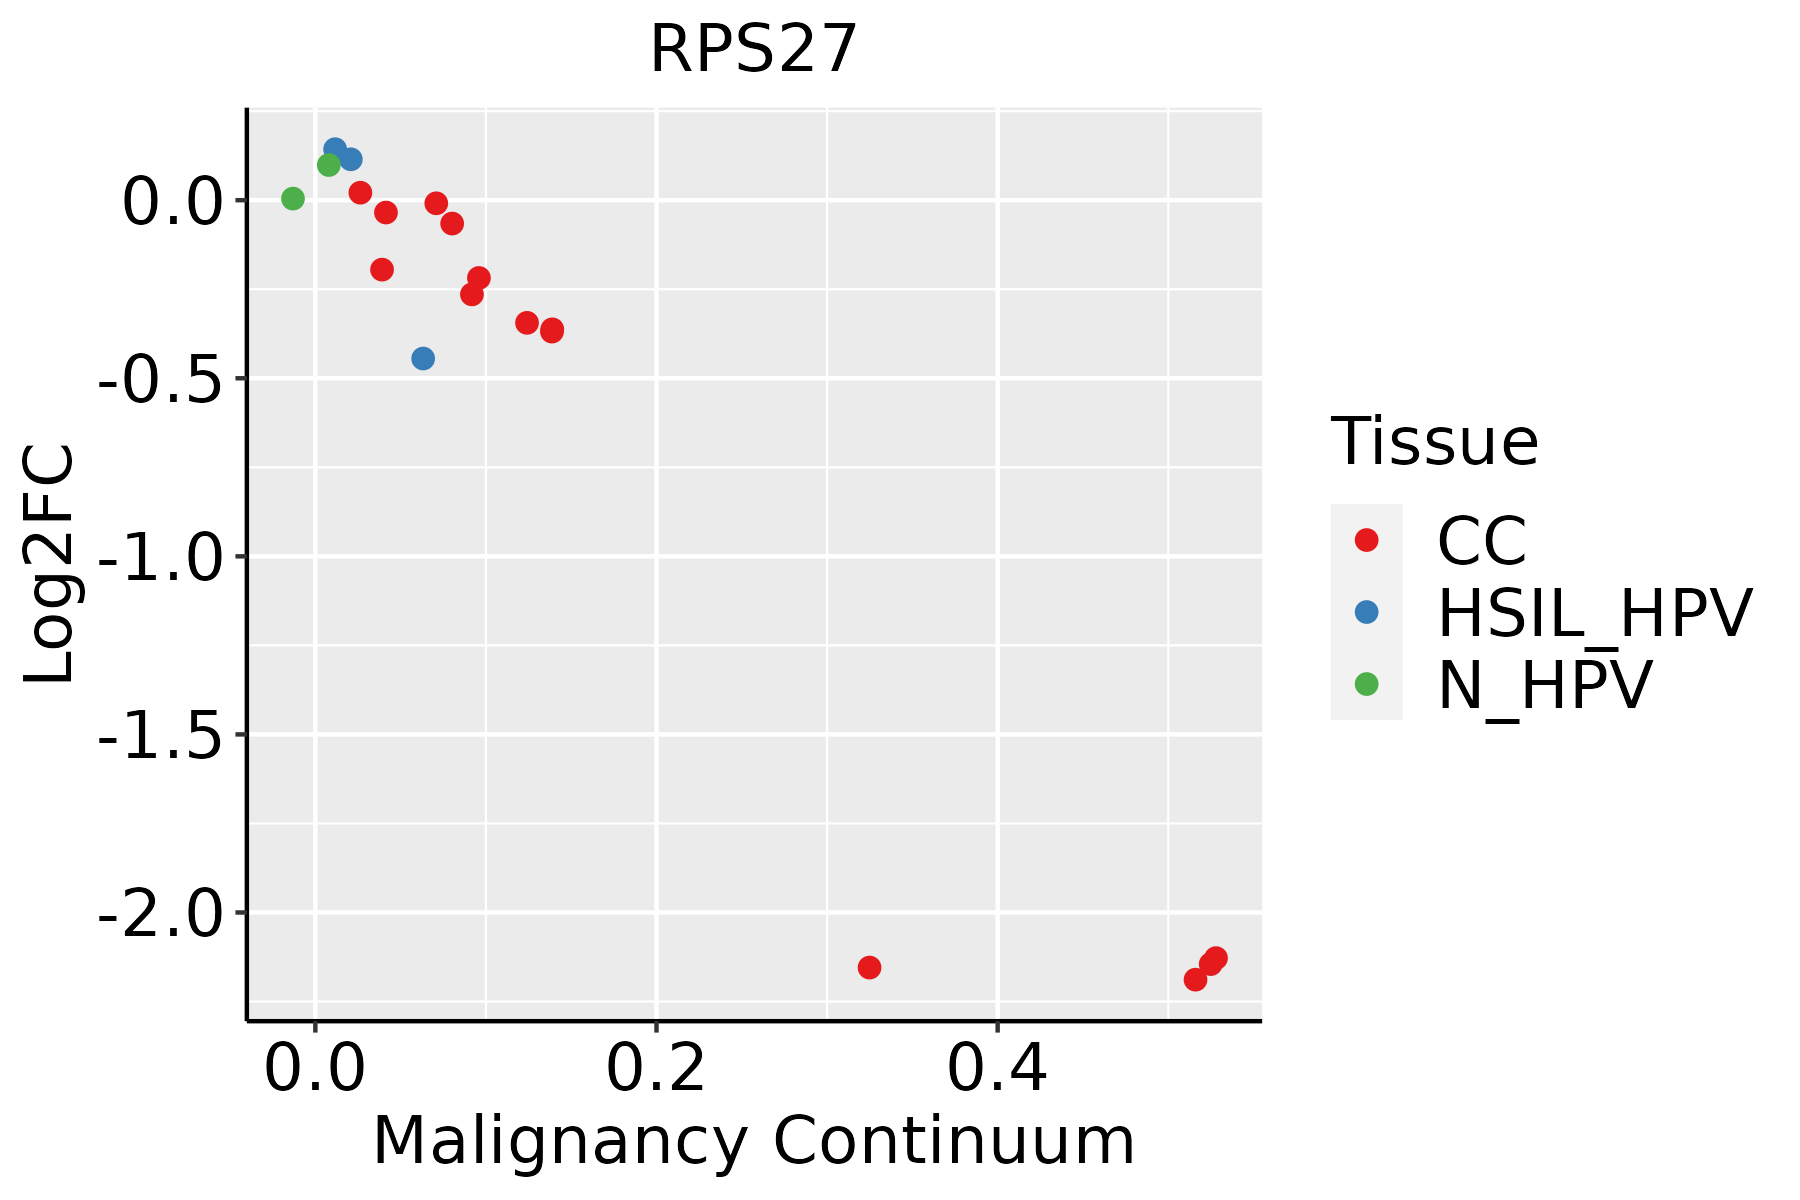 | CC: Cervix cancer |
| HSIL_HPV: HPV-infected high-grade squamous intraepithelial lesions | ||
| N_HPV: HPV-infected normal cervix | ||
| Colorectum (GSE201348) |  | FAP: Familial adenomatous polyposis |
| CRC: Colorectal cancer | ||
| Colorectum (HTA11) |  | AD: Adenomas |
| SER: Sessile serrated lesions | ||
| MSI-H: Microsatellite-high colorectal cancer | ||
| MSS: Microsatellite stable colorectal cancer | ||
| Endometrium | 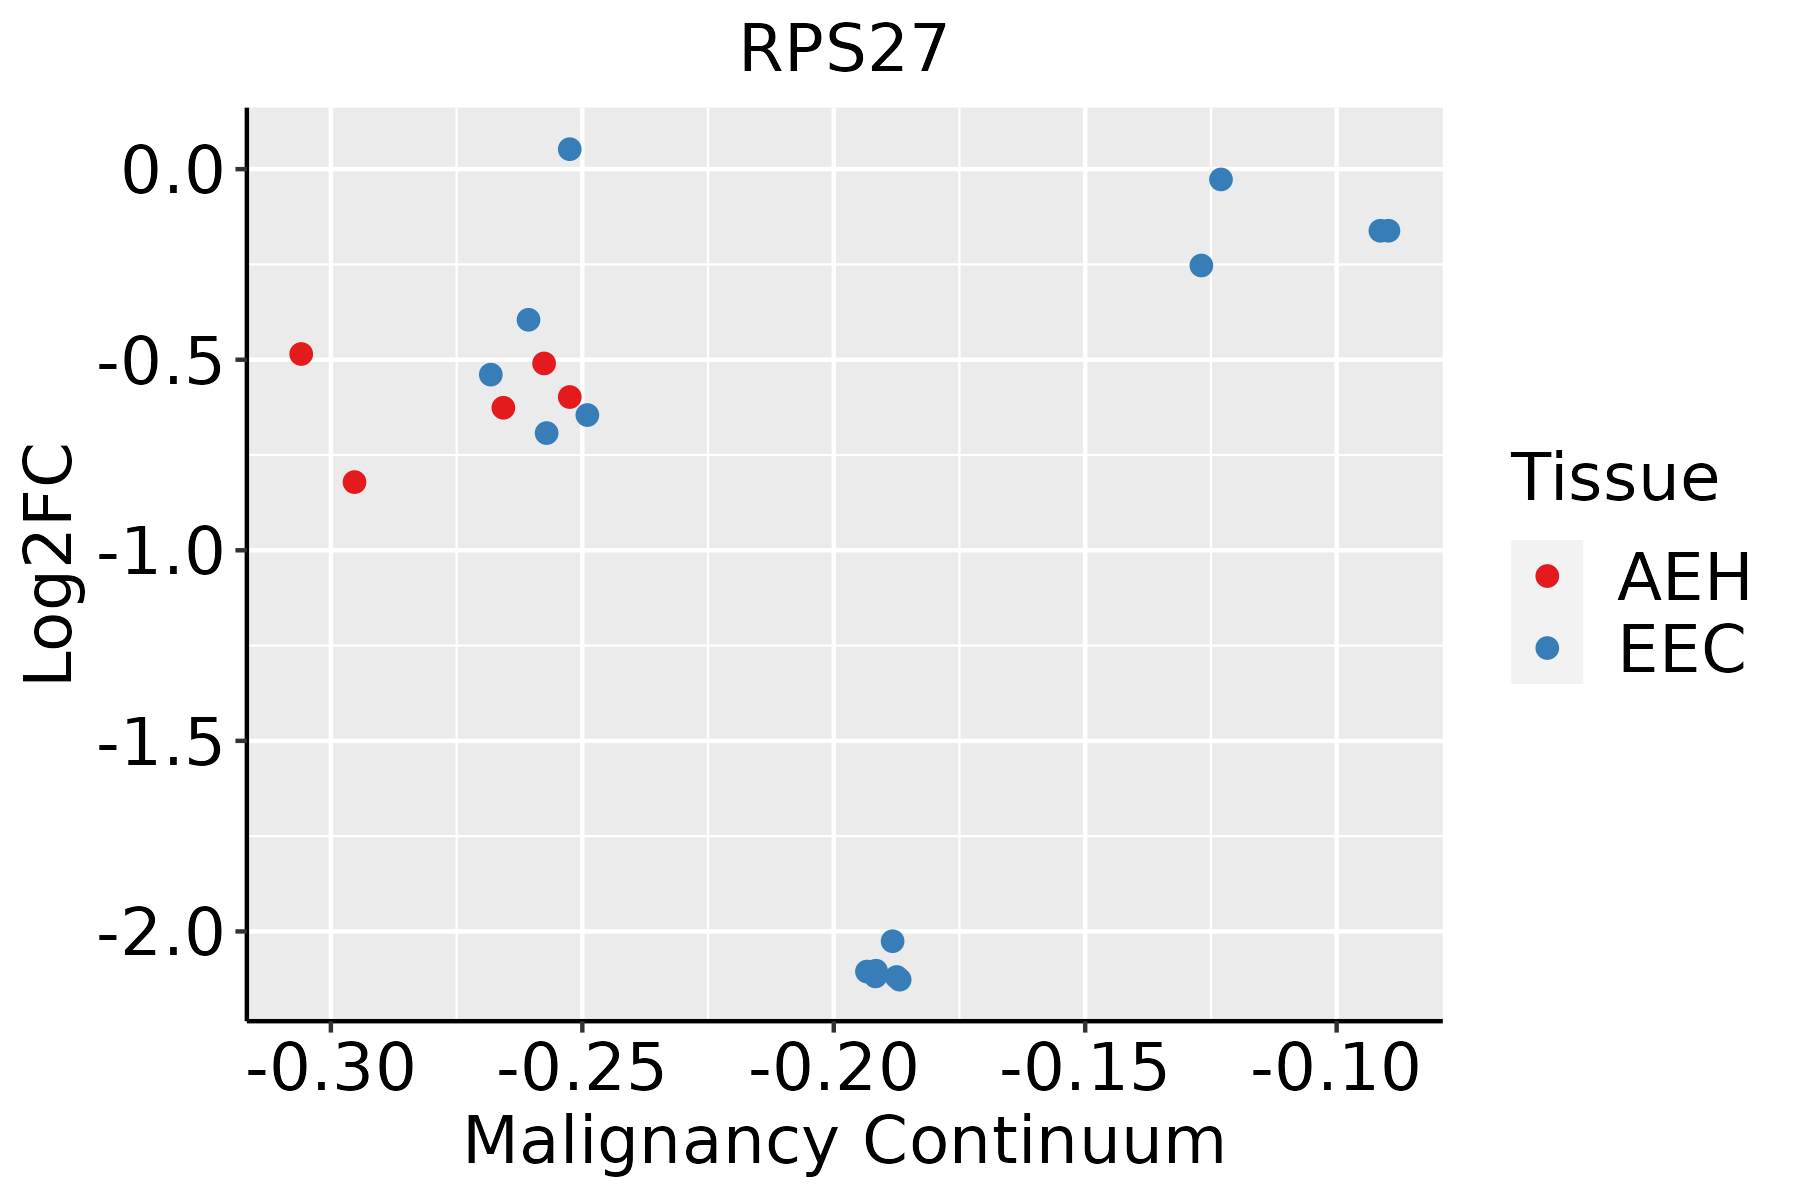 | AEH: Atypical endometrial hyperplasia |
| EEC: Endometrioid Cancer | ||
| Esophagus | 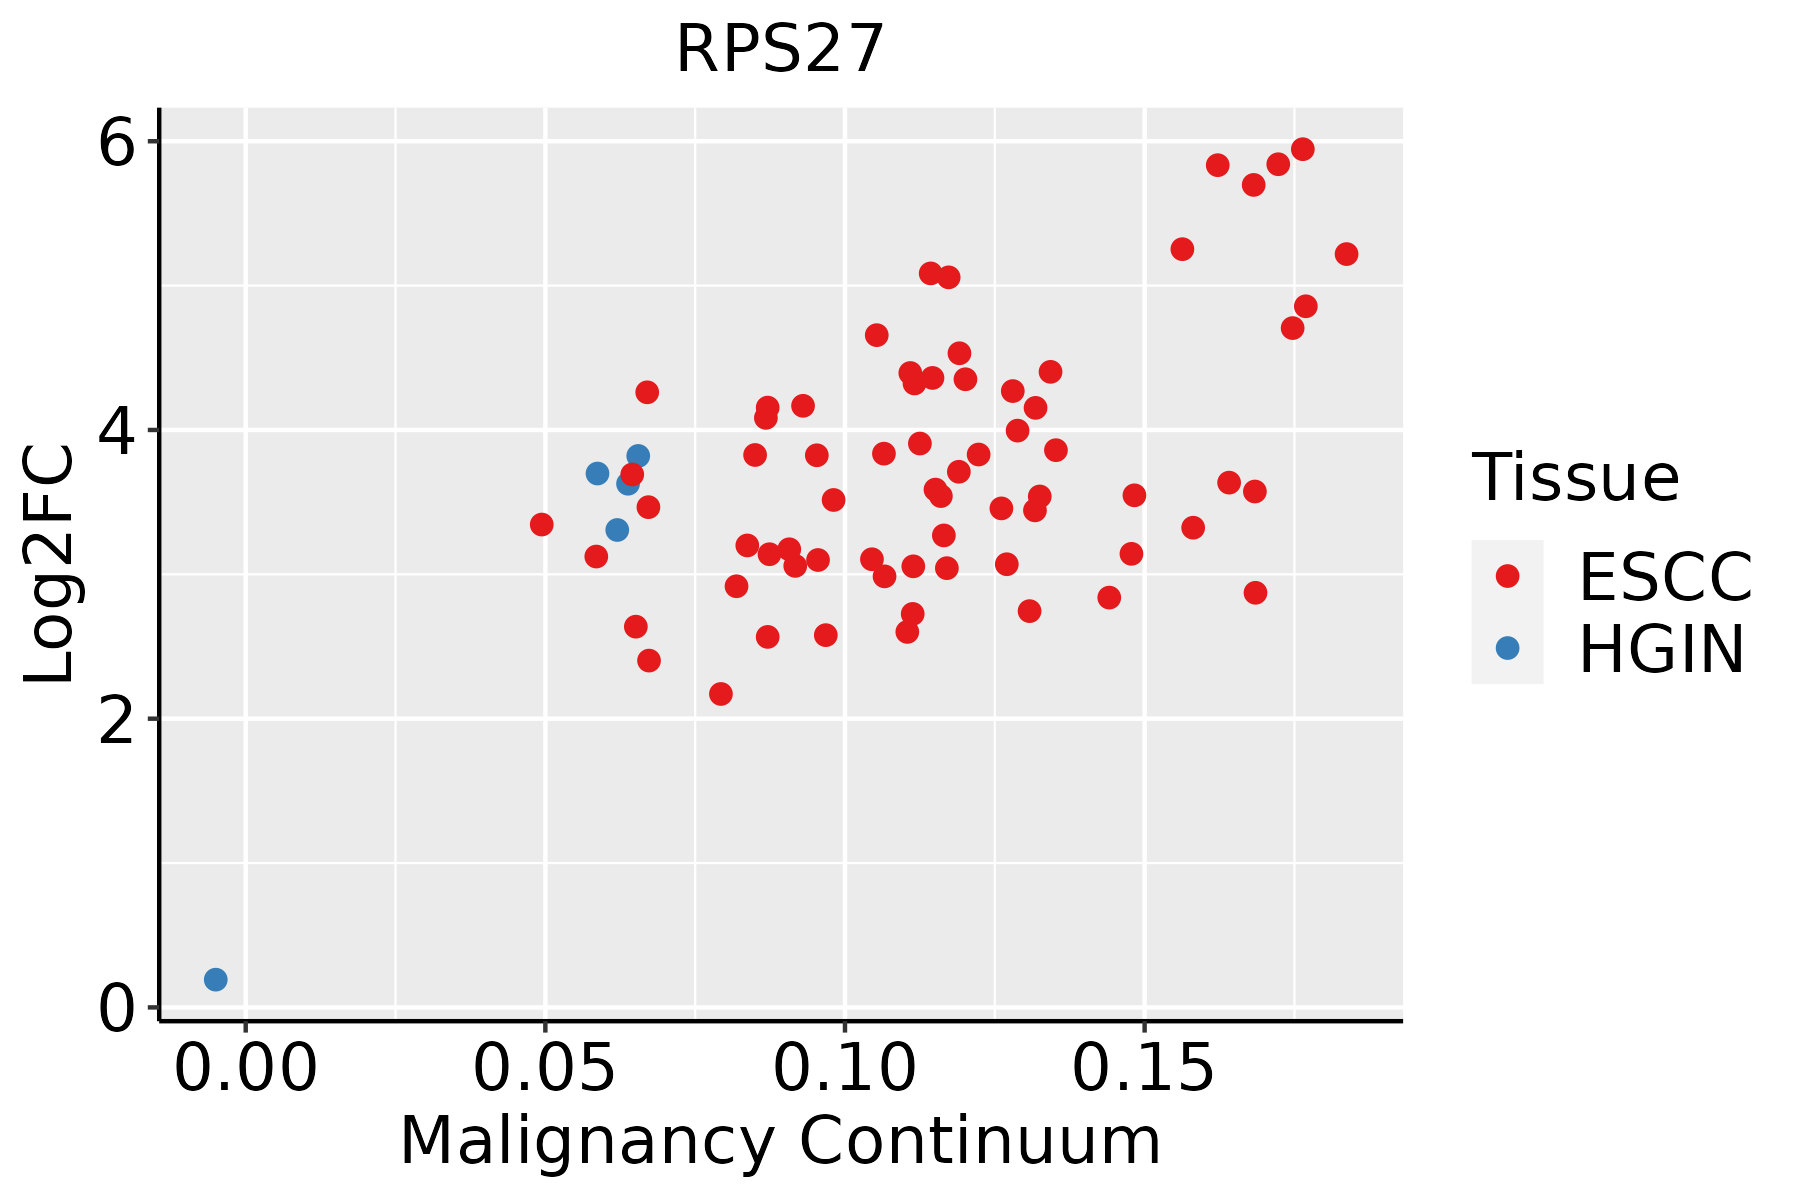 | ESCC: Esophageal squamous cell carcinoma |
| HGIN: High-grade intraepithelial neoplasias | ||
| LGIN: Low-grade intraepithelial neoplasias | ||
| GC | 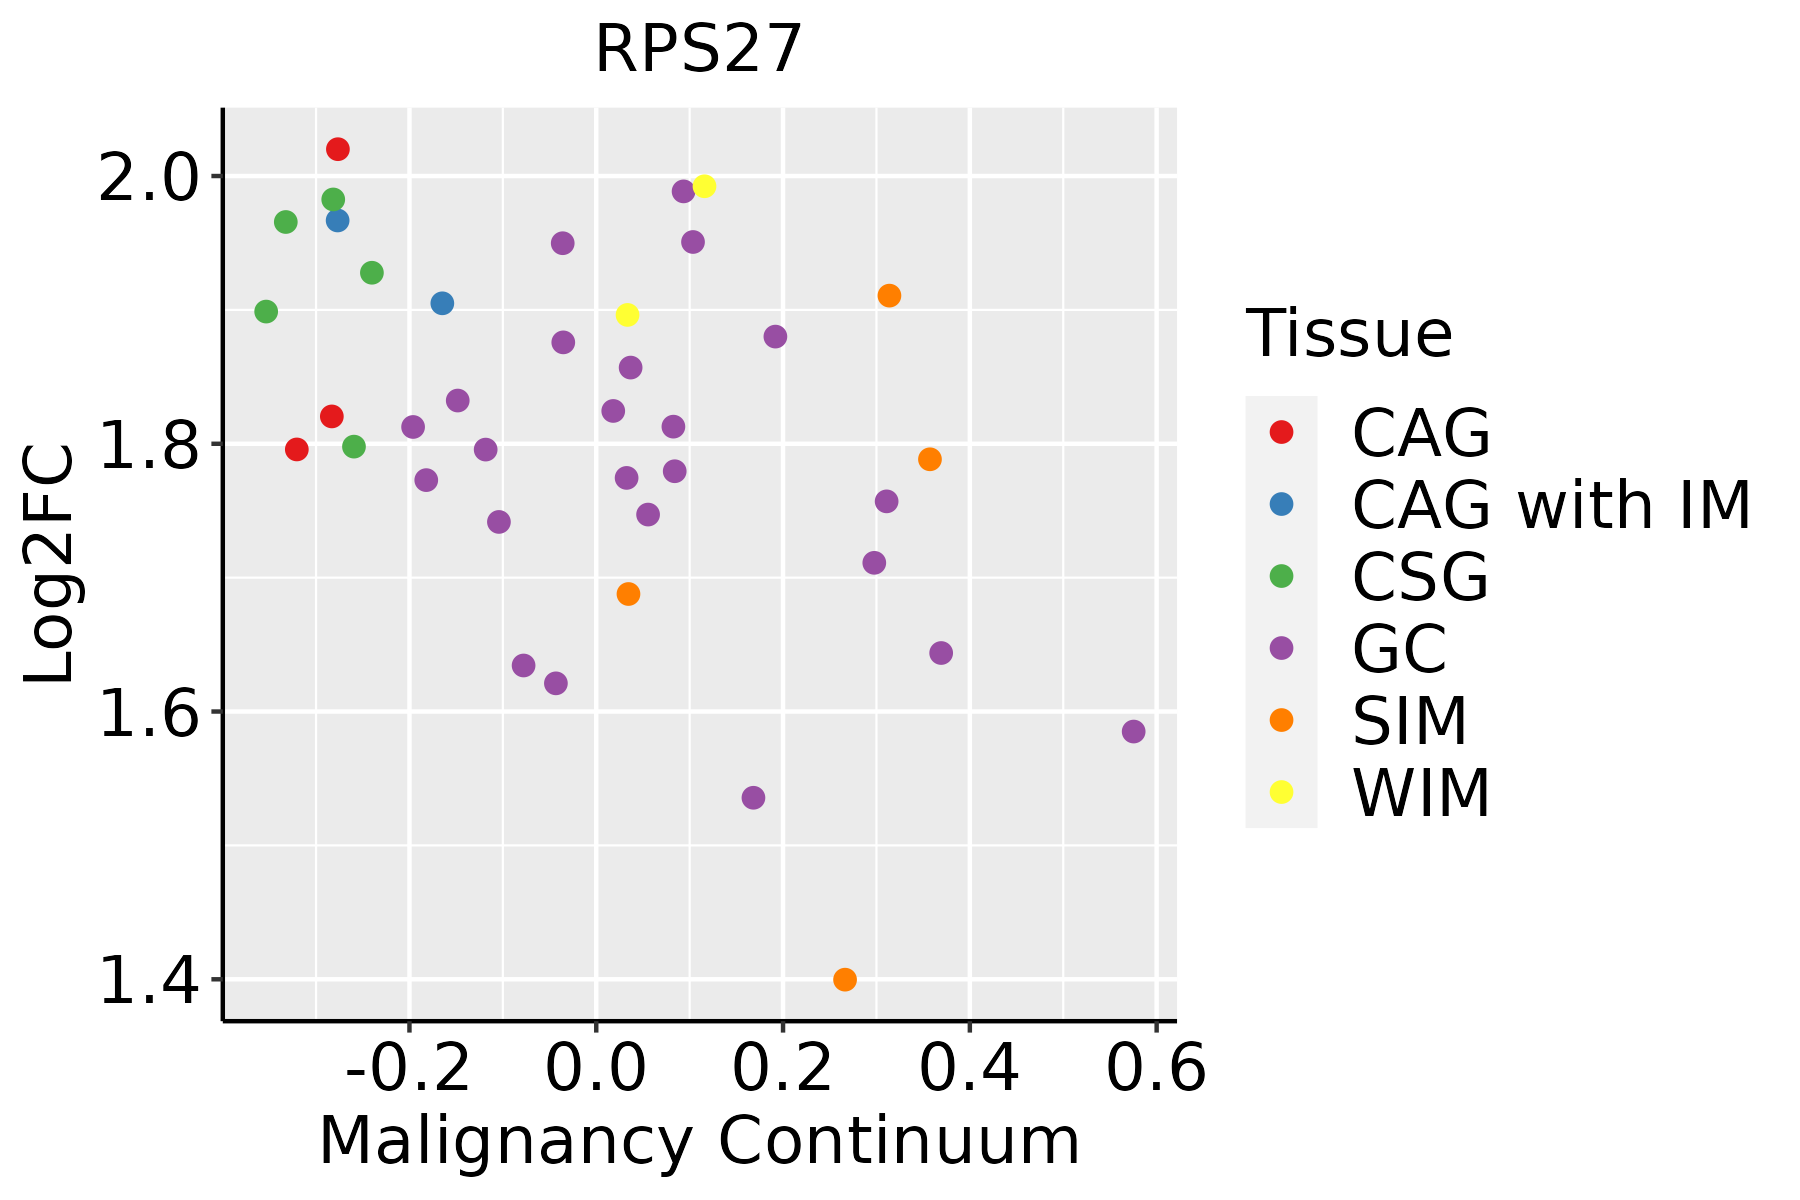 | CAG: Chronic atrophic gastritis |
| CAG with IM: Chronic atrophic gastritis with intestinal metaplasia | ||
| CSG: Chronic superficial gastritis | ||
| GC: Gastric cancer | ||
| SIM: Severe intestinal metaplasia | ||
| WIM: Wild intestinal metaplasia | ||
| Liver |  | HCC: Hepatocellular carcinoma |
| NAFLD: Non-alcoholic fatty liver disease | ||
| Lung | 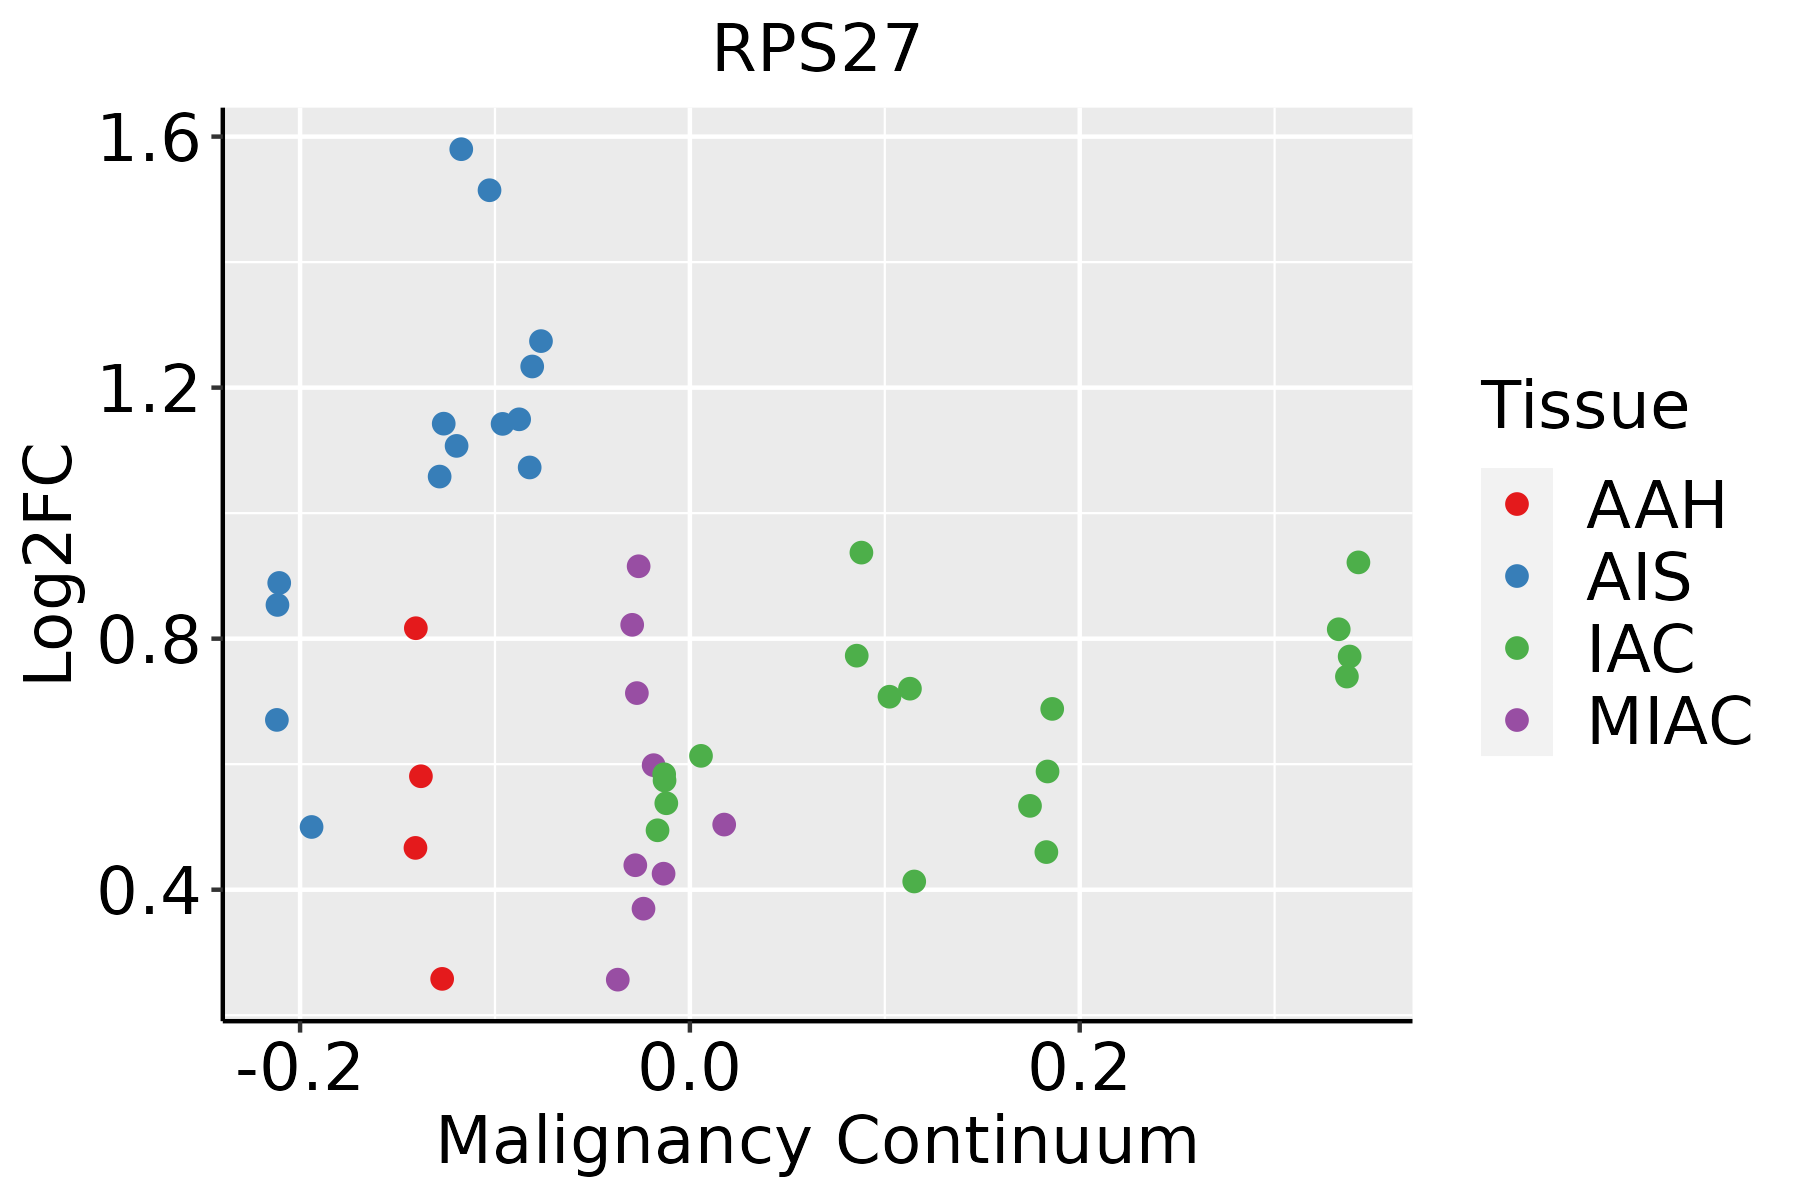 | AAH: Atypical adenomatous hyperplasia |
| AIS: Adenocarcinoma in situ | ||
| IAC: Invasive lung adenocarcinoma | ||
| MIA: Minimally invasive adenocarcinoma | ||
| Oral Cavity | 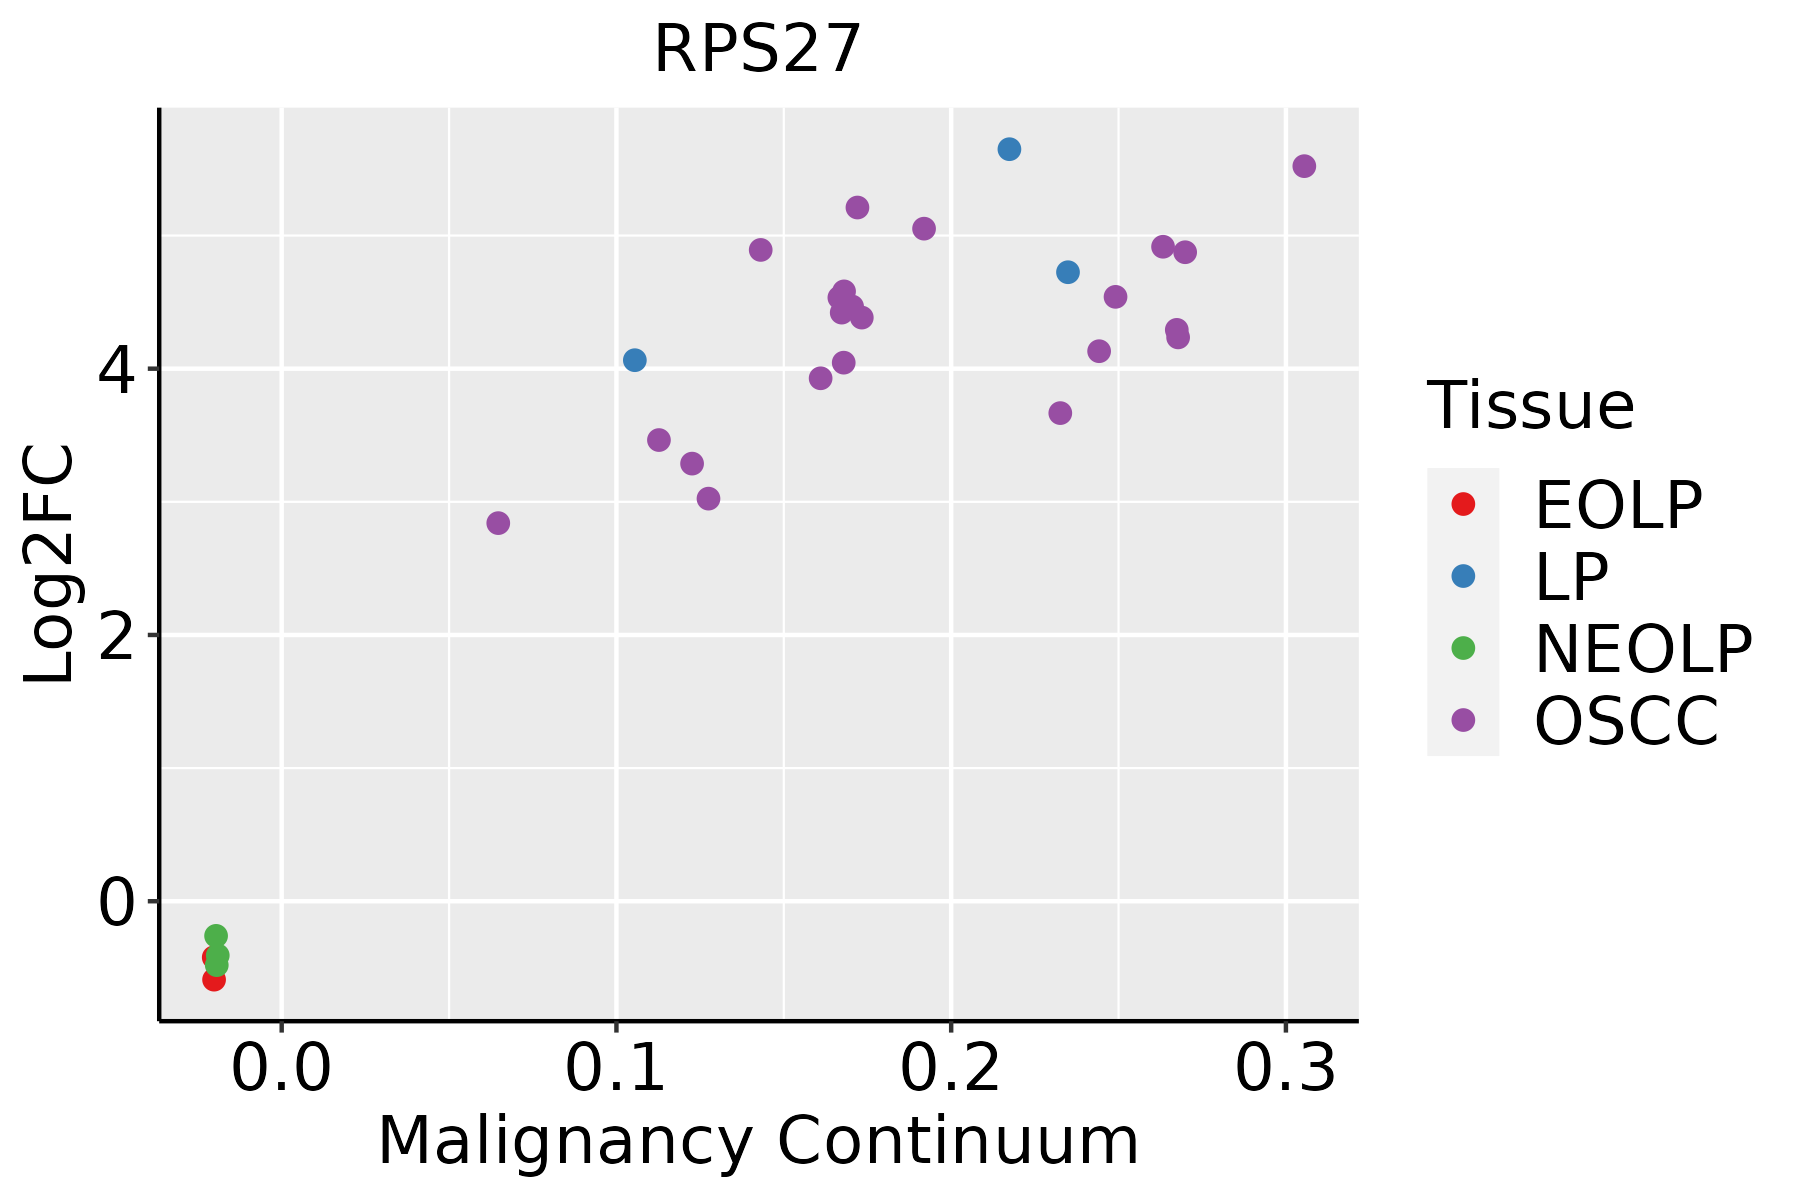 | EOLP: Erosive Oral lichen planus |
| LP: leukoplakia | ||
| NEOLP: Non-erosive oral lichen planus | ||
| OSCC: Oral squamous cell carcinoma | ||
| Prostate | 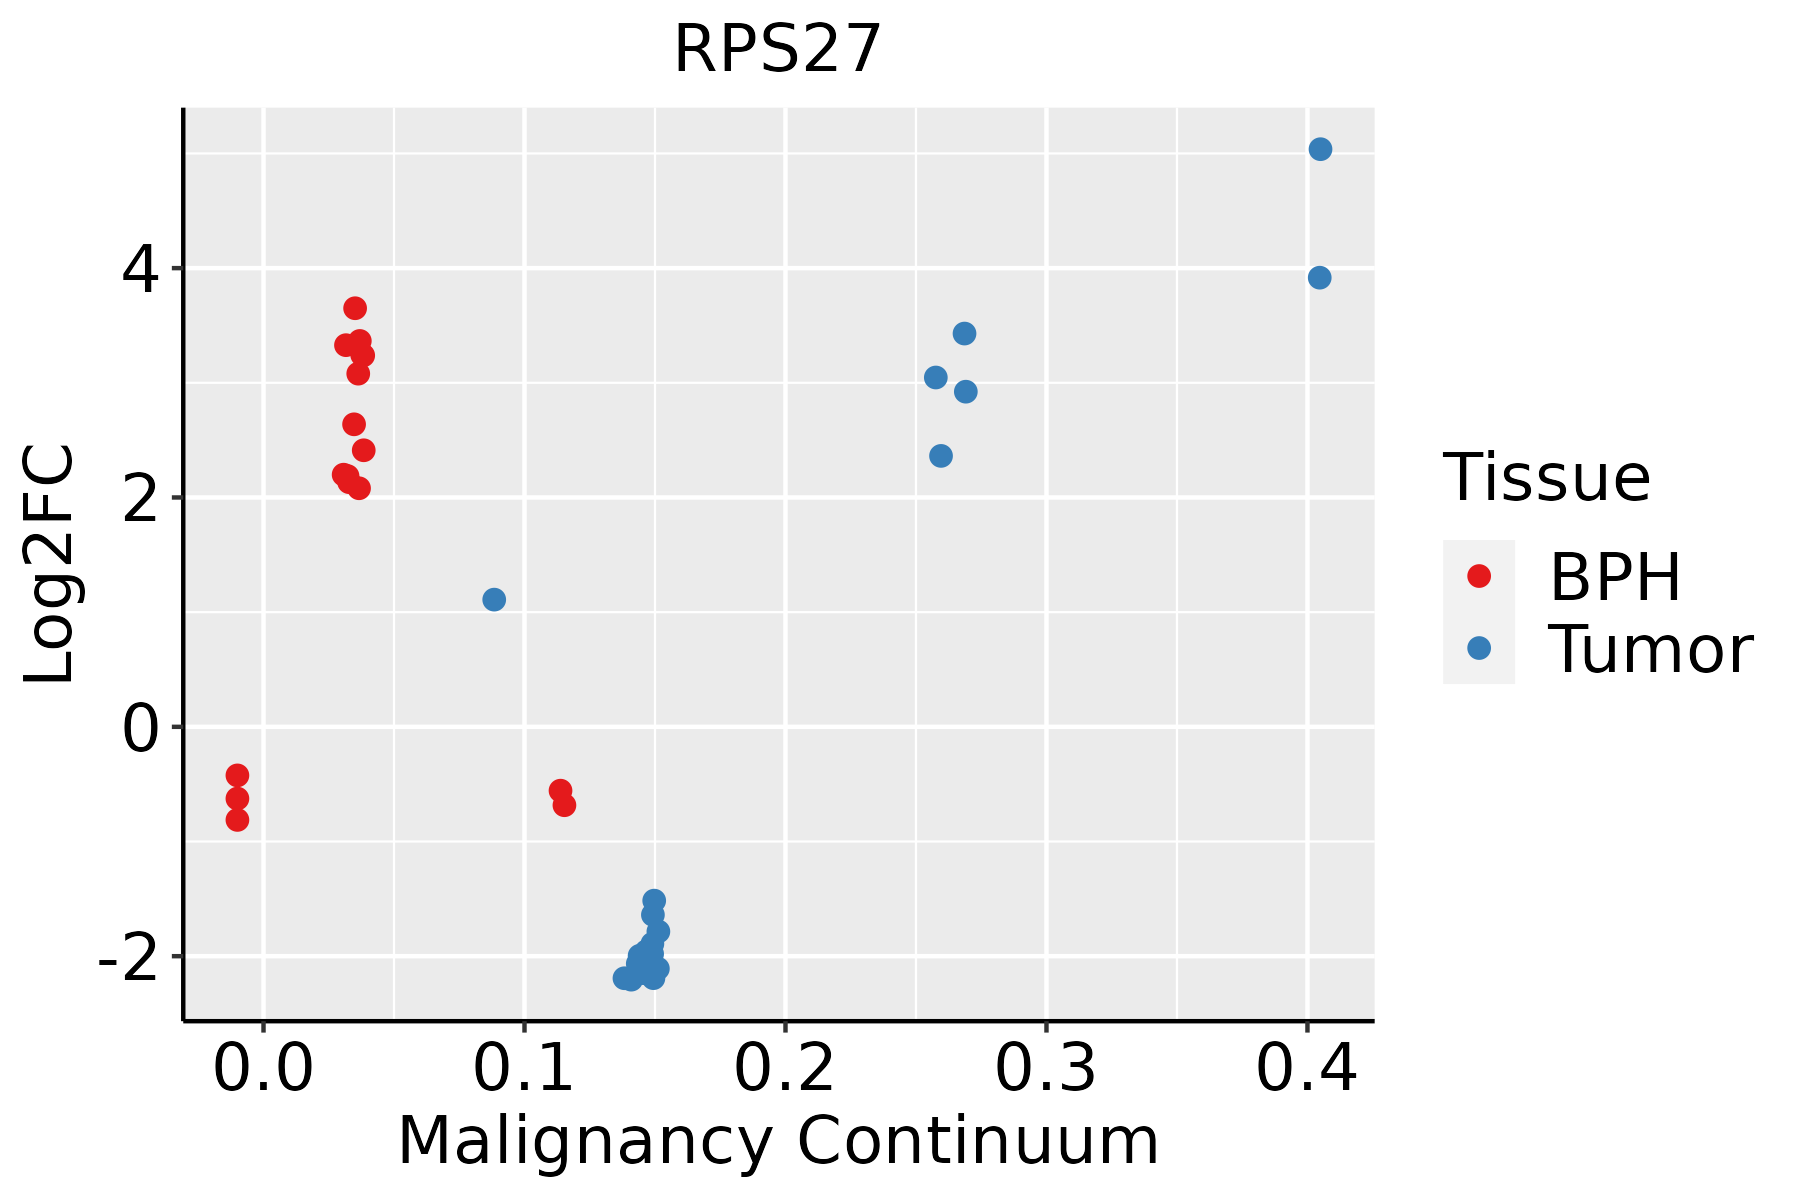 | BPH: Benign Prostatic Hyperplasia |
| Skin | 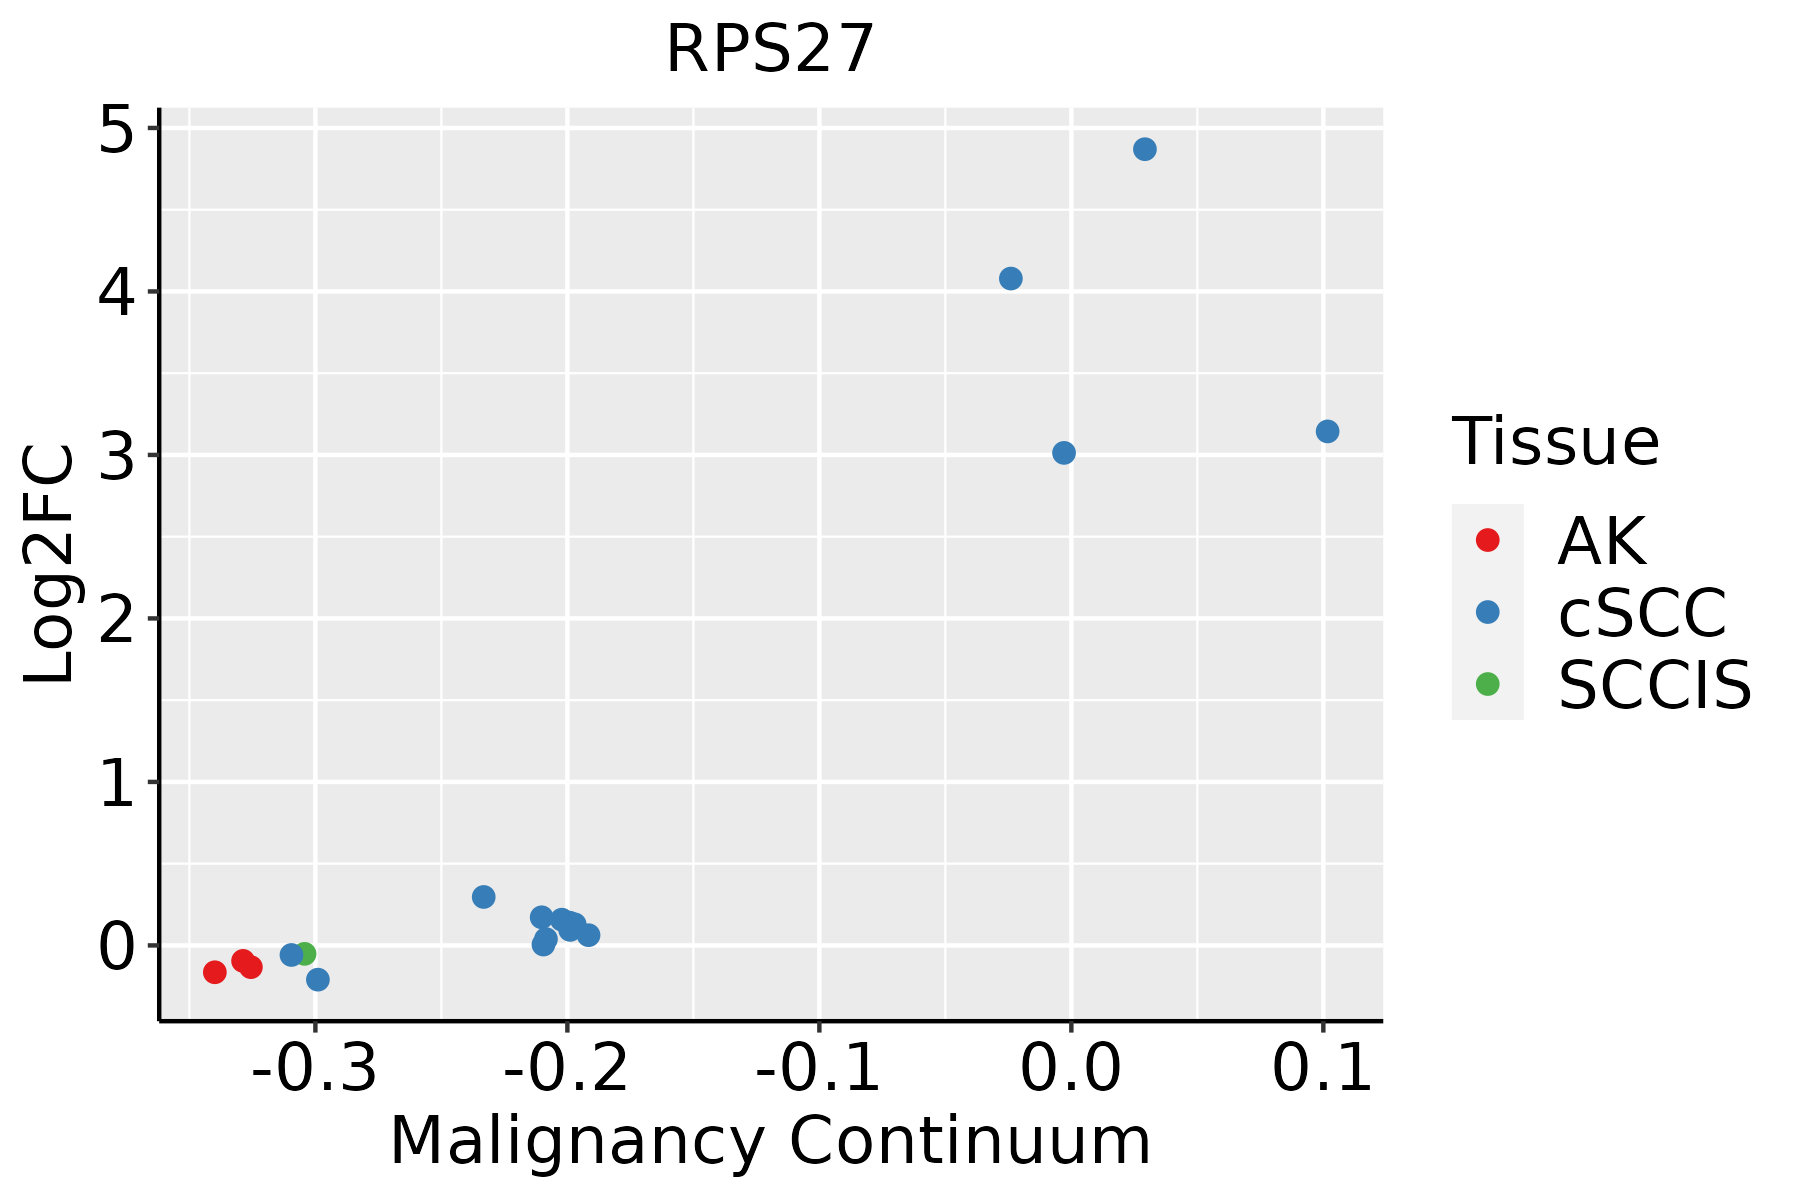 | AK: Actinic keratosis |
| cSCC: Cutaneous squamous cell carcinoma | ||
| SCCIS:squamous cell carcinoma in situ | ||
| Thyroid | 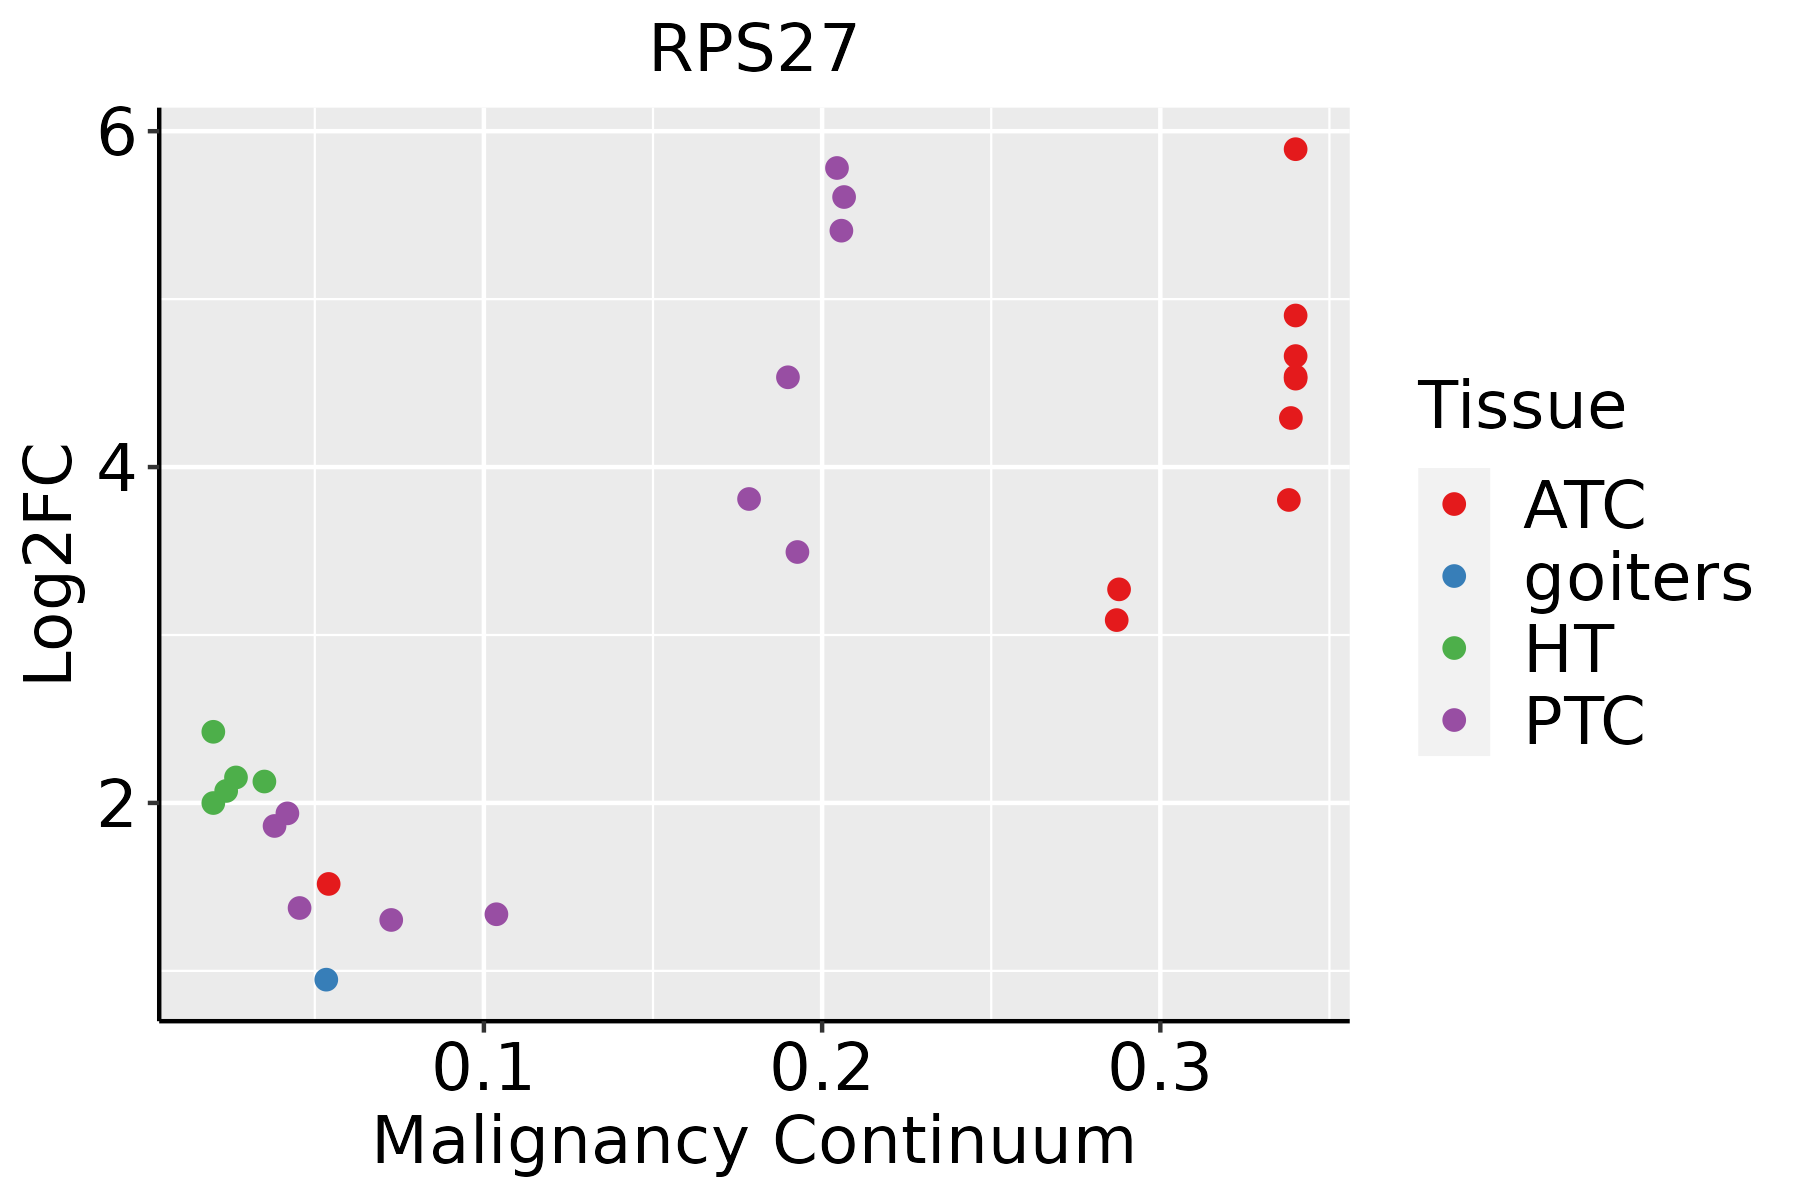 | ATC: Anaplastic thyroid cancer |
| HT: Hashimoto's thyroiditis | ||
| PTC: Papillary thyroid cancer |
| ∗log2FC in expression of this searched gene in stem-like cells from each diseased tissue sample relative to stem-like cells in normal samples in each tissue plotted against the malignancy continuum. Samples are colored based on if they are from different disease stage. |
Top |
Malignant transformation related pathway analysis |
| Find out the enriched GO biological processes and KEGG pathways involved in transition from healthy to precancer to cancer |
| Tissue | Disease Stage | Enriched GO biological Processes |
| Colorectum | AD |  |
| Colorectum | SER |  |
| Colorectum | MSS |  |
| Colorectum | MSI-H |  |
| Colorectum | FAP |  |
| ∗Top 15 enriched GO BP terms are showed in the bar plot of each disease state in each tissue. Each row represents a significant GO biological process which is colored according to the -log10(p.adjust). |
| Page: 1 2 3 4 5 6 7 8 9 |
| GO ID | Tissue | Disease Stage | Description | Gene Ratio | Bg Ratio | pvalue | p.adjust | Count |
| GO:0008630112 | Thyroid | PTC | intrinsic apoptotic signaling pathway in response to DNA damage | 54/5968 | 99/18723 | 2.46e-06 | 3.22e-05 | 54 |
| GO:19019878 | Thyroid | PTC | regulation of cell cycle phase transition | 167/5968 | 390/18723 | 2.97e-06 | 3.87e-05 | 167 |
| GO:2000116113 | Thyroid | PTC | regulation of cysteine-type endopeptidase activity | 108/5968 | 235/18723 | 3.99e-06 | 4.99e-05 | 108 |
| GO:0052547113 | Thyroid | PTC | regulation of peptidase activity | 191/5968 | 461/18723 | 7.82e-06 | 9.02e-05 | 191 |
| GO:004277010 | Thyroid | PTC | signal transduction in response to DNA damage | 81/5968 | 172/18723 | 2.07e-05 | 2.08e-04 | 81 |
| GO:00459307 | Thyroid | PTC | negative regulation of mitotic cell cycle | 105/5968 | 235/18723 | 2.41e-05 | 2.39e-04 | 105 |
| GO:19019917 | Thyroid | PTC | negative regulation of mitotic cell cycle phase transition | 83/5968 | 179/18723 | 3.34e-05 | 3.17e-04 | 83 |
| GO:0052548113 | Thyroid | PTC | regulation of endopeptidase activity | 174/5968 | 432/18723 | 1.20e-04 | 9.55e-04 | 174 |
| GO:0030330112 | Thyroid | PTC | DNA damage response, signal transduction by p53 class mediator | 38/5968 | 72/18723 | 1.85e-04 | 1.40e-03 | 38 |
| GO:200004515 | Thyroid | PTC | regulation of G1/S transition of mitotic cell cycle | 66/5968 | 142/18723 | 1.86e-04 | 1.41e-03 | 66 |
| GO:19028067 | Thyroid | PTC | regulation of cell cycle G1/S phase transition | 76/5968 | 168/18723 | 1.87e-04 | 1.41e-03 | 76 |
| GO:0010950113 | Thyroid | PTC | positive regulation of endopeptidase activity | 80/5968 | 179/18723 | 2.09e-04 | 1.55e-03 | 80 |
| GO:0000028113 | Thyroid | PTC | ribosomal small subunit assembly | 14/5968 | 19/18723 | 2.23e-04 | 1.63e-03 | 14 |
| GO:00109486 | Thyroid | PTC | negative regulation of cell cycle process | 122/5968 | 294/18723 | 2.94e-04 | 2.08e-03 | 122 |
| GO:19019885 | Thyroid | PTC | negative regulation of cell cycle phase transition | 104/5968 | 249/18723 | 6.01e-04 | 3.82e-03 | 104 |
| GO:00427723 | Thyroid | PTC | DNA damage response, signal transduction resulting in transcription | 12/5968 | 17/18723 | 1.20e-03 | 6.89e-03 | 12 |
| GO:00070936 | Thyroid | PTC | mitotic cell cycle checkpoint | 58/5968 | 129/18723 | 1.22e-03 | 6.97e-03 | 58 |
| GO:0043280112 | Thyroid | PTC | positive regulation of cysteine-type endopeptidase activity involved in apoptotic process | 58/5968 | 129/18723 | 1.22e-03 | 6.97e-03 | 58 |
| GO:00000756 | Thyroid | PTC | cell cycle checkpoint | 72/5968 | 169/18723 | 2.09e-03 | 1.11e-02 | 72 |
| GO:2001056111 | Thyroid | PTC | positive regulation of cysteine-type endopeptidase activity | 64/5968 | 148/18723 | 2.33e-03 | 1.23e-02 | 64 |
| Page: 1 2 3 4 5 6 7 8 9 10 11 12 13 14 15 16 17 18 19 20 21 22 23 24 25 26 27 28 29 30 31 32 33 34 35 36 37 38 39 40 41 42 43 44 45 46 47 48 49 50 51 52 53 54 55 56 57 58 59 60 61 62 63 64 65 66 67 |
| Pathway ID | Tissue | Disease Stage | Description | Gene Ratio | Bg Ratio | pvalue | p.adjust | qvalue | Count |
| hsa0517120 | Cervix | CC | Coronavirus disease - COVID-19 | 111/1267 | 232/8465 | 1.82e-33 | 5.90e-31 | 3.49e-31 | 111 |
| hsa0301020 | Cervix | CC | Ribosome | 85/1267 | 167/8465 | 3.17e-28 | 5.14e-26 | 3.04e-26 | 85 |
| hsa05171110 | Cervix | CC | Coronavirus disease - COVID-19 | 111/1267 | 232/8465 | 1.82e-33 | 5.90e-31 | 3.49e-31 | 111 |
| hsa03010110 | Cervix | CC | Ribosome | 85/1267 | 167/8465 | 3.17e-28 | 5.14e-26 | 3.04e-26 | 85 |
| hsa0301025 | Cervix | HSIL_HPV | Ribosome | 80/459 | 167/8465 | 9.61e-58 | 2.82e-55 | 2.28e-55 | 80 |
| hsa0517125 | Cervix | HSIL_HPV | Coronavirus disease - COVID-19 | 91/459 | 232/8465 | 2.14e-56 | 3.13e-54 | 2.53e-54 | 91 |
| hsa0301035 | Cervix | HSIL_HPV | Ribosome | 80/459 | 167/8465 | 9.61e-58 | 2.82e-55 | 2.28e-55 | 80 |
| hsa0517135 | Cervix | HSIL_HPV | Coronavirus disease - COVID-19 | 91/459 | 232/8465 | 2.14e-56 | 3.13e-54 | 2.53e-54 | 91 |
| hsa0517145 | Cervix | N_HPV | Coronavirus disease - COVID-19 | 47/349 | 232/8465 | 1.79e-20 | 4.86e-18 | 3.80e-18 | 47 |
| hsa0301045 | Cervix | N_HPV | Ribosome | 39/349 | 167/8465 | 2.05e-19 | 2.79e-17 | 2.18e-17 | 39 |
| hsa0517155 | Cervix | N_HPV | Coronavirus disease - COVID-19 | 47/349 | 232/8465 | 1.79e-20 | 4.86e-18 | 3.80e-18 | 47 |
| hsa0301055 | Cervix | N_HPV | Ribosome | 39/349 | 167/8465 | 2.05e-19 | 2.79e-17 | 2.18e-17 | 39 |
| hsa03010 | Colorectum | AD | Ribosome | 96/2092 | 167/8465 | 8.28e-20 | 5.54e-18 | 3.54e-18 | 96 |
| hsa05171 | Colorectum | AD | Coronavirus disease - COVID-19 | 113/2092 | 232/8465 | 9.90e-16 | 2.55e-14 | 1.63e-14 | 113 |
| hsa030101 | Colorectum | AD | Ribosome | 96/2092 | 167/8465 | 8.28e-20 | 5.54e-18 | 3.54e-18 | 96 |
| hsa051711 | Colorectum | AD | Coronavirus disease - COVID-19 | 113/2092 | 232/8465 | 9.90e-16 | 2.55e-14 | 1.63e-14 | 113 |
| hsa030102 | Colorectum | SER | Ribosome | 92/1580 | 167/8465 | 2.21e-26 | 3.66e-24 | 2.66e-24 | 92 |
| hsa051712 | Colorectum | SER | Coronavirus disease - COVID-19 | 98/1580 | 232/8465 | 3.33e-17 | 8.50e-16 | 6.17e-16 | 98 |
| hsa030103 | Colorectum | SER | Ribosome | 92/1580 | 167/8465 | 2.21e-26 | 3.66e-24 | 2.66e-24 | 92 |
| hsa051713 | Colorectum | SER | Coronavirus disease - COVID-19 | 98/1580 | 232/8465 | 3.33e-17 | 8.50e-16 | 6.17e-16 | 98 |
| Page: 1 2 3 4 5 6 7 |
Top |
Cell-cell communication analysis |
| Identification of potential cell-cell interactions between two cell types and their ligand-receptor pairs for different disease states |
| Ligand | Receptor | LRpair | Pathway | Tissue | Disease Stage |
| Page: 1 |
Top |
Single-cell gene regulatory network inference analysis |
| Find out the significant the regulons (TFs) and the target genes of each regulon across cell types for different disease states |
| TF | Cell Type | Tissue | Disease Stage | Target Gene | RSS | Regulon Activity |
| ∗The dot plots of a searched regulon are shown for all cell subpopulations in each disease state of each tissue based on the regulon specific score inferred using pySCENIC and by calculating the average expression. |
| Page: 1 |
Top |
Somatic mutation of malignant transformation related genes |
| Annotation of somatic variants for genes involved in malignant transformation |
| Hugo Symbol | Variant Class | Variant Classification | dbSNP RS | HGVSc | HGVSp | HGVSp Short | SWISSPROT | BIOTYPE | SIFT | PolyPhen | Tumor Sample Barcode | Tissue | Histology | Sex | Age | Stage | Therapy Types | Drugs | Outcome |
| RPS27 | SNV | Missense_Mutation | c.233N>T | p.Ser78Phe | p.S78F | P42677 | protein_coding | deleterious(0.01) | benign(0.25) | TCGA-EI-6917-01 | Colorectum | rectum adenocarcinoma | Male | <65 | III/IV | Chemotherapy | 5fluorouracil+oxaciplatina+l-folinian | SD | |
| RPS27 | SNV | Missense_Mutation | novel | c.16G>A | p.Asp6Asn | p.D6N | P42677 | protein_coding | deleterious(0.03) | benign(0.015) | TCGA-DD-AACF-01 | Liver | liver hepatocellular carcinoma | Male | >=65 | I/II | Unknown | Unknown | PD |
| RPS27 | SNV | Missense_Mutation | c.32C>T | p.Ser11Phe | p.S11F | P42677 | protein_coding | deleterious(0.03) | benign(0.044) | TCGA-55-6985-01 | Lung | lung adenocarcinoma | Female | <65 | I/II | Unknown | Unknown | SD | |
| RPS27 | SNV | Missense_Mutation | c.94N>G | p.Phe32Val | p.F32V | P42677 | protein_coding | deleterious(0.02) | possibly_damaging(0.687) | TCGA-BR-8680-01 | Stomach | stomach adenocarcinoma | Male | <65 | III/IV | Chemotherapy | oxaliplatin | CR |
| Page: 1 |
Top |
Related drugs of malignant transformation related genes |
| Identification of chemicals and drugs interact with genes involved in malignant transfromation |
| (DGIdb 4.0) |
| Entrez ID | Symbol | Category | Interaction Types | Drug Claim Name | Drug Name | PMIDs |
| Page: 1 |

Copyright 2023-Present -The University of Texas Health Science Center at Houston |