
|
|||||
|
 | |
| |
| |
| |
| |
| |
|
Gene: NPM1 |
Gene summary for NPM1 |
| Gene information | Species | Human | Gene symbol | NPM1 | Gene ID | 4869 |
| Gene name | nucleophosmin 1 | |
| Gene Alias | B23 | |
| Cytomap | 5q35.1 | |
| Gene Type | protein-coding | GO ID | GO:0000054 | UniProtAcc | A0A140VJQ2 |
Top |
Malignant transformation analysis |
| Identification of the aberrant gene expression in precancerous and cancerous lesions by comparing the gene expression of stem-like cells in diseased tissues with normal stem cells |
| Entrez ID | Symbol | Replicates | Species | Organ | Tissue | Adj P-value | Log2FC | Malignancy |
| 4869 | NPM1 | GSM4909281 | Human | Breast | IDC | 7.77e-05 | -1.82e-01 | 0.21 |
| 4869 | NPM1 | GSM4909282 | Human | Breast | IDC | 2.93e-05 | -1.80e-01 | -0.0288 |
| 4869 | NPM1 | GSM4909285 | Human | Breast | IDC | 7.39e-03 | 2.13e-01 | 0.21 |
| 4869 | NPM1 | GSM4909286 | Human | Breast | IDC | 3.15e-34 | -3.24e-01 | 0.1081 |
| 4869 | NPM1 | GSM4909290 | Human | Breast | IDC | 1.20e-19 | -5.92e-01 | 0.2096 |
| 4869 | NPM1 | GSM4909291 | Human | Breast | IDC | 9.11e-10 | -4.49e-01 | 0.1753 |
| 4869 | NPM1 | GSM4909293 | Human | Breast | IDC | 1.38e-09 | -1.37e-01 | 0.1581 |
| 4869 | NPM1 | GSM4909294 | Human | Breast | IDC | 3.38e-02 | -1.17e-01 | 0.2022 |
| 4869 | NPM1 | GSM4909296 | Human | Breast | IDC | 5.23e-15 | -4.93e-01 | 0.1524 |
| 4869 | NPM1 | GSM4909297 | Human | Breast | IDC | 2.14e-19 | -2.67e-01 | 0.1517 |
| 4869 | NPM1 | GSM4909301 | Human | Breast | IDC | 3.24e-59 | -9.58e-01 | 0.1577 |
| 4869 | NPM1 | GSM4909302 | Human | Breast | IDC | 1.01e-07 | -4.02e-01 | 0.1545 |
| 4869 | NPM1 | GSM4909304 | Human | Breast | IDC | 1.13e-37 | -5.14e-01 | 0.1636 |
| 4869 | NPM1 | GSM4909306 | Human | Breast | IDC | 2.81e-11 | -3.04e-01 | 0.1564 |
| 4869 | NPM1 | GSM4909307 | Human | Breast | IDC | 1.92e-09 | -3.35e-01 | 0.1569 |
| 4869 | NPM1 | GSM4909309 | Human | Breast | IDC | 3.82e-08 | -4.35e-01 | 0.0483 |
| 4869 | NPM1 | GSM4909311 | Human | Breast | IDC | 5.83e-55 | -7.31e-01 | 0.1534 |
| 4869 | NPM1 | GSM4909315 | Human | Breast | IDC | 6.29e-08 | -2.89e-01 | 0.21 |
| 4869 | NPM1 | GSM4909319 | Human | Breast | IDC | 5.20e-77 | -9.68e-01 | 0.1563 |
| 4869 | NPM1 | GSM4909320 | Human | Breast | IDC | 5.80e-26 | -1.10e+00 | 0.1575 |
| Page: 1 2 3 4 5 6 7 8 9 10 11 12 13 14 15 16 17 18 |
| Tissue | Expression Dynamics | Abbreviation |
| Breast | 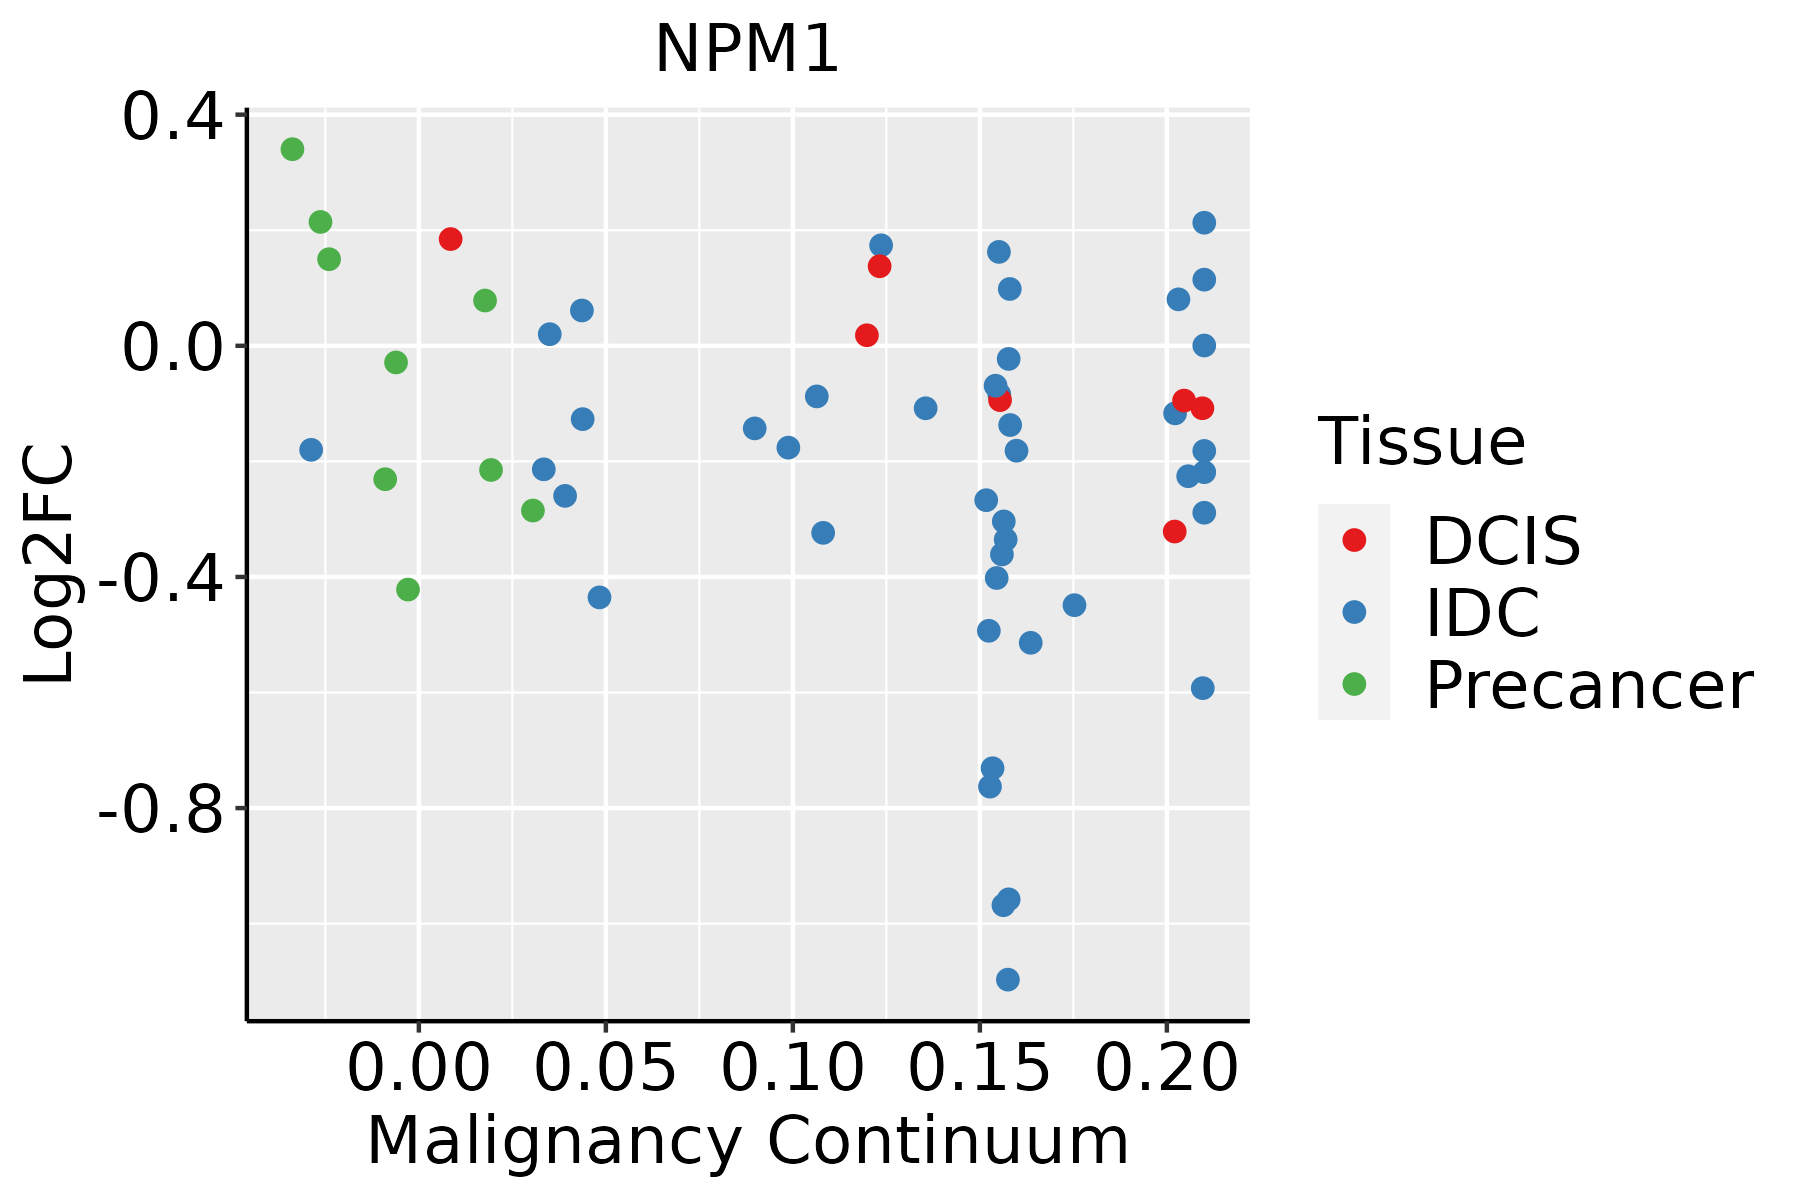 | IDC: Invasive ductal carcinoma |
| DCIS: Ductal carcinoma in situ | ||
| Precancer(BRCA1-mut): Precancerous lesion from BRCA1 mutation carriers | ||
| Cervix | 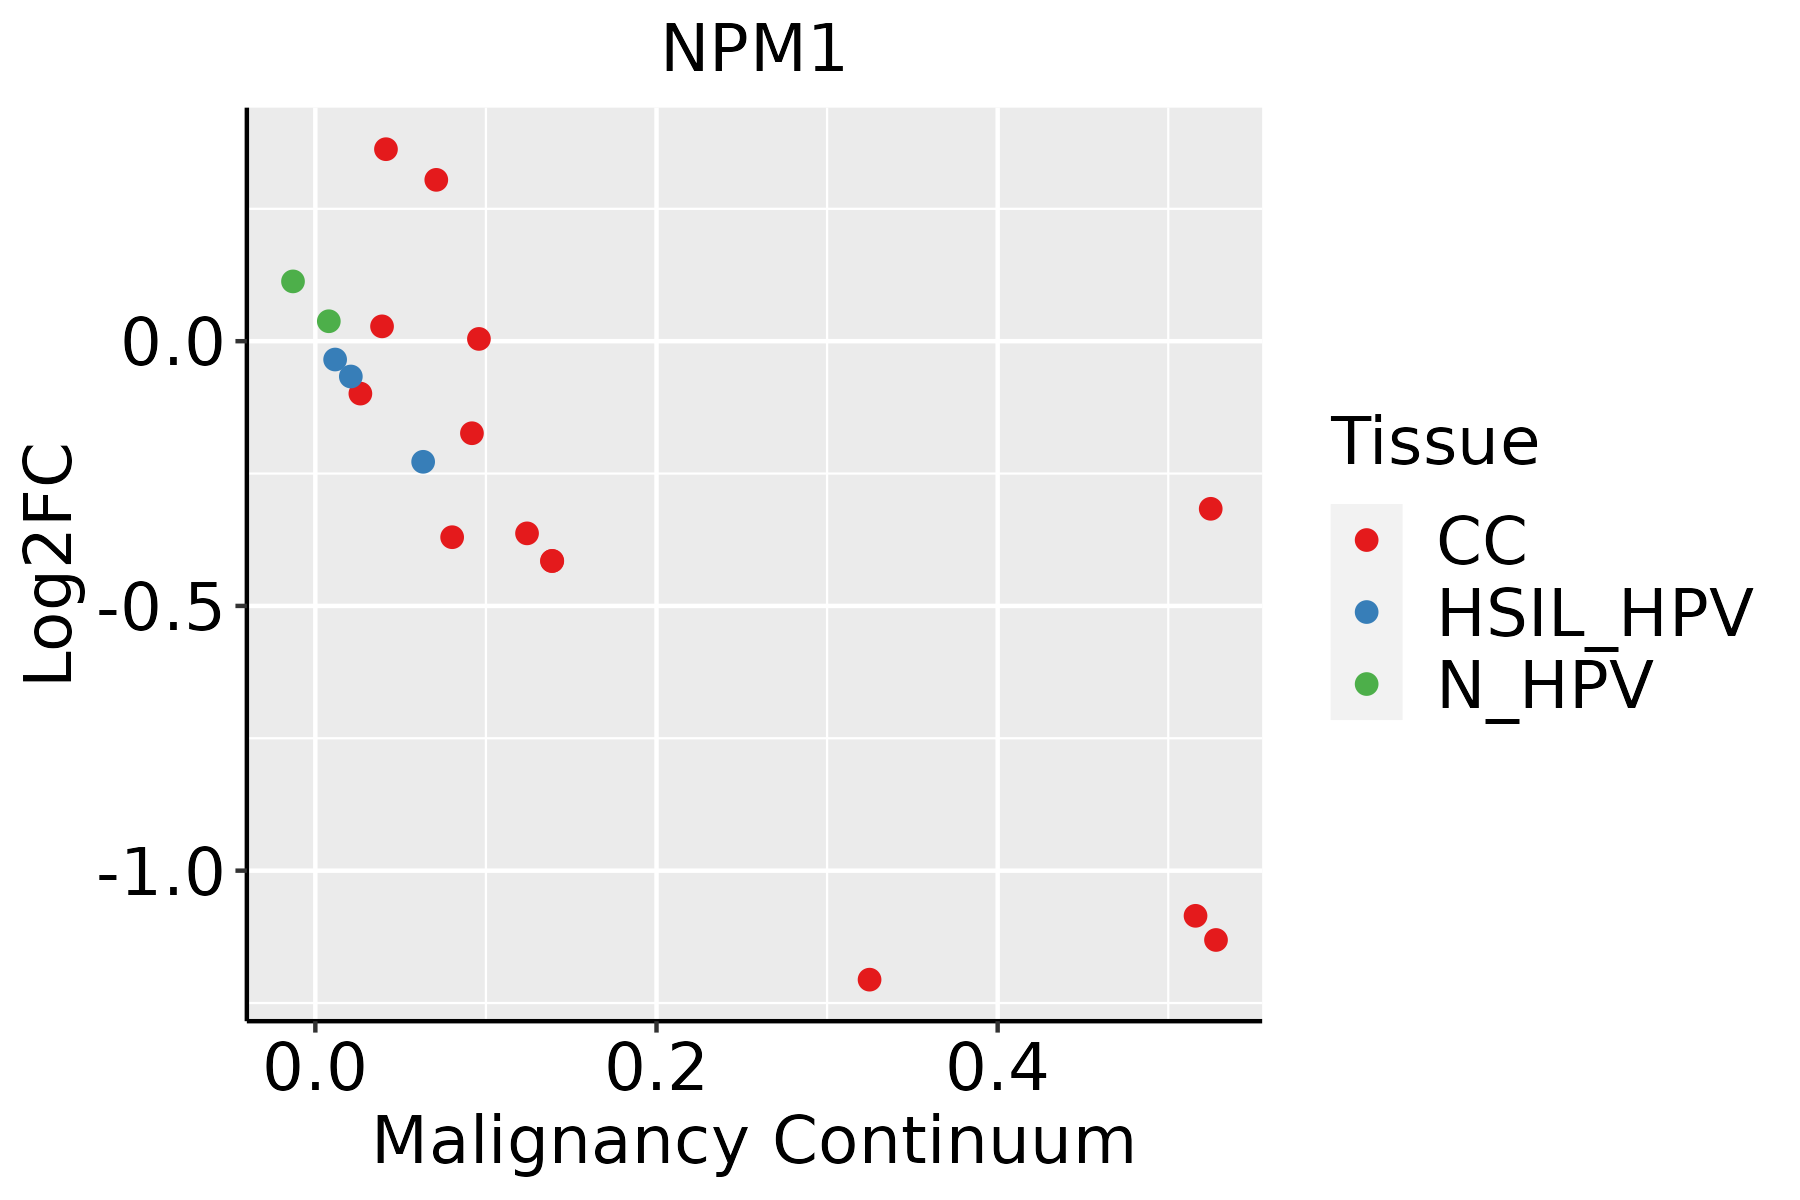 | CC: Cervix cancer |
| HSIL_HPV: HPV-infected high-grade squamous intraepithelial lesions | ||
| N_HPV: HPV-infected normal cervix | ||
| Colorectum (GSE201348) | 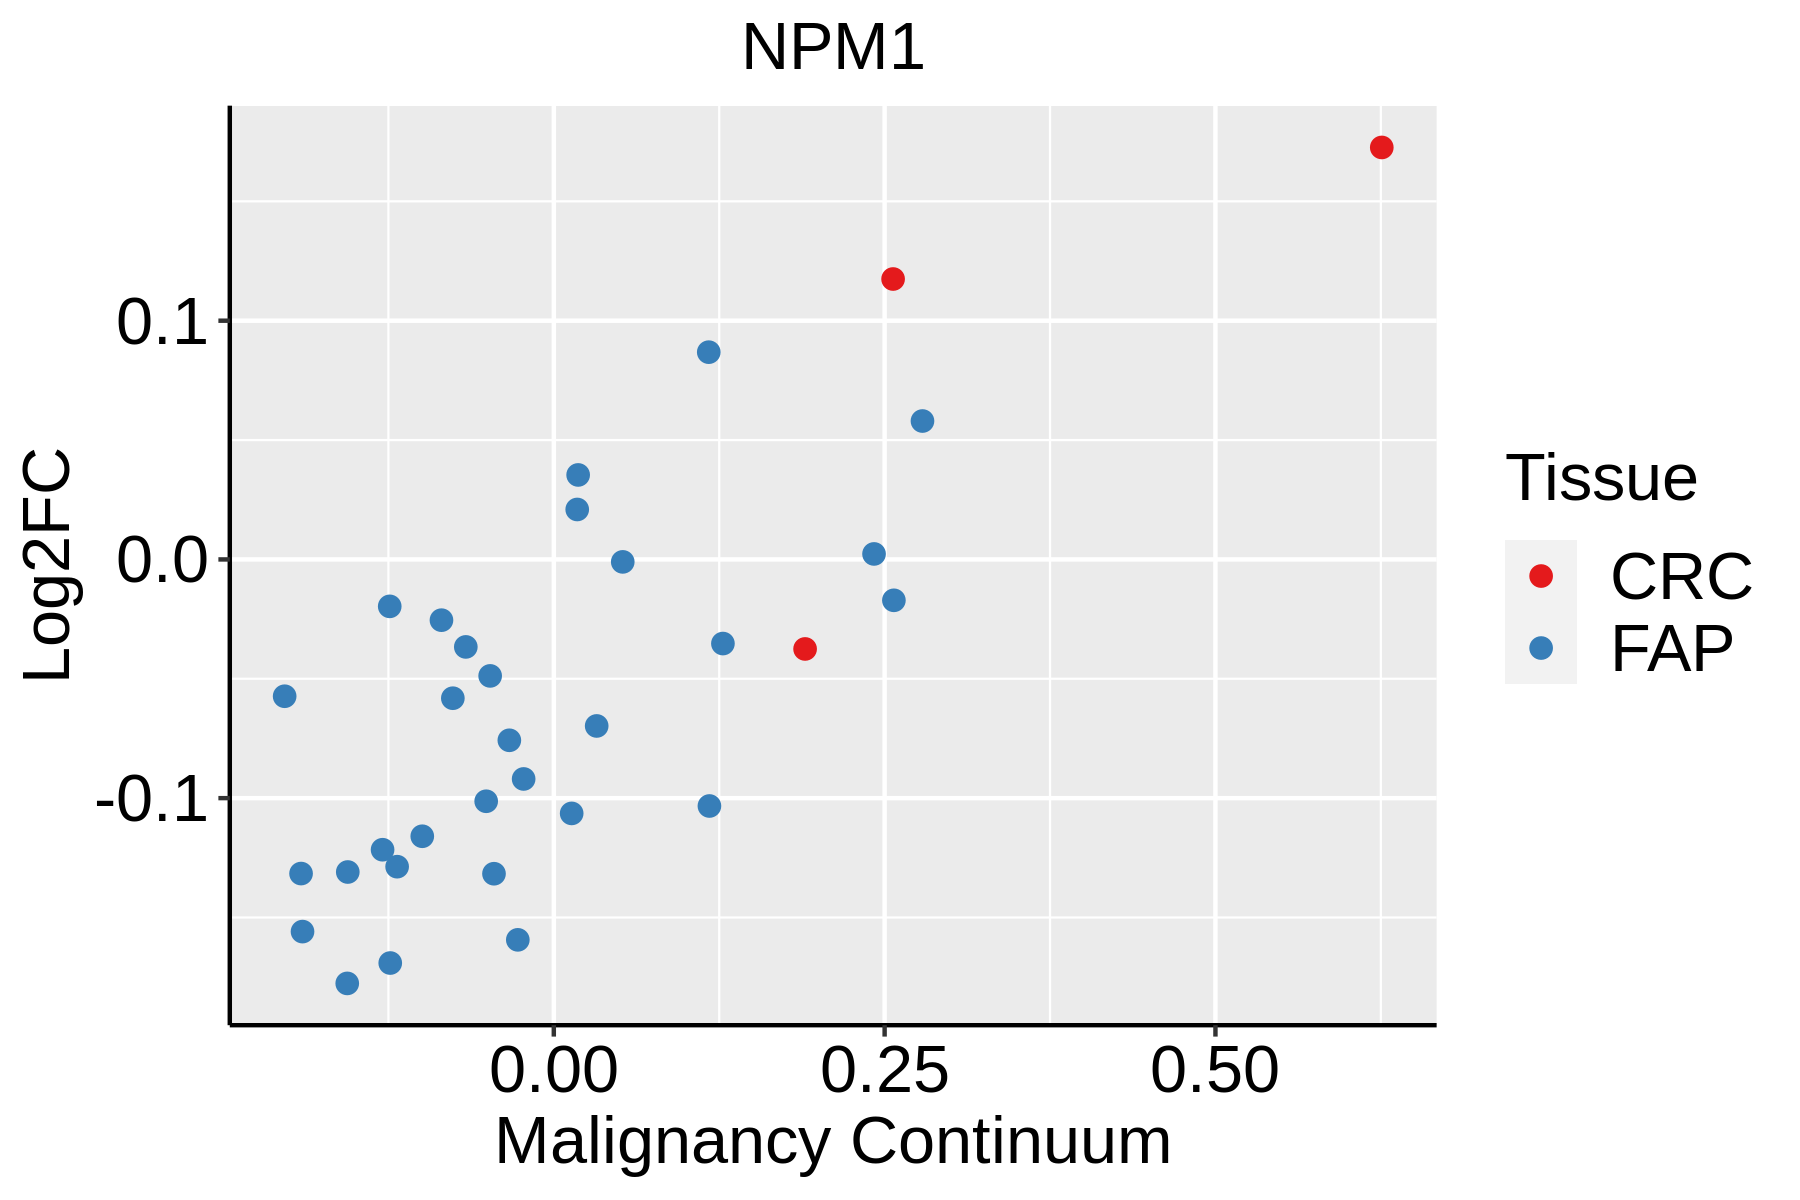 | FAP: Familial adenomatous polyposis |
| CRC: Colorectal cancer | ||
| Colorectum (HTA11) | 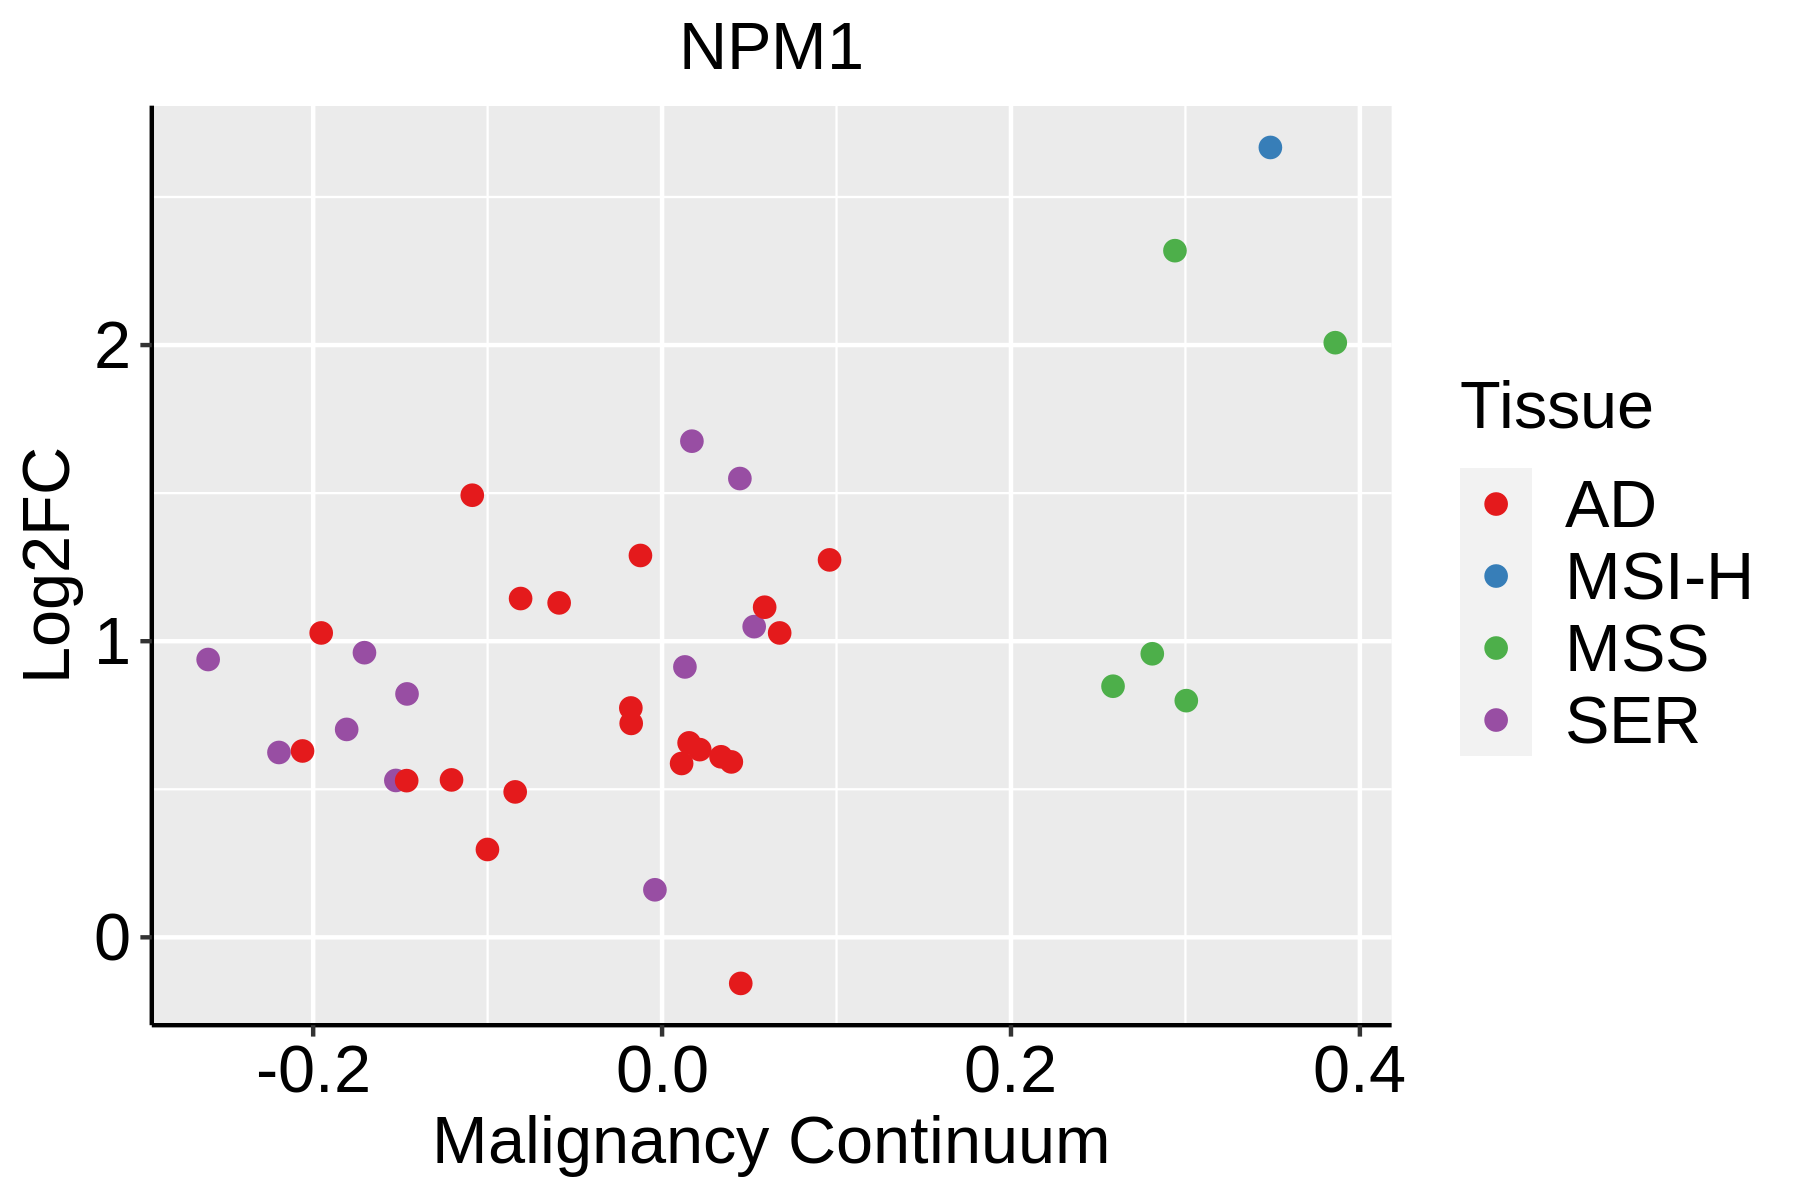 | AD: Adenomas |
| SER: Sessile serrated lesions | ||
| MSI-H: Microsatellite-high colorectal cancer | ||
| MSS: Microsatellite stable colorectal cancer | ||
| Endometrium | 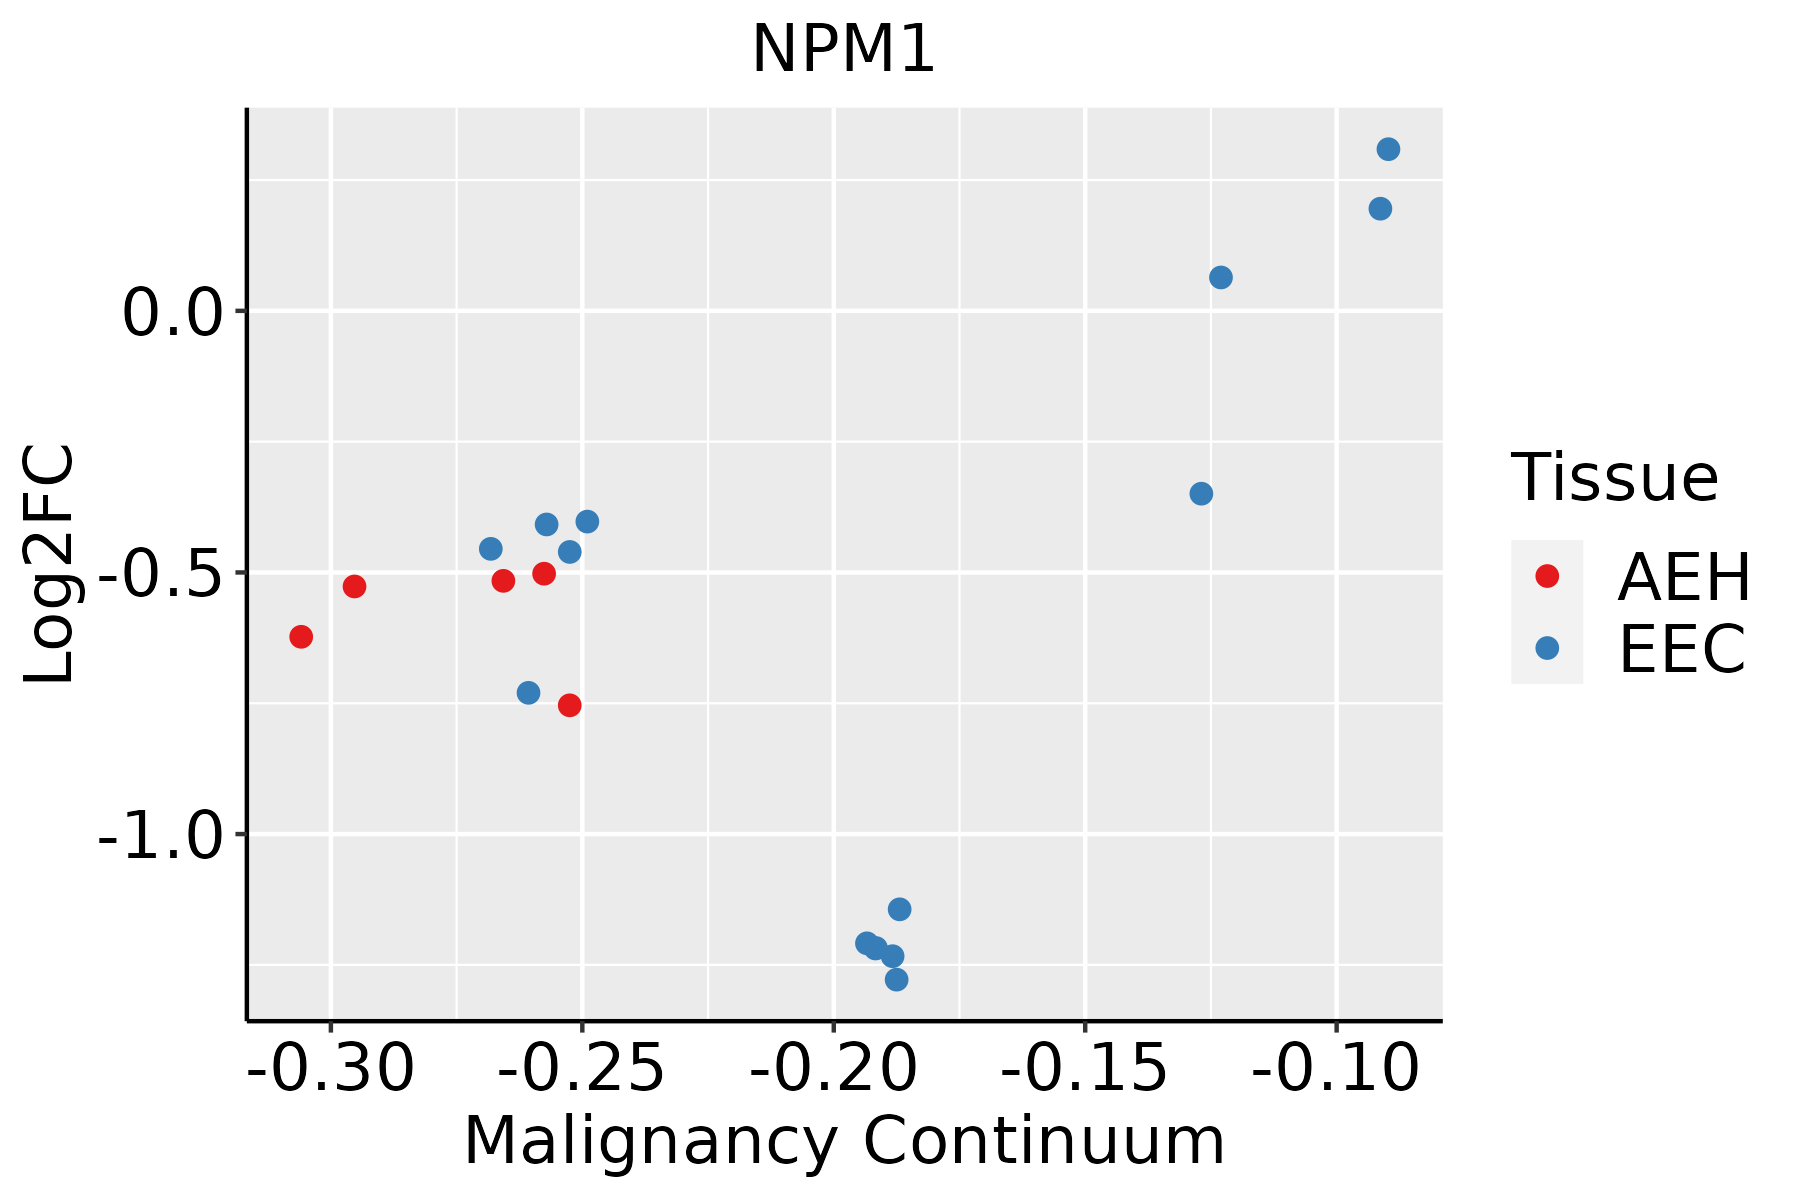 | AEH: Atypical endometrial hyperplasia |
| EEC: Endometrioid Cancer | ||
| Esophagus | 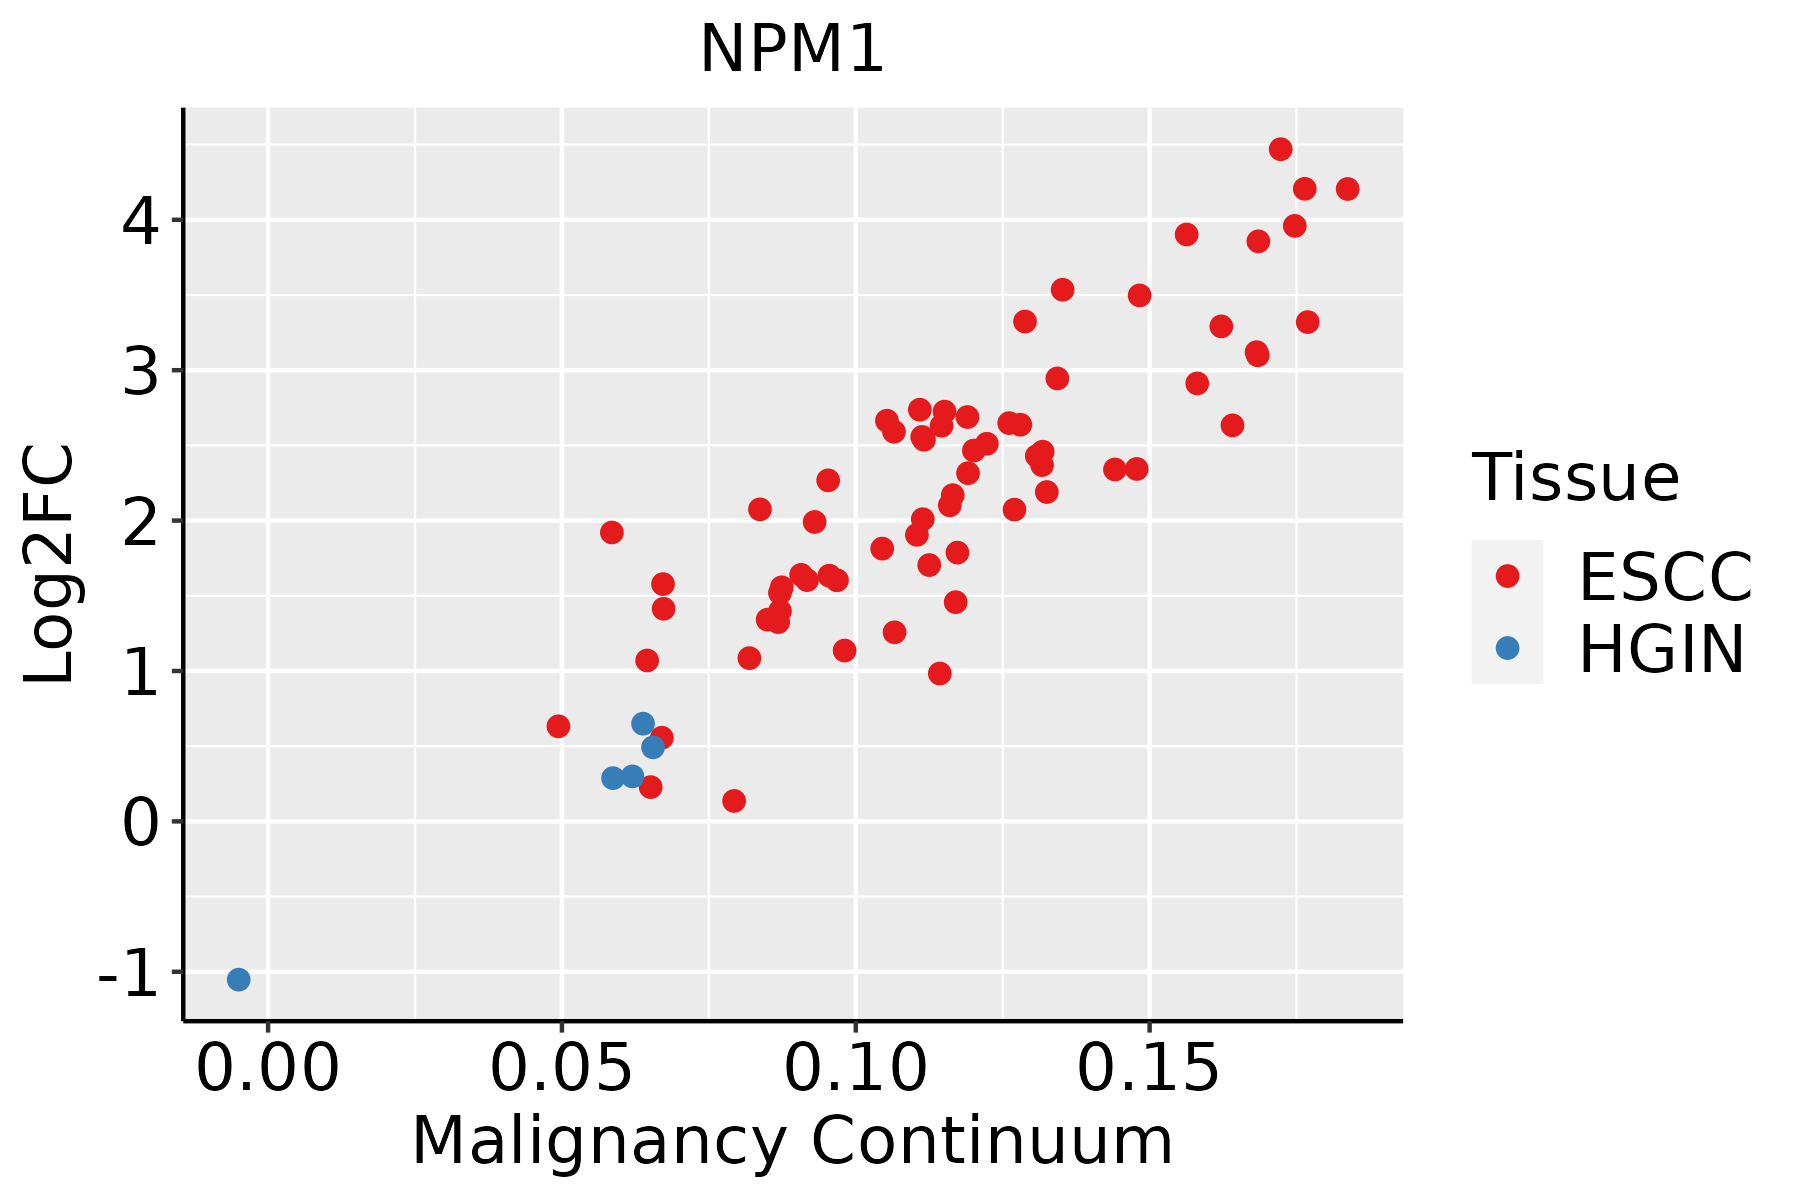 | ESCC: Esophageal squamous cell carcinoma |
| HGIN: High-grade intraepithelial neoplasias | ||
| LGIN: Low-grade intraepithelial neoplasias | ||
| GC | 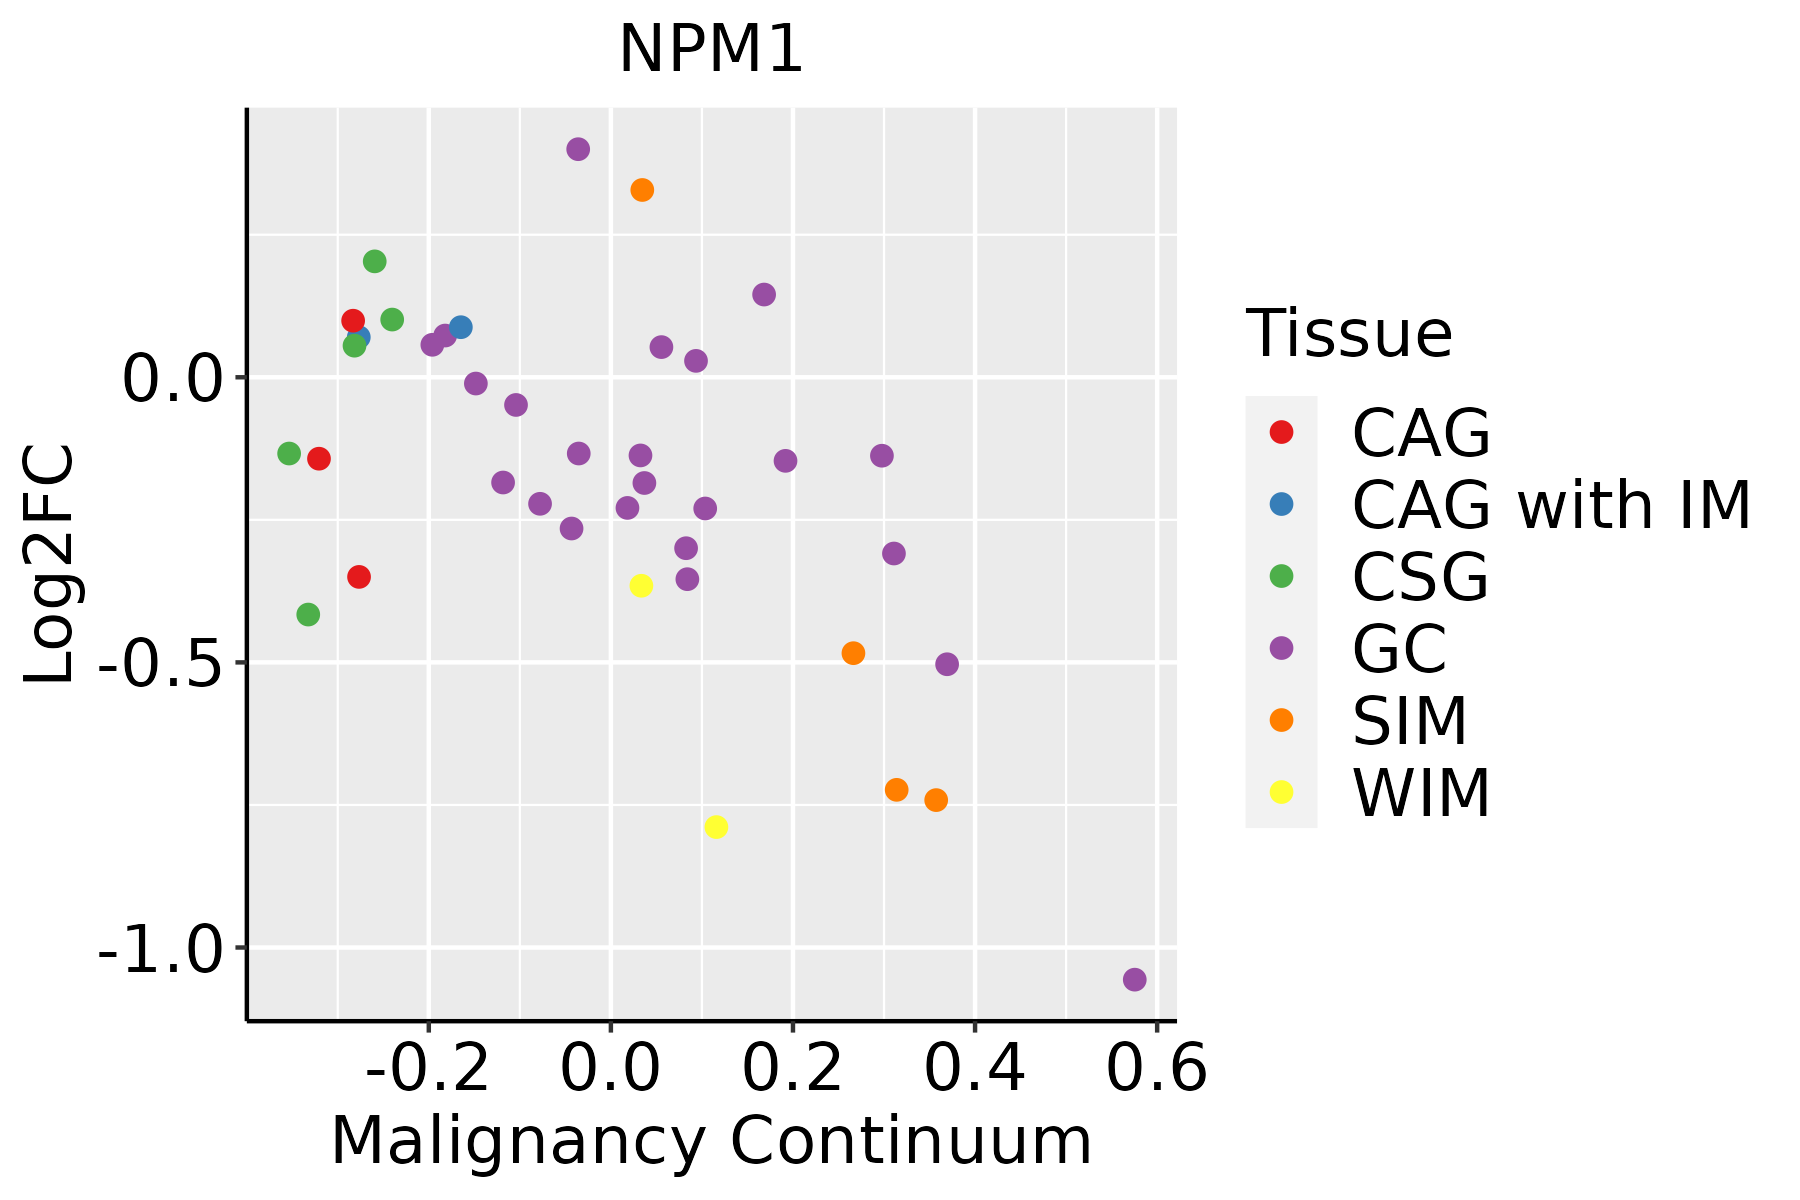 | CAG: Chronic atrophic gastritis |
| CAG with IM: Chronic atrophic gastritis with intestinal metaplasia | ||
| CSG: Chronic superficial gastritis | ||
| GC: Gastric cancer | ||
| SIM: Severe intestinal metaplasia | ||
| WIM: Wild intestinal metaplasia | ||
| Liver |  | HCC: Hepatocellular carcinoma |
| NAFLD: Non-alcoholic fatty liver disease | ||
| Lung | 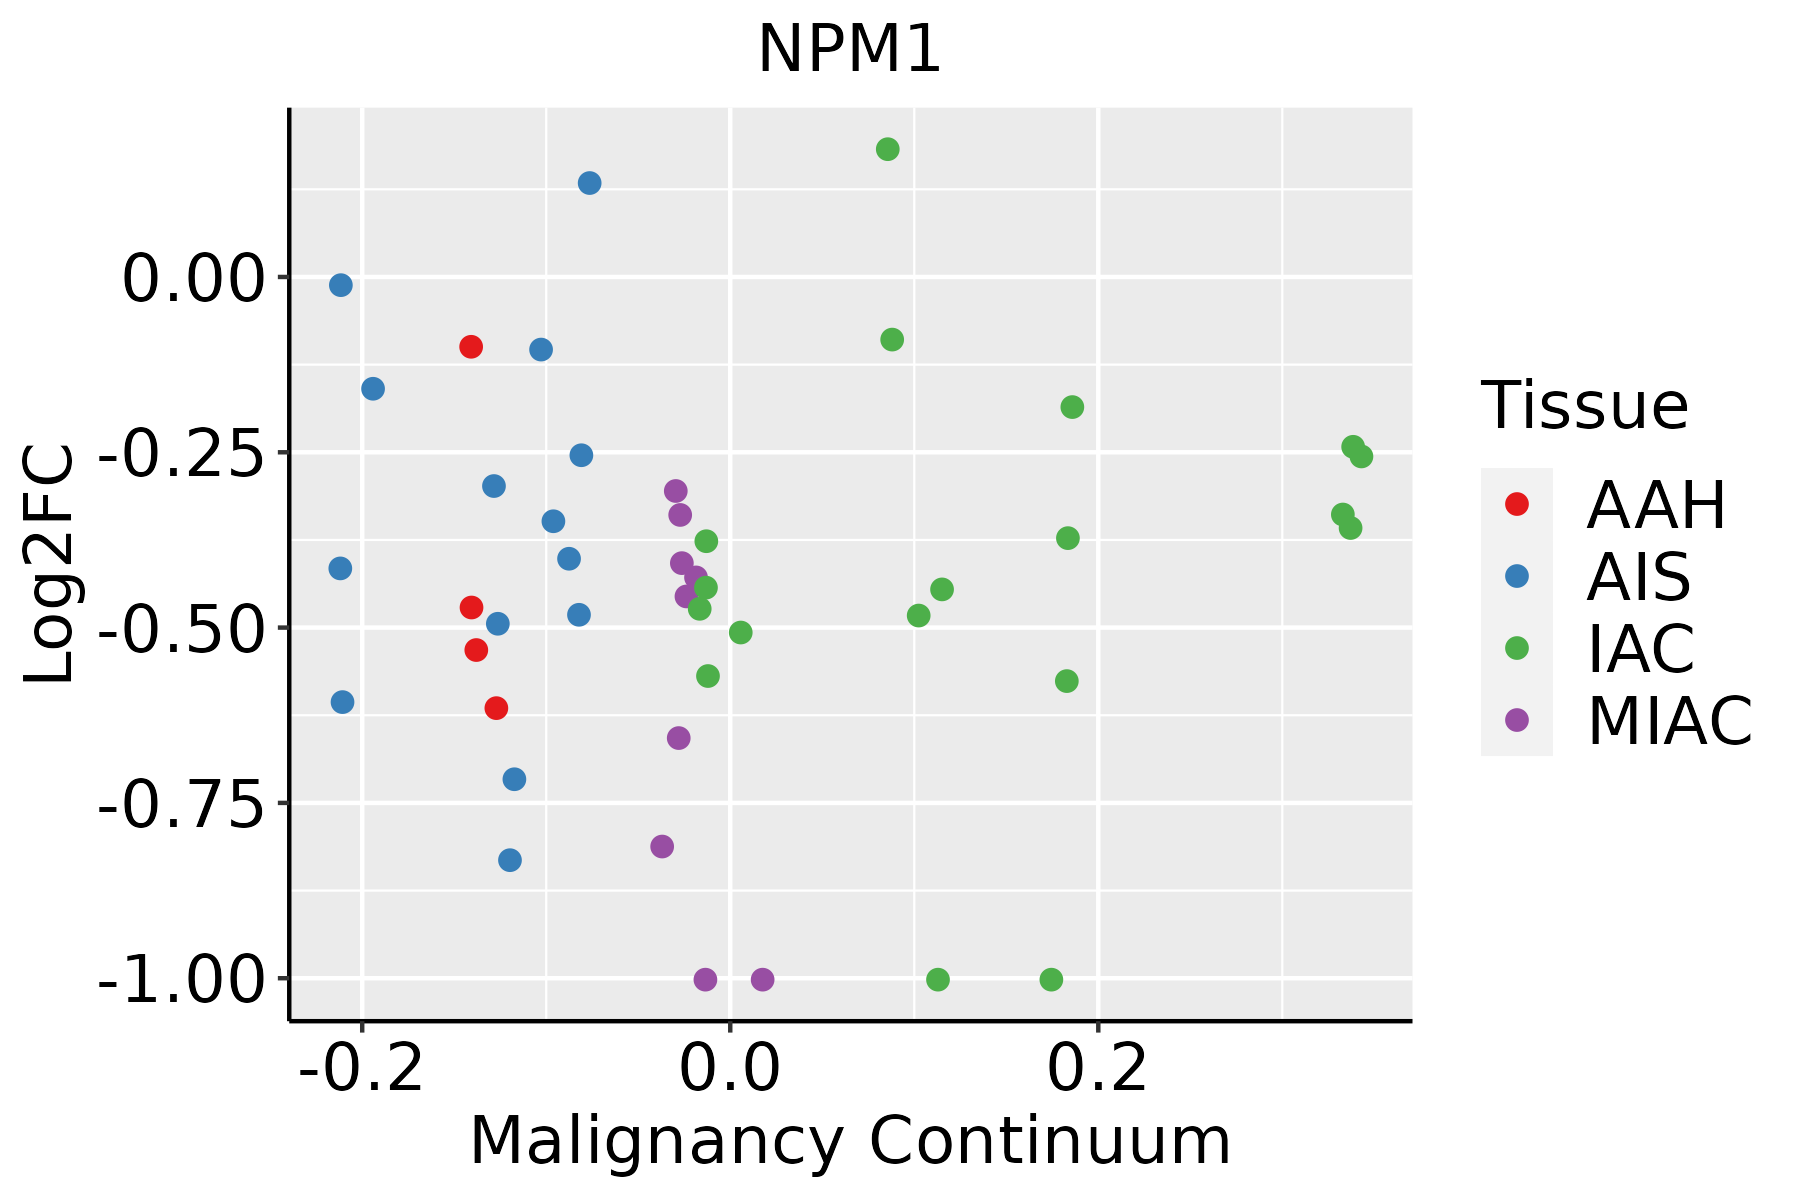 | AAH: Atypical adenomatous hyperplasia |
| AIS: Adenocarcinoma in situ | ||
| IAC: Invasive lung adenocarcinoma | ||
| MIA: Minimally invasive adenocarcinoma | ||
| Oral Cavity | 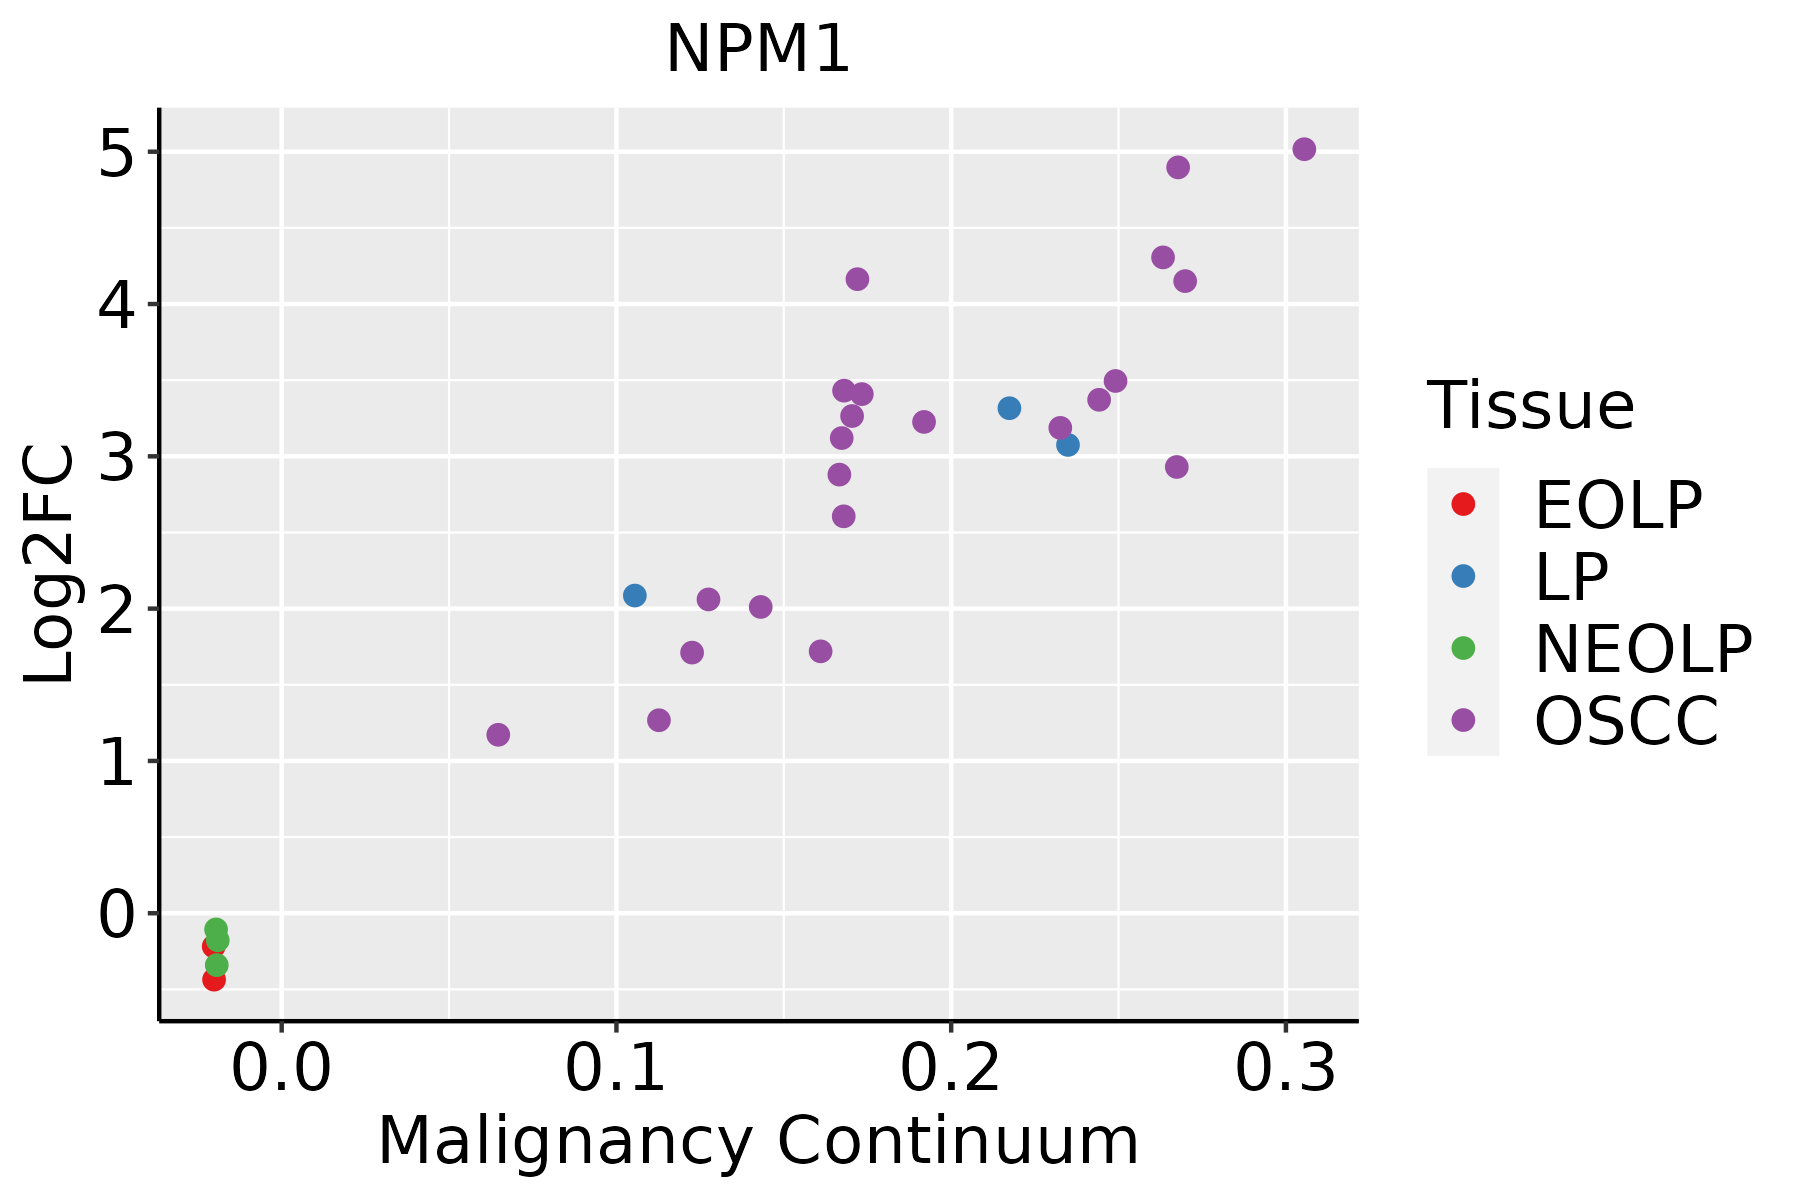 | EOLP: Erosive Oral lichen planus |
| LP: leukoplakia | ||
| NEOLP: Non-erosive oral lichen planus | ||
| OSCC: Oral squamous cell carcinoma | ||
| Prostate | 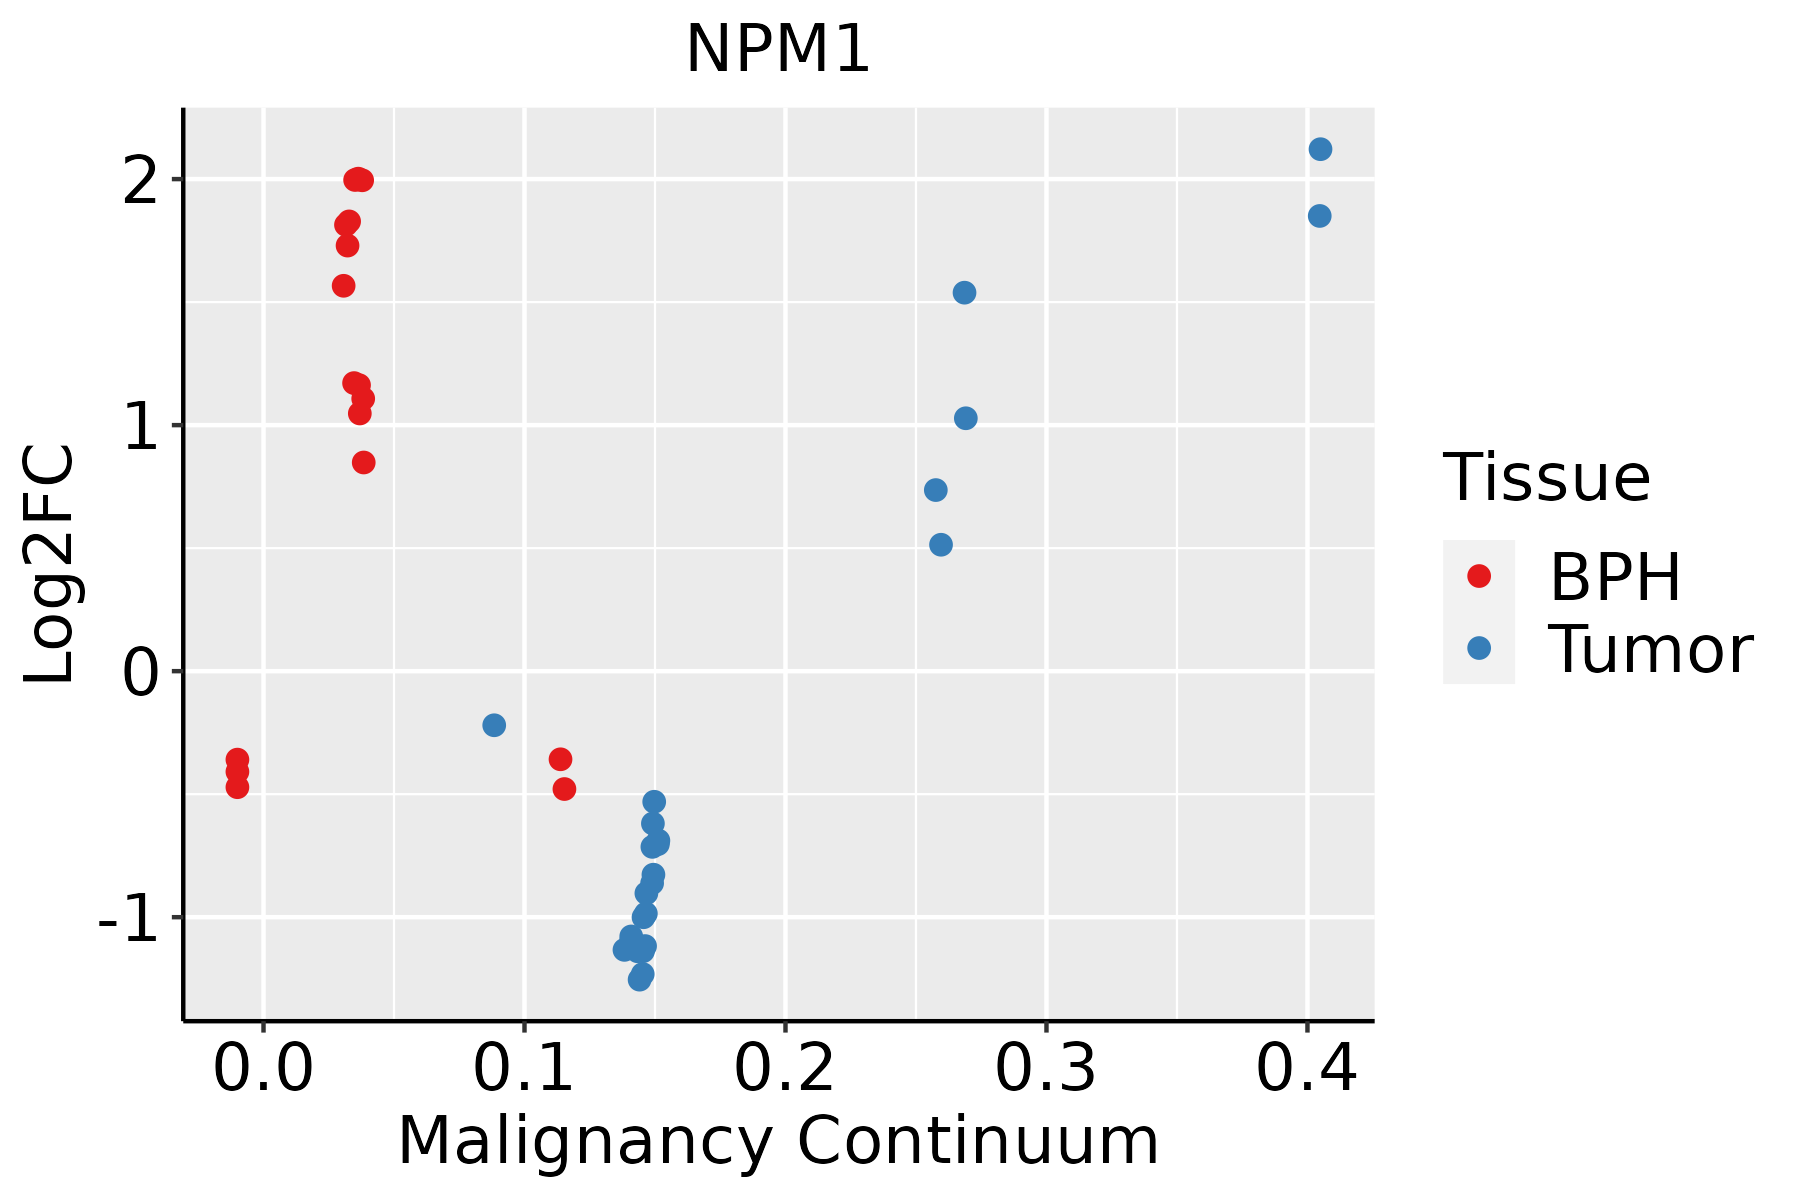 | BPH: Benign Prostatic Hyperplasia |
| Skin | 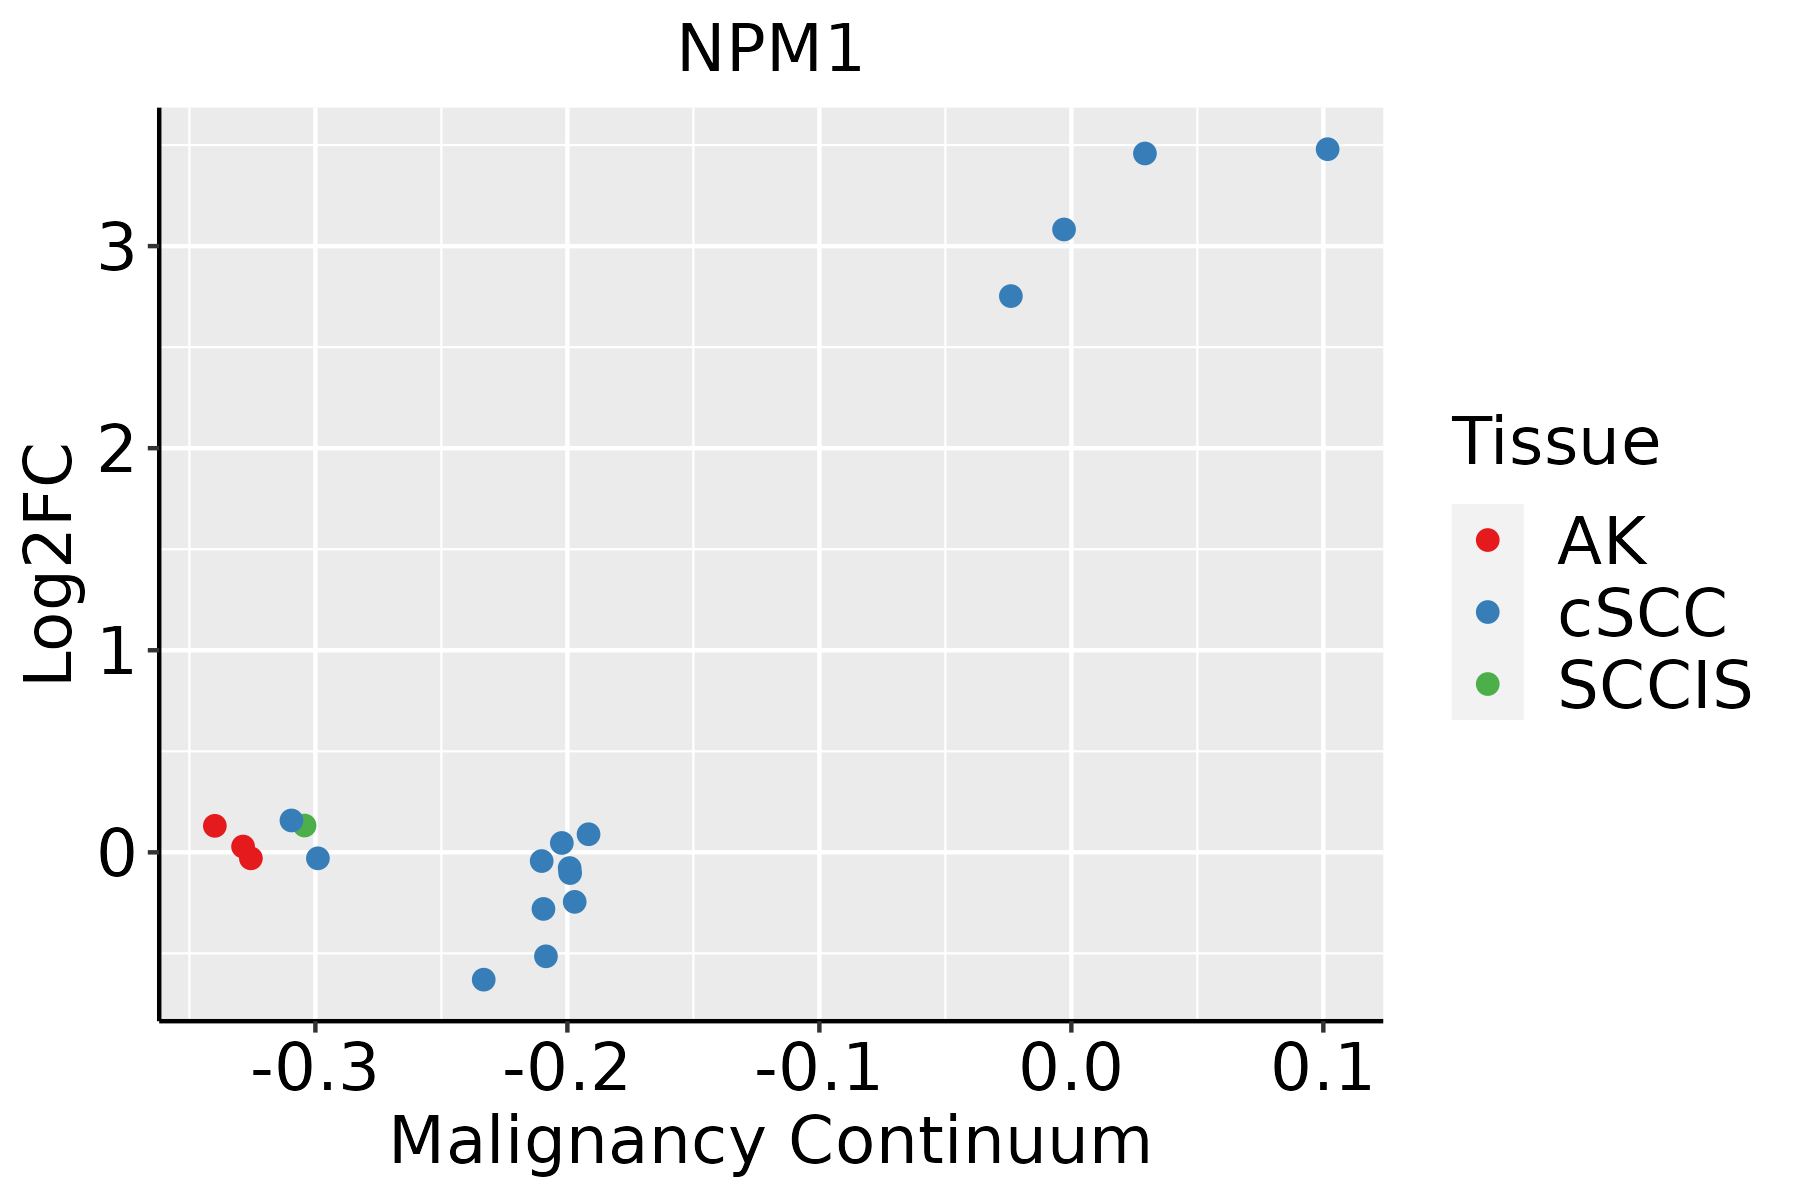 | AK: Actinic keratosis |
| cSCC: Cutaneous squamous cell carcinoma | ||
| SCCIS:squamous cell carcinoma in situ | ||
| Thyroid | 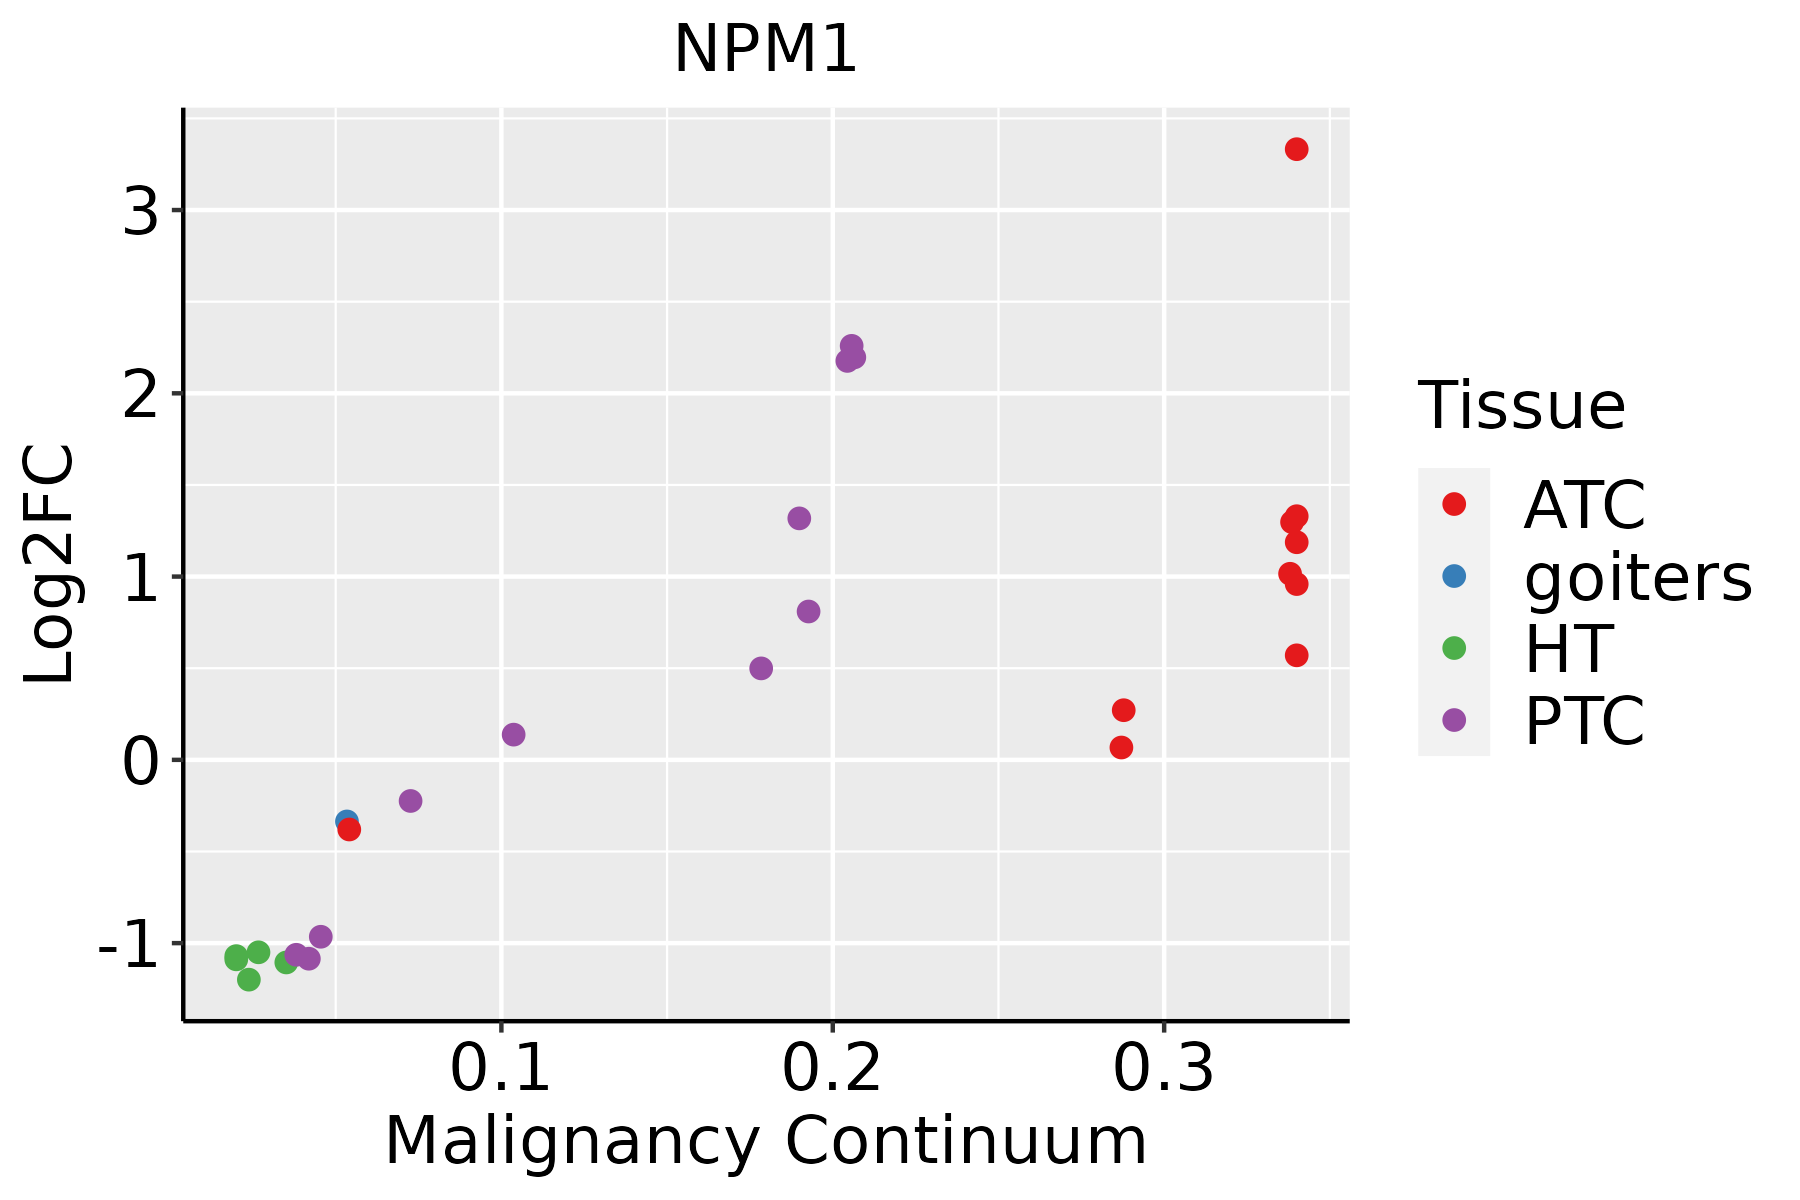 | ATC: Anaplastic thyroid cancer |
| HT: Hashimoto's thyroiditis | ||
| PTC: Papillary thyroid cancer |
| ∗log2FC in expression of this searched gene in stem-like cells from each diseased tissue sample relative to stem-like cells in normal samples in each tissue plotted against the malignancy continuum. Samples are colored based on if they are from different disease stage. |
Top |
Malignant transformation related pathway analysis |
| Find out the enriched GO biological processes and KEGG pathways involved in transition from healthy to precancer to cancer |
| Tissue | Disease Stage | Enriched GO biological Processes |
| Colorectum | AD |  |
| Colorectum | SER |  |
| Colorectum | MSS |  |
| Colorectum | MSI-H |  |
| Colorectum | FAP |  |
| ∗Top 15 enriched GO BP terms are showed in the bar plot of each disease state in each tissue. Each row represents a significant GO biological process which is colored according to the -log10(p.adjust). |
| Page: 1 2 3 4 5 6 7 8 9 |
| GO ID | Tissue | Disease Stage | Description | Gene Ratio | Bg Ratio | pvalue | p.adjust | Count |
| GO:00313981 | Liver | HCC | positive regulation of protein ubiquitination | 79/7958 | 119/18723 | 1.18e-07 | 2.26e-06 | 79 |
| GO:000155821 | Liver | HCC | regulation of cell growth | 228/7958 | 414/18723 | 1.34e-07 | 2.55e-06 | 228 |
| GO:190179622 | Liver | HCC | regulation of signal transduction by p53 class mediator | 64/7958 | 93/18723 | 2.53e-07 | 4.45e-06 | 64 |
| GO:190331222 | Liver | HCC | negative regulation of mRNA metabolic process | 63/7958 | 92/18723 | 4.14e-07 | 6.97e-06 | 63 |
| GO:000646912 | Liver | HCC | negative regulation of protein kinase activity | 126/7958 | 212/18723 | 4.55e-07 | 7.49e-06 | 126 |
| GO:005105221 | Liver | HCC | regulation of DNA metabolic process | 198/7958 | 359/18723 | 7.62e-07 | 1.17e-05 | 198 |
| GO:00315031 | Liver | HCC | protein-containing complex localization | 129/7958 | 220/18723 | 9.38e-07 | 1.42e-05 | 129 |
| GO:004802511 | Liver | HCC | negative regulation of mRNA splicing, via spliceosome | 19/7958 | 20/18723 | 1.03e-06 | 1.54e-05 | 19 |
| GO:200102021 | Liver | HCC | regulation of response to DNA damage stimulus | 128/7958 | 219/18723 | 1.31e-06 | 1.90e-05 | 128 |
| GO:007121421 | Liver | HCC | cellular response to abiotic stimulus | 183/7958 | 331/18723 | 1.59e-06 | 2.26e-05 | 183 |
| GO:010400421 | Liver | HCC | cellular response to environmental stimulus | 183/7958 | 331/18723 | 1.59e-06 | 2.26e-05 | 183 |
| GO:19019871 | Liver | HCC | regulation of cell cycle phase transition | 211/7958 | 390/18723 | 2.11e-06 | 2.89e-05 | 211 |
| GO:00427702 | Liver | HCC | signal transduction in response to DNA damage | 103/7958 | 172/18723 | 3.05e-06 | 4.04e-05 | 103 |
| GO:19021151 | Liver | HCC | regulation of organelle assembly | 110/7958 | 186/18723 | 3.30e-06 | 4.34e-05 | 110 |
| GO:000756822 | Liver | HCC | aging | 185/7958 | 339/18723 | 4.28e-06 | 5.50e-05 | 185 |
| GO:004578711 | Liver | HCC | positive regulation of cell cycle | 172/7958 | 313/18723 | 5.29e-06 | 6.58e-05 | 172 |
| GO:0045786 | Liver | HCC | negative regulation of cell cycle | 204/7958 | 385/18723 | 1.84e-05 | 1.99e-04 | 204 |
| GO:00435551 | Liver | HCC | regulation of translation in response to stress | 17/7958 | 20/18723 | 1.18e-04 | 9.87e-04 | 17 |
| GO:00346441 | Liver | HCC | cellular response to UV | 56/7958 | 90/18723 | 1.25e-04 | 1.03e-03 | 56 |
| GO:00714782 | Liver | HCC | cellular response to radiation | 104/7958 | 186/18723 | 1.48e-04 | 1.19e-03 | 104 |
| Page: 1 2 3 4 5 6 7 8 9 10 11 12 13 14 15 16 17 18 19 20 21 22 23 24 25 26 27 28 29 30 31 32 33 34 35 36 37 38 39 40 41 42 43 44 45 46 47 48 49 50 51 52 53 54 55 56 57 58 59 60 61 62 63 64 65 66 67 68 69 70 71 72 73 74 75 76 77 78 79 80 81 82 83 84 85 86 87 88 89 90 91 92 93 94 95 96 97 98 99 100 101 102 103 104 105 106 107 108 109 110 111 112 113 114 115 116 117 118 119 120 121 122 123 124 125 126 127 128 129 130 131 132 133 134 135 136 137 138 139 140 141 142 143 144 145 146 147 |
| Pathway ID | Tissue | Disease Stage | Description | Gene Ratio | Bg Ratio | pvalue | p.adjust | qvalue | Count |
| Page: 1 |
Top |
Cell-cell communication analysis |
| Identification of potential cell-cell interactions between two cell types and their ligand-receptor pairs for different disease states |
| Ligand | Receptor | LRpair | Pathway | Tissue | Disease Stage |
| Page: 1 |
Top |
Single-cell gene regulatory network inference analysis |
| Find out the significant the regulons (TFs) and the target genes of each regulon across cell types for different disease states |
| TF | Cell Type | Tissue | Disease Stage | Target Gene | RSS | Regulon Activity |
| ∗The dot plots of a searched regulon are shown for all cell subpopulations in each disease state of each tissue based on the regulon specific score inferred using pySCENIC and by calculating the average expression. |
| Page: 1 |
Top |
Somatic mutation of malignant transformation related genes |
| Annotation of somatic variants for genes involved in malignant transformation |
| Hugo Symbol | Variant Class | Variant Classification | dbSNP RS | HGVSc | HGVSp | HGVSp Short | SWISSPROT | BIOTYPE | SIFT | PolyPhen | Tumor Sample Barcode | Tissue | Histology | Sex | Age | Stage | Therapy Types | Drugs | Outcome |
| NPM1 | SNV | Missense_Mutation | c.553N>A | p.Glu185Lys | p.E185K | P06748 | protein_coding | tolerated(0.12) | possibly_damaging(0.458) | TCGA-Q1-A73O-01 | Cervix | cervical & endocervical cancer | Female | <65 | I/II | Chemotherapy | cisplatin | CR | |
| NPM1 | SNV | Missense_Mutation | novel | c.503N>G | p.Asp168Gly | p.D168G | P06748 | protein_coding | tolerated(0.11) | benign(0.061) | TCGA-AA-3984-01 | Colorectum | colon adenocarcinoma | Female | <65 | I/II | Unknown | Unknown | SD |
| NPM1 | SNV | Missense_Mutation | c.7N>T | p.Asp3Tyr | p.D3Y | P06748 | protein_coding | deleterious(0) | probably_damaging(0.98) | TCGA-AA-A010-01 | Colorectum | colon adenocarcinoma | Female | <65 | I/II | Chemotherapy | folinic | CR | |
| NPM1 | SNV | Missense_Mutation | c.81A>T | p.Lys27Asn | p.K27N | P06748 | protein_coding | deleterious(0.02) | benign(0.425) | TCGA-AD-6895-01 | Colorectum | colon adenocarcinoma | Male | >=65 | III/IV | Unknown | Unknown | SD | |
| NPM1 | SNV | Missense_Mutation | novel | c.478G>C | p.Ala160Pro | p.A160P | P06748 | protein_coding | deleterious(0.03) | possibly_damaging(0.892) | TCGA-AM-5820-01 | Colorectum | colon adenocarcinoma | Female | <65 | I/II | Unknown | Unknown | SD |
| NPM1 | SNV | Missense_Mutation | rs376742289 | c.586N>G | p.Ile196Val | p.I196V | P06748 | protein_coding | tolerated(0.65) | benign(0.001) | TCGA-AM-5821-01 | Colorectum | colon adenocarcinoma | Female | >=65 | I/II | Unknown | Unknown | SD |
| NPM1 | SNV | Missense_Mutation | novel | c.607A>C | p.Asn203His | p.N203H | P06748 | protein_coding | deleterious(0.04) | benign(0.063) | TCGA-AG-A002-01 | Colorectum | rectum adenocarcinoma | Male | <65 | I/II | Unknown | Unknown | SD |
| NPM1 | insertion | Frame_Shift_Ins | novel | c.477_478insACCA | p.Ala160ThrfsTer3 | p.A160Tfs*3 | P06748 | protein_coding | TCGA-AM-5820-01 | Colorectum | colon adenocarcinoma | Female | <65 | I/II | Unknown | Unknown | SD | ||
| NPM1 | SNV | Missense_Mutation | novel | c.717N>C | p.Lys239Asn | p.K239N | P06748 | protein_coding | deleterious(0) | probably_damaging(0.963) | TCGA-AP-A059-01 | Endometrium | uterine corpus endometrioid carcinoma | Female | >=65 | I/II | Unknown | Unknown | SD |
| NPM1 | SNV | Missense_Mutation | c.296N>C | p.Val99Ala | p.V99A | P06748 | protein_coding | deleterious(0.05) | benign(0.272) | TCGA-AX-A05Z-01 | Endometrium | uterine corpus endometrioid carcinoma | Female | <65 | III/IV | Chemotherapy | adriamycin | SD |
| Page: 1 2 3 |
Top |
Related drugs of malignant transformation related genes |
| Identification of chemicals and drugs interact with genes involved in malignant transfromation |
| (DGIdb 4.0) |
| Entrez ID | Symbol | Category | Interaction Types | Drug Claim Name | Drug Name | PMIDs |
| 4869 | NPM1 | CLINICALLY ACTIONABLE, DNA REPAIR, DRUGGABLE GENOME, DRUG RESISTANCE | Crizotinib | CRIZOTINIB | 27009859,25749034,24509625,18089725,25421750 | |
| 4869 | NPM1 | CLINICALLY ACTIONABLE, DNA REPAIR, DRUGGABLE GENOME, DRUG RESISTANCE | IPP-204106 | |||
| 4869 | NPM1 | CLINICALLY ACTIONABLE, DNA REPAIR, DRUGGABLE GENOME, DRUG RESISTANCE | N/A | 19047294,26586702,16109776,26676635,26239249,25281355,24573385,25713434 | ||
| 4869 | NPM1 | CLINICALLY ACTIONABLE, DNA REPAIR, DRUGGABLE GENOME, DRUG RESISTANCE | AZD3463 | 27009859 | ||
| 4869 | NPM1 | CLINICALLY ACTIONABLE, DNA REPAIR, DRUGGABLE GENOME, DRUG RESISTANCE | Deguelin | DEGUELIN | 25348016,25242579 | |
| 4869 | NPM1 | CLINICALLY ACTIONABLE, DNA REPAIR, DRUGGABLE GENOME, DRUG RESISTANCE | Venetoclax | VENETOCLAX | ||
| 4869 | NPM1 | CLINICALLY ACTIONABLE, DNA REPAIR, DRUGGABLE GENOME, DRUG RESISTANCE | EPZ004777 | 27535106 | ||
| 4869 | NPM1 | CLINICALLY ACTIONABLE, DNA REPAIR, DRUGGABLE GENOME, DRUG RESISTANCE | MI-503 | 27535106 | ||
| 4869 | NPM1 | CLINICALLY ACTIONABLE, DNA REPAIR, DRUGGABLE GENOME, DRUG RESISTANCE | TRETINOIN | TRETINOIN | 19965647,21719597 | |
| 4869 | NPM1 | CLINICALLY ACTIONABLE, DNA REPAIR, DRUGGABLE GENOME, DRUG RESISTANCE | Midostaurin | MIDOSTAURIN |
| Page: 1 2 3 |

Copyright 2023-Present -The University of Texas Health Science Center at Houston |