
|
|||||
|
 | |
| |
| |
| |
| |
| |
|
Gene: PRKCD |
Gene summary for PRKCD |
| Gene information | Species | Human | Gene symbol | PRKCD | Gene ID | 5580 |
| Gene name | protein kinase C delta | |
| Gene Alias | ALPS3 | |
| Cytomap | 3p21.1 | |
| Gene Type | protein-coding | GO ID | GO:0000165 | UniProtAcc | A0A024R328 |
Top |
Malignant transformation analysis |
| Identification of the aberrant gene expression in precancerous and cancerous lesions by comparing the gene expression of stem-like cells in diseased tissues with normal stem cells |
| Entrez ID | Symbol | Replicates | Species | Organ | Tissue | Adj P-value | Log2FC | Malignancy |
| 5580 | PRKCD | HTA11_2487_2000001011 | Human | Colorectum | SER | 6.51e-20 | 9.21e-01 | -0.1808 |
| 5580 | PRKCD | HTA11_78_2000001011 | Human | Colorectum | AD | 1.77e-08 | 5.77e-01 | -0.1088 |
| 5580 | PRKCD | HTA11_347_2000001011 | Human | Colorectum | AD | 5.65e-26 | 7.29e-01 | -0.1954 |
| 5580 | PRKCD | HTA11_411_2000001011 | Human | Colorectum | SER | 2.14e-03 | 1.16e+00 | -0.2602 |
| 5580 | PRKCD | HTA11_2112_2000001011 | Human | Colorectum | SER | 2.76e-05 | 8.71e-01 | -0.2196 |
| 5580 | PRKCD | HTA11_3361_2000001011 | Human | Colorectum | AD | 1.61e-03 | 4.74e-01 | -0.1207 |
| 5580 | PRKCD | HTA11_83_2000001011 | Human | Colorectum | SER | 1.37e-09 | 6.32e-01 | -0.1526 |
| 5580 | PRKCD | HTA11_696_2000001011 | Human | Colorectum | AD | 5.27e-22 | 6.28e-01 | -0.1464 |
| 5580 | PRKCD | HTA11_866_2000001011 | Human | Colorectum | AD | 6.34e-09 | 3.95e-01 | -0.1001 |
| 5580 | PRKCD | HTA11_1391_2000001011 | Human | Colorectum | AD | 1.87e-09 | 5.71e-01 | -0.059 |
| 5580 | PRKCD | HTA11_5212_2000001011 | Human | Colorectum | AD | 3.41e-04 | 6.88e-01 | -0.2061 |
| 5580 | PRKCD | HTA11_866_3004761011 | Human | Colorectum | AD | 1.51e-02 | 3.24e-01 | 0.096 |
| 5580 | PRKCD | HTA11_7696_3000711011 | Human | Colorectum | AD | 8.99e-08 | 3.38e-01 | 0.0674 |
| 5580 | PRKCD | HTA11_99999970781_79442 | Human | Colorectum | MSS | 3.80e-03 | 2.58e-01 | 0.294 |
| 5580 | PRKCD | HTA11_99999965104_69814 | Human | Colorectum | MSS | 2.61e-05 | 4.24e-01 | 0.281 |
| 5580 | PRKCD | HTA11_99999971662_82457 | Human | Colorectum | MSS | 3.32e-11 | 5.38e-01 | 0.3859 |
| 5580 | PRKCD | LZE8T | Human | Esophagus | ESCC | 4.02e-03 | 8.17e-03 | 0.067 |
| 5580 | PRKCD | LZE24T | Human | Esophagus | ESCC | 2.48e-17 | 2.78e-01 | 0.0596 |
| 5580 | PRKCD | LZE21T | Human | Esophagus | ESCC | 2.79e-02 | 1.64e-01 | 0.0655 |
| 5580 | PRKCD | P1T-E | Human | Esophagus | ESCC | 9.70e-05 | 2.35e-01 | 0.0875 |
| Page: 1 2 3 4 5 6 |
| Tissue | Expression Dynamics | Abbreviation |
| Colorectum (GSE201348) |  | FAP: Familial adenomatous polyposis |
| CRC: Colorectal cancer | ||
| Colorectum (HTA11) |  | AD: Adenomas |
| SER: Sessile serrated lesions | ||
| MSI-H: Microsatellite-high colorectal cancer | ||
| MSS: Microsatellite stable colorectal cancer | ||
| Esophagus | 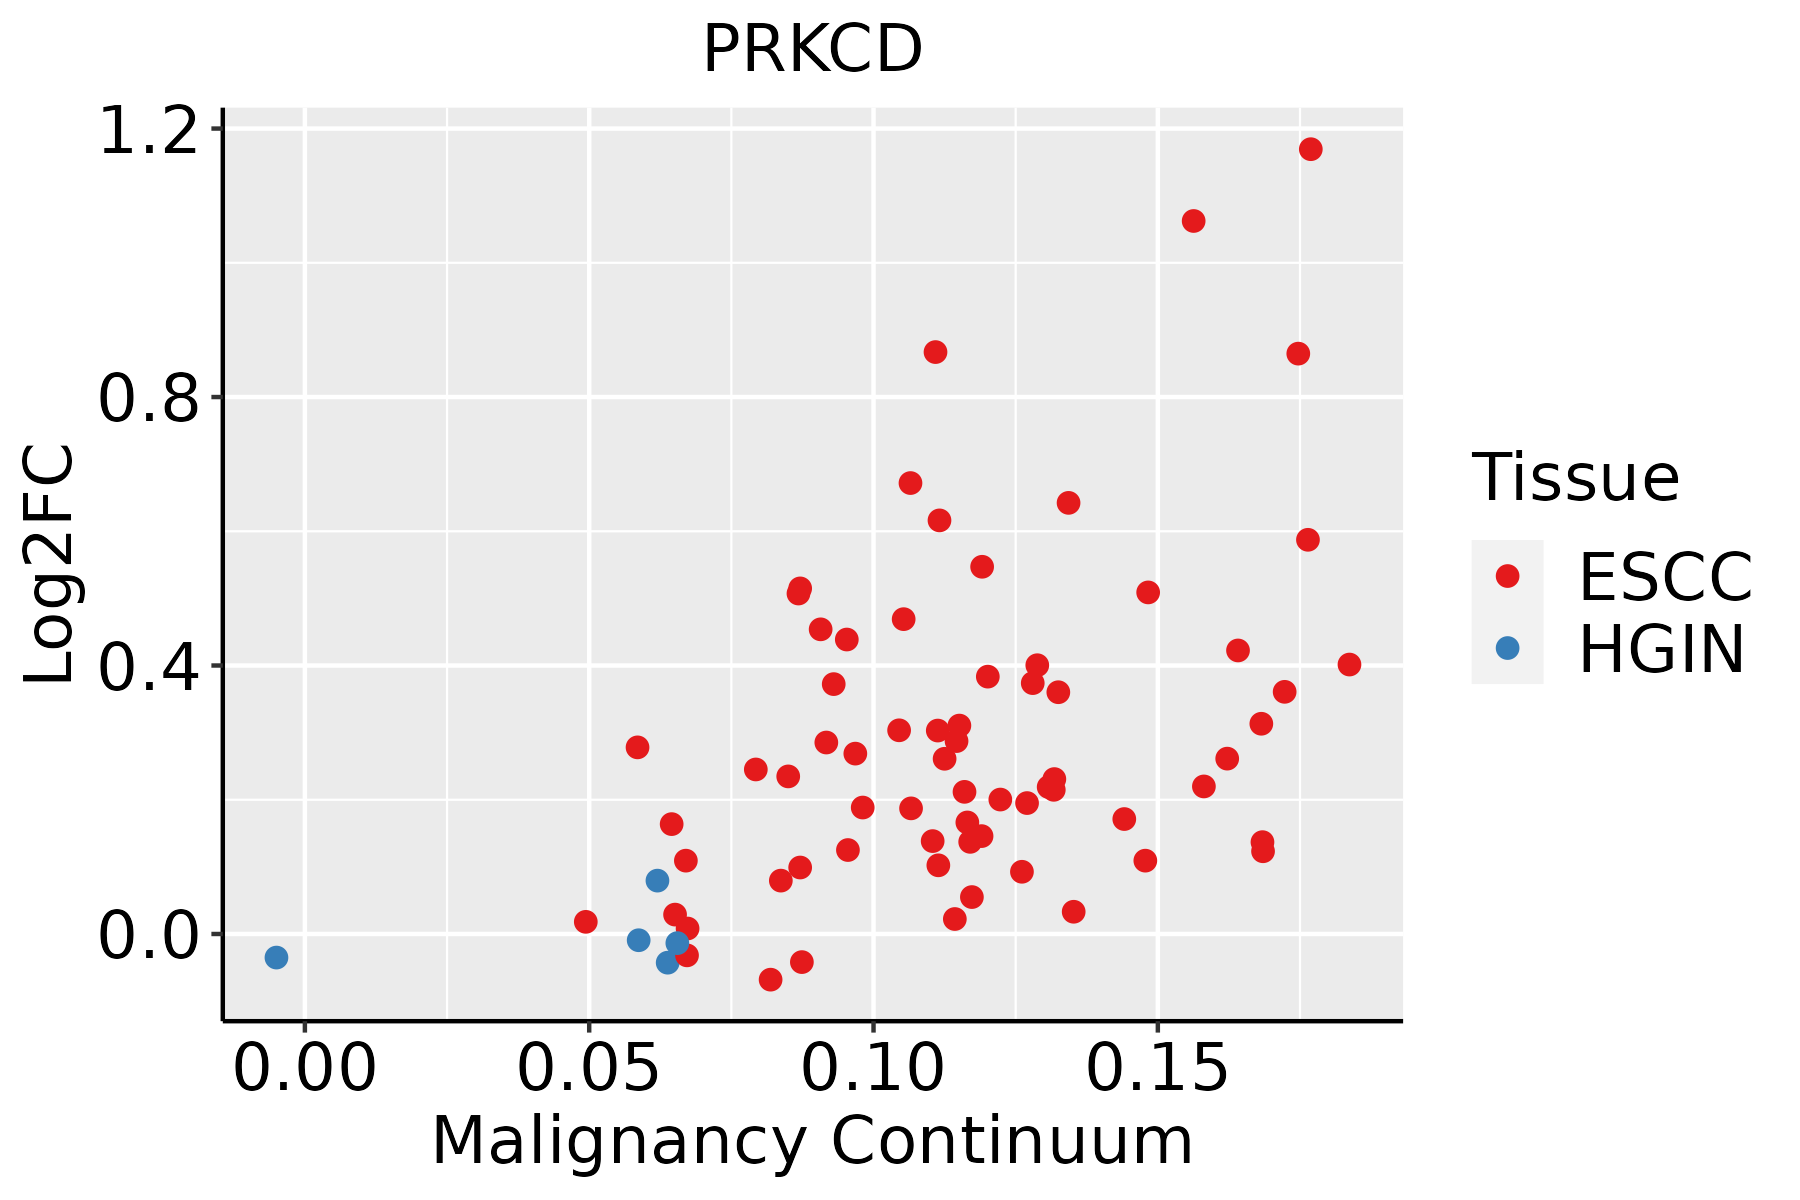 | ESCC: Esophageal squamous cell carcinoma |
| HGIN: High-grade intraepithelial neoplasias | ||
| LGIN: Low-grade intraepithelial neoplasias | ||
| Liver | 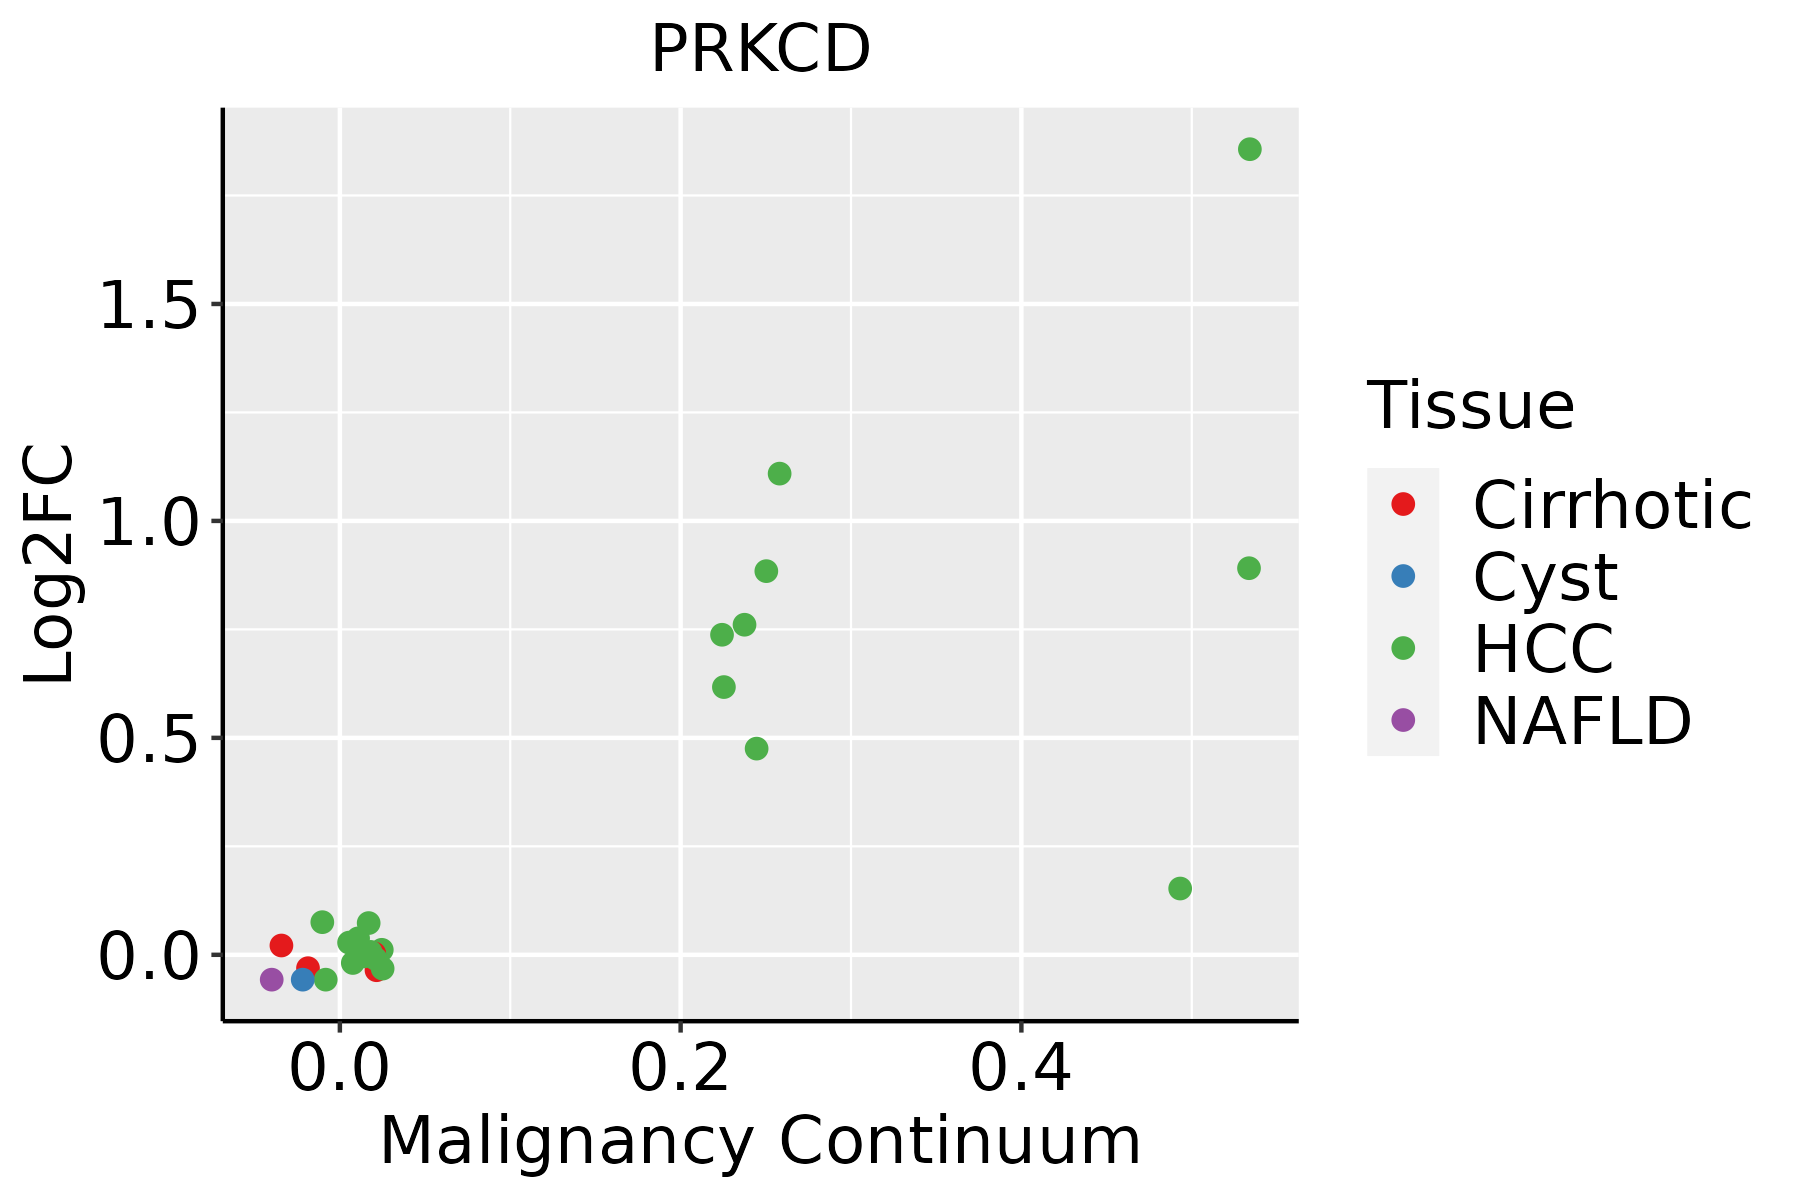 | HCC: Hepatocellular carcinoma |
| NAFLD: Non-alcoholic fatty liver disease | ||
| Oral Cavity | 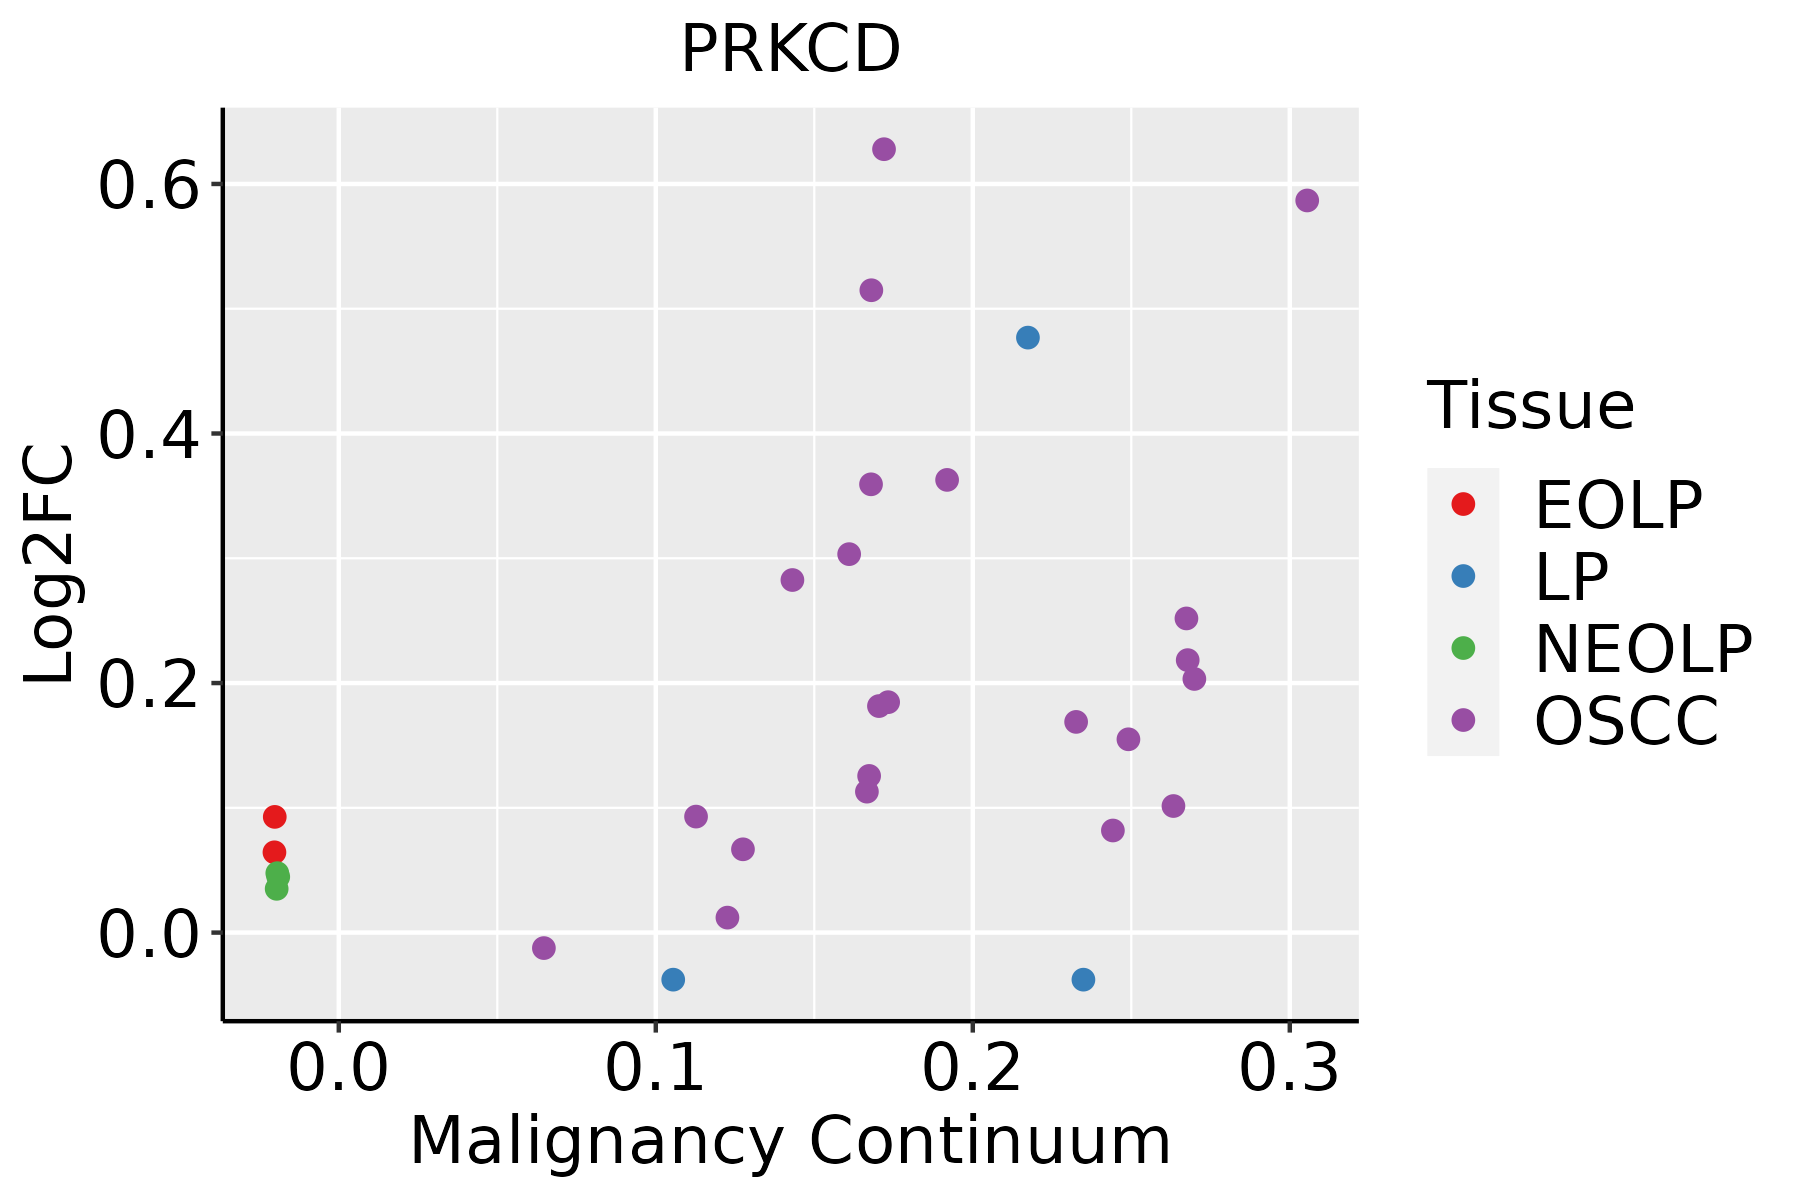 | EOLP: Erosive Oral lichen planus |
| LP: leukoplakia | ||
| NEOLP: Non-erosive oral lichen planus | ||
| OSCC: Oral squamous cell carcinoma | ||
| Thyroid |  | ATC: Anaplastic thyroid cancer |
| HT: Hashimoto's thyroiditis | ||
| PTC: Papillary thyroid cancer |
| ∗log2FC in expression of this searched gene in stem-like cells from each diseased tissue sample relative to stem-like cells in normal samples in each tissue plotted against the malignancy continuum. Samples are colored based on if they are from different disease stage. |
Top |
Malignant transformation related pathway analysis |
| Find out the enriched GO biological processes and KEGG pathways involved in transition from healthy to precancer to cancer |
| Tissue | Disease Stage | Enriched GO biological Processes |
| Colorectum | AD |  |
| Colorectum | SER |  |
| Colorectum | MSS |  |
| Colorectum | MSI-H |  |
| Colorectum | FAP |  |
| ∗Top 15 enriched GO BP terms are showed in the bar plot of each disease state in each tissue. Each row represents a significant GO biological process which is colored according to the -log10(p.adjust). |
| Page: 1 2 3 4 5 6 7 8 9 |
| GO ID | Tissue | Disease Stage | Description | Gene Ratio | Bg Ratio | pvalue | p.adjust | Count |
| GO:003133333 | Thyroid | ATC | negative regulation of protein-containing complex assembly | 71/6293 | 141/18723 | 2.83e-05 | 2.38e-04 | 71 |
| GO:003209119 | Thyroid | ATC | negative regulation of protein binding | 51/6293 | 94/18723 | 2.97e-05 | 2.48e-04 | 51 |
| GO:003206923 | Thyroid | ATC | regulation of nuclease activity | 17/6293 | 22/18723 | 3.47e-05 | 2.84e-04 | 17 |
| GO:001631117 | Thyroid | ATC | dephosphorylation | 179/6293 | 417/18723 | 3.88e-05 | 3.15e-04 | 179 |
| GO:000828618 | Thyroid | ATC | insulin receptor signaling pathway | 60/6293 | 116/18723 | 4.20e-05 | 3.40e-04 | 60 |
| GO:00514892 | Thyroid | ATC | regulation of filopodium assembly | 29/6293 | 47/18723 | 7.37e-05 | 5.60e-04 | 29 |
| GO:200037726 | Thyroid | ATC | regulation of reactive oxygen species metabolic process | 76/6293 | 157/18723 | 8.36e-05 | 6.26e-04 | 76 |
| GO:003410933 | Thyroid | ATC | homotypic cell-cell adhesion | 48/6293 | 90/18723 | 8.92e-05 | 6.59e-04 | 48 |
| GO:009039814 | Thyroid | ATC | cellular senescence | 49/6293 | 93/18723 | 1.13e-04 | 8.08e-04 | 49 |
| GO:000941613 | Thyroid | ATC | response to light stimulus | 139/6293 | 320/18723 | 1.42e-04 | 9.88e-04 | 139 |
| GO:003647326 | Thyroid | ATC | cell death in response to oxidative stress | 49/6293 | 95/18723 | 2.23e-04 | 1.46e-03 | 49 |
| GO:003134514 | Thyroid | ATC | negative regulation of cell projection organization | 86/6293 | 186/18723 | 2.25e-04 | 1.46e-03 | 86 |
| GO:003214711 | Thyroid | ATC | activation of protein kinase activity | 65/6293 | 134/18723 | 2.44e-04 | 1.57e-03 | 65 |
| GO:003530713 | Thyroid | ATC | positive regulation of protein dephosphorylation | 27/6293 | 45/18723 | 2.53e-04 | 1.63e-03 | 27 |
| GO:004340513 | Thyroid | ATC | regulation of MAP kinase activity | 82/6293 | 177/18723 | 2.87e-04 | 1.83e-03 | 82 |
| GO:007190122 | Thyroid | ATC | negative regulation of protein serine/threonine kinase activity | 59/6293 | 120/18723 | 2.95e-04 | 1.87e-03 | 59 |
| GO:007148212 | Thyroid | ATC | cellular response to light stimulus | 60/6293 | 123/18723 | 3.44e-04 | 2.14e-03 | 60 |
| GO:0051494110 | Thyroid | ATC | negative regulation of cytoskeleton organization | 76/6293 | 163/18723 | 3.68e-04 | 2.27e-03 | 76 |
| GO:00468472 | Thyroid | ATC | filopodium assembly | 34/6293 | 62/18723 | 4.66e-04 | 2.74e-03 | 34 |
| GO:200037924 | Thyroid | ATC | positive regulation of reactive oxygen species metabolic process | 40/6293 | 76/18723 | 4.79e-04 | 2.80e-03 | 40 |
| Page: 1 2 3 4 5 6 7 8 9 10 11 12 13 14 15 16 17 18 19 20 21 22 23 24 25 26 27 28 29 30 31 32 33 34 35 36 37 38 39 40 41 42 43 44 45 46 47 48 49 50 51 52 53 54 55 56 57 58 59 60 61 62 |
| Pathway ID | Tissue | Disease Stage | Description | Gene Ratio | Bg Ratio | pvalue | p.adjust | qvalue | Count |
| hsa05208 | Colorectum | AD | Chemical carcinogenesis - reactive oxygen species | 126/2092 | 223/8465 | 1.01e-24 | 1.68e-22 | 1.07e-22 | 126 |
| hsa05415 | Colorectum | AD | Diabetic cardiomyopathy | 114/2092 | 203/8465 | 3.65e-22 | 3.06e-20 | 1.95e-20 | 114 |
| hsa05020 | Colorectum | AD | Prion disease | 133/2092 | 273/8465 | 2.47e-18 | 8.29e-17 | 5.29e-17 | 133 |
| hsa05131 | Colorectum | AD | Shigellosis | 109/2092 | 247/8465 | 1.09e-11 | 2.44e-10 | 1.55e-10 | 109 |
| hsa04666 | Colorectum | AD | Fc gamma R-mediated phagocytosis | 46/2092 | 97/8465 | 9.10e-07 | 1.22e-05 | 7.77e-06 | 46 |
| hsa04722 | Colorectum | AD | Neurotrophin signaling pathway | 50/2092 | 119/8465 | 2.28e-05 | 2.24e-04 | 1.43e-04 | 50 |
| hsa04912 | Colorectum | AD | GnRH signaling pathway | 35/2092 | 93/8465 | 3.69e-03 | 1.90e-02 | 1.21e-02 | 35 |
| hsa04140 | Colorectum | AD | Autophagy - animal | 49/2092 | 141/8465 | 4.58e-03 | 2.20e-02 | 1.40e-02 | 49 |
| hsa052081 | Colorectum | AD | Chemical carcinogenesis - reactive oxygen species | 126/2092 | 223/8465 | 1.01e-24 | 1.68e-22 | 1.07e-22 | 126 |
| hsa054151 | Colorectum | AD | Diabetic cardiomyopathy | 114/2092 | 203/8465 | 3.65e-22 | 3.06e-20 | 1.95e-20 | 114 |
| hsa050201 | Colorectum | AD | Prion disease | 133/2092 | 273/8465 | 2.47e-18 | 8.29e-17 | 5.29e-17 | 133 |
| hsa051311 | Colorectum | AD | Shigellosis | 109/2092 | 247/8465 | 1.09e-11 | 2.44e-10 | 1.55e-10 | 109 |
| hsa046661 | Colorectum | AD | Fc gamma R-mediated phagocytosis | 46/2092 | 97/8465 | 9.10e-07 | 1.22e-05 | 7.77e-06 | 46 |
| hsa047221 | Colorectum | AD | Neurotrophin signaling pathway | 50/2092 | 119/8465 | 2.28e-05 | 2.24e-04 | 1.43e-04 | 50 |
| hsa049121 | Colorectum | AD | GnRH signaling pathway | 35/2092 | 93/8465 | 3.69e-03 | 1.90e-02 | 1.21e-02 | 35 |
| hsa041401 | Colorectum | AD | Autophagy - animal | 49/2092 | 141/8465 | 4.58e-03 | 2.20e-02 | 1.40e-02 | 49 |
| hsa054152 | Colorectum | SER | Diabetic cardiomyopathy | 103/1580 | 203/8465 | 1.45e-25 | 1.61e-23 | 1.17e-23 | 103 |
| hsa050202 | Colorectum | SER | Prion disease | 119/1580 | 273/8465 | 4.61e-22 | 3.06e-20 | 2.22e-20 | 119 |
| hsa052082 | Colorectum | SER | Chemical carcinogenesis - reactive oxygen species | 103/1580 | 223/8465 | 1.60e-21 | 7.57e-20 | 5.50e-20 | 103 |
| hsa051312 | Colorectum | SER | Shigellosis | 87/1580 | 247/8465 | 3.07e-10 | 7.27e-09 | 5.28e-09 | 87 |
| Page: 1 2 3 4 5 6 7 |
Top |
Cell-cell communication analysis |
| Identification of potential cell-cell interactions between two cell types and their ligand-receptor pairs for different disease states |
| Ligand | Receptor | LRpair | Pathway | Tissue | Disease Stage |
| Page: 1 |
Top |
Single-cell gene regulatory network inference analysis |
| Find out the significant the regulons (TFs) and the target genes of each regulon across cell types for different disease states |
| TF | Cell Type | Tissue | Disease Stage | Target Gene | RSS | Regulon Activity |
| ∗The dot plots of a searched regulon are shown for all cell subpopulations in each disease state of each tissue based on the regulon specific score inferred using pySCENIC and by calculating the average expression. |
| Page: 1 |
Top |
Somatic mutation of malignant transformation related genes |
| Annotation of somatic variants for genes involved in malignant transformation |
| Hugo Symbol | Variant Class | Variant Classification | dbSNP RS | HGVSc | HGVSp | HGVSp Short | SWISSPROT | BIOTYPE | SIFT | PolyPhen | Tumor Sample Barcode | Tissue | Histology | Sex | Age | Stage | Therapy Types | Drugs | Outcome |
| PRKCD | SNV | Missense_Mutation | novel | c.1115N>T | p.Gly372Val | p.G372V | Q05655 | protein_coding | deleterious(0.01) | benign(0.342) | TCGA-A2-A25A-01 | Breast | breast invasive carcinoma | Female | <65 | I/II | Unspecific | Cytoxan | SD |
| PRKCD | SNV | Missense_Mutation | novel | c.548A>T | p.Asn183Ile | p.N183I | Q05655 | protein_coding | deleterious(0.03) | probably_damaging(0.985) | TCGA-AN-A0FN-01 | Breast | breast invasive carcinoma | Female | <65 | I/II | Unknown | Unknown | SD |
| PRKCD | SNV | Missense_Mutation | c.1573N>A | p.Tyr525Asn | p.Y525N | Q05655 | protein_coding | deleterious(0) | probably_damaging(1) | TCGA-AR-A24K-01 | Breast | breast invasive carcinoma | Female | <65 | I/II | Unspecific | Paclitaxel | SD | |
| PRKCD | SNV | Missense_Mutation | rs781980599 | c.277N>A | p.Glu93Lys | p.E93K | Q05655 | protein_coding | deleterious(0.02) | benign(0.407) | TCGA-D8-A1J8-01 | Breast | breast invasive carcinoma | Female | >=65 | I/II | Hormone Therapy | nolvadex | SD |
| PRKCD | SNV | Missense_Mutation | novel | c.609N>C | p.Lys203Asn | p.K203N | Q05655 | protein_coding | tolerated(0.21) | possibly_damaging(0.811) | TCGA-D8-A1JA-01 | Breast | breast invasive carcinoma | Female | <65 | III/IV | Chemotherapy | adriamycin | PD |
| PRKCD | insertion | Frame_Shift_Ins | novel | c.1528_1529insAGGAGAAGCAGAGGCTGCTC | p.Gly510GlufsTer21 | p.G510Efs*21 | Q05655 | protein_coding | TCGA-AN-A0FT-01 | Breast | breast invasive carcinoma | Female | <65 | I/II | Unknown | Unknown | SD | ||
| PRKCD | insertion | Frame_Shift_Ins | novel | c.1989_1990insA | p.Ser664IlefsTer22 | p.S664Ifs*22 | Q05655 | protein_coding | TCGA-BH-A0BD-01 | Breast | breast invasive carcinoma | Female | <65 | I/II | Chemotherapy | doxorubicin | SD | ||
| PRKCD | insertion | Nonsense_Mutation | novel | c.1990_1991insTTTAAAATATAAGTTCAGGCCGGGCACAGTGGC | p.Ser664delinsPheTerAsnIleSerSerGlyArgAlaGlnTrpPro | p.S664delinsF*NISSGRAQWP | Q05655 | protein_coding | TCGA-BH-A0BD-01 | Breast | breast invasive carcinoma | Female | <65 | I/II | Chemotherapy | doxorubicin | SD | ||
| PRKCD | SNV | Missense_Mutation | rs149165175 | c.604G>A | p.Asp202Asn | p.D202N | Q05655 | protein_coding | tolerated(0.07) | benign(0.105) | TCGA-2W-A8YY-01 | Cervix | cervical & endocervical cancer | Female | <65 | I/II | Chemotherapy | cisplatin | CR |
| PRKCD | SNV | Missense_Mutation | rs782258819 | c.422N>T | p.Thr141Met | p.T141M | Q05655 | protein_coding | tolerated(0.12) | benign(0.107) | TCGA-EA-A410-01 | Cervix | cervical & endocervical cancer | Female | <65 | I/II | Unknown | Unknown | SD |
| Page: 1 2 3 4 5 6 |
Top |
Related drugs of malignant transformation related genes |
| Identification of chemicals and drugs interact with genes involved in malignant transfromation |
| (DGIdb 4.0) |
| Entrez ID | Symbol | Category | Interaction Types | Drug Claim Name | Drug Name | PMIDs |
| 5580 | PRKCD | ENZYME, DRUGGABLE GENOME, SERINE THREONINE KINASE, KINASE, TRANSCRIPTION FACTOR | TAE-684 | TAE-684 | ||
| 5580 | PRKCD | ENZYME, DRUGGABLE GENOME, SERINE THREONINE KINASE, KINASE, TRANSCRIPTION FACTOR | [3H]-PHORBOL 12,13-DIBUTYRATE | CHEMBL27768 | 24794745 | |
| 5580 | PRKCD | ENZYME, DRUGGABLE GENOME, SERINE THREONINE KINASE, KINASE, TRANSCRIPTION FACTOR | GO-6976 | GO-6976 | ||
| 5580 | PRKCD | ENZYME, DRUGGABLE GENOME, SERINE THREONINE KINASE, KINASE, TRANSCRIPTION FACTOR | ETHANOL | ALCOHOL | 1744136 | |
| 5580 | PRKCD | ENZYME, DRUGGABLE GENOME, SERINE THREONINE KINASE, KINASE, TRANSCRIPTION FACTOR | inhibitor | CHEMBL565612 | SOTRASTAURIN | |
| 5580 | PRKCD | ENZYME, DRUGGABLE GENOME, SERINE THREONINE KINASE, KINASE, TRANSCRIPTION FACTOR | inhibitor | 178101947 | RUBOXISTAURIN | |
| 5580 | PRKCD | ENZYME, DRUGGABLE GENOME, SERINE THREONINE KINASE, KINASE, TRANSCRIPTION FACTOR | ENOXOLONE | ENOXOLONE | 24461294 | |
| 5580 | PRKCD | ENZYME, DRUGGABLE GENOME, SERINE THREONINE KINASE, KINASE, TRANSCRIPTION FACTOR | inhibitor | CHEMBL574737 | UCN-01 | |
| 5580 | PRKCD | ENZYME, DRUGGABLE GENOME, SERINE THREONINE KINASE, KINASE, TRANSCRIPTION FACTOR | KAI-9803 | DELCASERTIB | ||
| 5580 | PRKCD | ENZYME, DRUGGABLE GENOME, SERINE THREONINE KINASE, KINASE, TRANSCRIPTION FACTOR | inhibitor | CHEMBL608533 | MIDOSTAURIN |
| Page: 1 2 3 4 5 |

Copyright 2023-Present -The University of Texas Health Science Center at Houston |