
|
|||||
|
 | |
| |
| |
| |
| |
| |
|
Gene: HNRNPA1 |
Gene summary for HNRNPA1 |
| Gene information | Species | Human | Gene symbol | HNRNPA1 | Gene ID | 3178 |
| Gene name | heterogeneous nuclear ribonucleoprotein A1 | |
| Gene Alias | ALS19 | |
| Cytomap | 12q13.13 | |
| Gene Type | protein-coding | GO ID | GO:0000375 | UniProtAcc | A0A024RB53 |
Top |
Malignant transformation analysis |
| Identification of the aberrant gene expression in precancerous and cancerous lesions by comparing the gene expression of stem-like cells in diseased tissues with normal stem cells |
| Entrez ID | Symbol | Replicates | Species | Organ | Tissue | Adj P-value | Log2FC | Malignancy |
| 3178 | HNRNPA1 | GSM4909281 | Human | Breast | IDC | 4.75e-04 | -1.96e-01 | 0.21 |
| 3178 | HNRNPA1 | GSM4909282 | Human | Breast | IDC | 2.51e-09 | -2.58e-01 | -0.0288 |
| 3178 | HNRNPA1 | GSM4909285 | Human | Breast | IDC | 1.96e-02 | 1.97e-01 | 0.21 |
| 3178 | HNRNPA1 | GSM4909286 | Human | Breast | IDC | 1.58e-04 | 2.46e-01 | 0.1081 |
| 3178 | HNRNPA1 | GSM4909287 | Human | Breast | IDC | 2.77e-20 | -6.03e-01 | 0.2057 |
| 3178 | HNRNPA1 | GSM4909293 | Human | Breast | IDC | 2.11e-26 | -3.29e-01 | 0.1581 |
| 3178 | HNRNPA1 | GSM4909294 | Human | Breast | IDC | 1.30e-26 | -5.98e-01 | 0.2022 |
| 3178 | HNRNPA1 | GSM4909296 | Human | Breast | IDC | 3.73e-22 | -5.79e-01 | 0.1524 |
| 3178 | HNRNPA1 | GSM4909297 | Human | Breast | IDC | 1.98e-21 | -2.41e-01 | 0.1517 |
| 3178 | HNRNPA1 | GSM4909300 | Human | Breast | IDC | 9.51e-04 | 2.04e-01 | 0.0334 |
| 3178 | HNRNPA1 | GSM4909301 | Human | Breast | IDC | 7.57e-42 | -7.04e-01 | 0.1577 |
| 3178 | HNRNPA1 | GSM4909304 | Human | Breast | IDC | 3.39e-39 | -5.83e-01 | 0.1636 |
| 3178 | HNRNPA1 | GSM4909305 | Human | Breast | IDC | 1.25e-10 | 2.71e-01 | 0.0436 |
| 3178 | HNRNPA1 | GSM4909308 | Human | Breast | IDC | 3.32e-08 | 2.23e-01 | 0.158 |
| 3178 | HNRNPA1 | GSM4909309 | Human | Breast | IDC | 3.37e-03 | -1.93e-01 | 0.0483 |
| 3178 | HNRNPA1 | GSM4909311 | Human | Breast | IDC | 5.89e-49 | -5.91e-01 | 0.1534 |
| 3178 | HNRNPA1 | GSM4909312 | Human | Breast | IDC | 1.85e-07 | 1.56e-01 | 0.1552 |
| 3178 | HNRNPA1 | GSM4909313 | Human | Breast | IDC | 5.88e-04 | 5.29e-03 | 0.0391 |
| 3178 | HNRNPA1 | GSM4909315 | Human | Breast | IDC | 3.71e-42 | -7.38e-01 | 0.21 |
| 3178 | HNRNPA1 | GSM4909316 | Human | Breast | IDC | 2.35e-13 | -7.68e-01 | 0.21 |
| Page: 1 2 3 4 5 6 7 8 9 10 11 12 13 14 15 16 17 18 19 |
| Tissue | Expression Dynamics | Abbreviation |
| Breast |  | IDC: Invasive ductal carcinoma |
| DCIS: Ductal carcinoma in situ | ||
| Precancer(BRCA1-mut): Precancerous lesion from BRCA1 mutation carriers | ||
| Cervix | 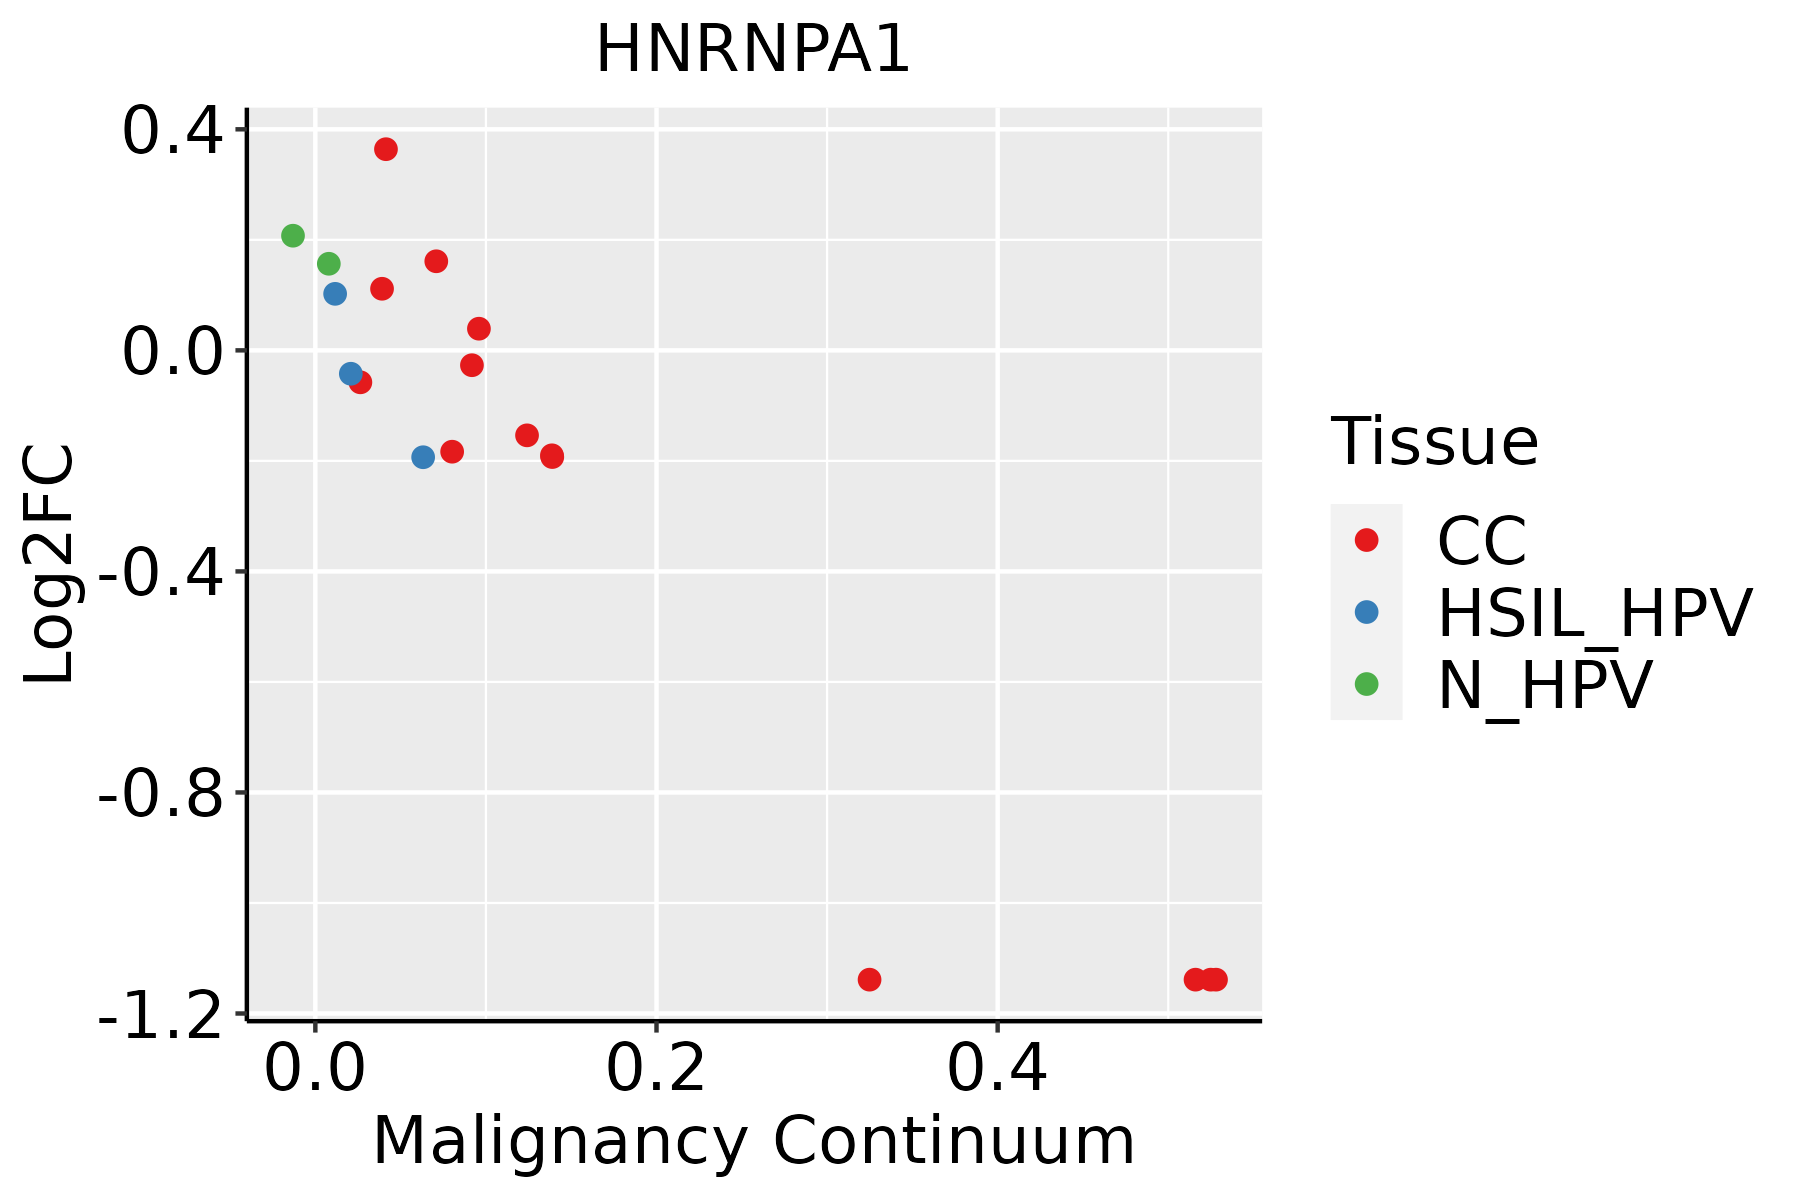 | CC: Cervix cancer |
| HSIL_HPV: HPV-infected high-grade squamous intraepithelial lesions | ||
| N_HPV: HPV-infected normal cervix | ||
| Colorectum (GSE201348) |  | FAP: Familial adenomatous polyposis |
| CRC: Colorectal cancer | ||
| Colorectum (HTA11) |  | AD: Adenomas |
| SER: Sessile serrated lesions | ||
| MSI-H: Microsatellite-high colorectal cancer | ||
| MSS: Microsatellite stable colorectal cancer | ||
| Endometrium |  | AEH: Atypical endometrial hyperplasia |
| EEC: Endometrioid Cancer | ||
| Esophagus |  | ESCC: Esophageal squamous cell carcinoma |
| HGIN: High-grade intraepithelial neoplasias | ||
| LGIN: Low-grade intraepithelial neoplasias | ||
| GC |  | CAG: Chronic atrophic gastritis |
| CAG with IM: Chronic atrophic gastritis with intestinal metaplasia | ||
| CSG: Chronic superficial gastritis | ||
| GC: Gastric cancer | ||
| SIM: Severe intestinal metaplasia | ||
| WIM: Wild intestinal metaplasia | ||
| Liver | 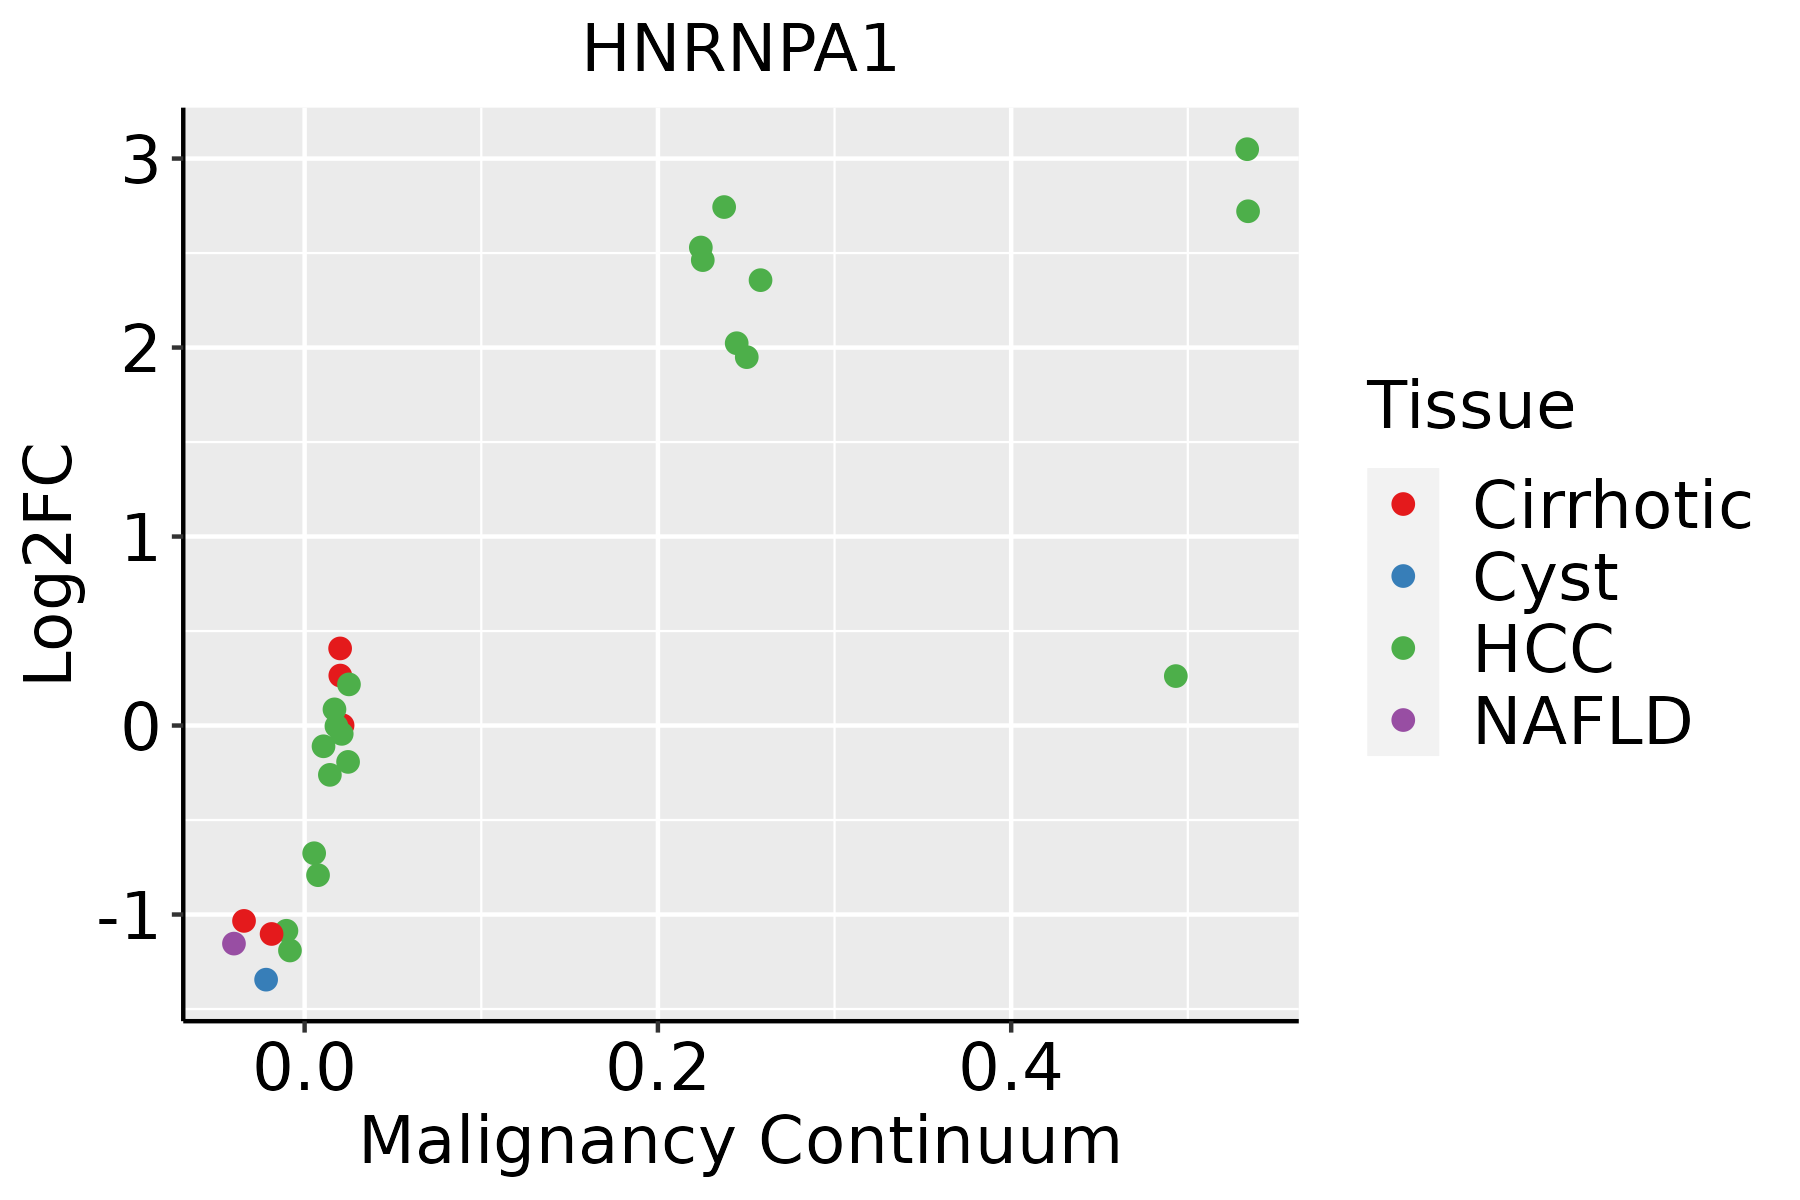 | HCC: Hepatocellular carcinoma |
| NAFLD: Non-alcoholic fatty liver disease | ||
| Lung | 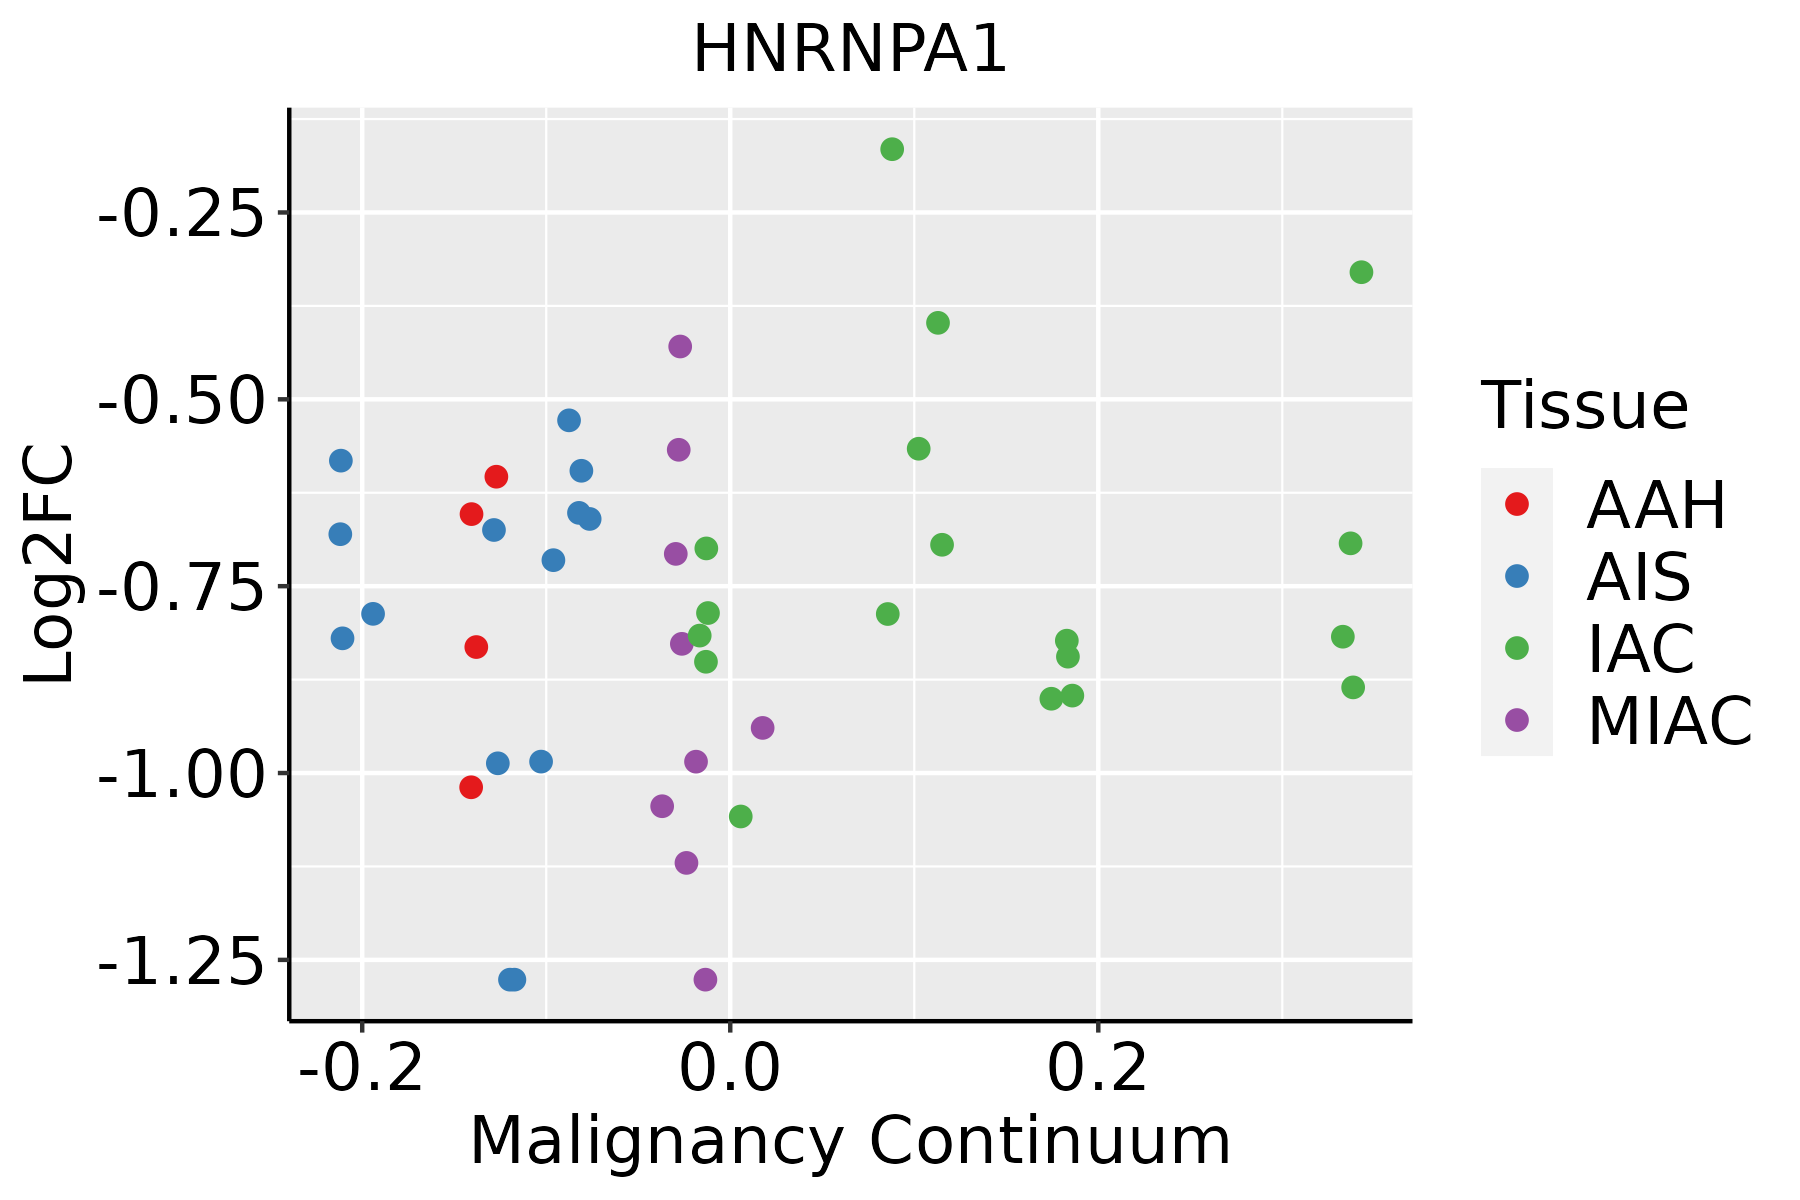 | AAH: Atypical adenomatous hyperplasia |
| AIS: Adenocarcinoma in situ | ||
| IAC: Invasive lung adenocarcinoma | ||
| MIA: Minimally invasive adenocarcinoma | ||
| Oral Cavity | 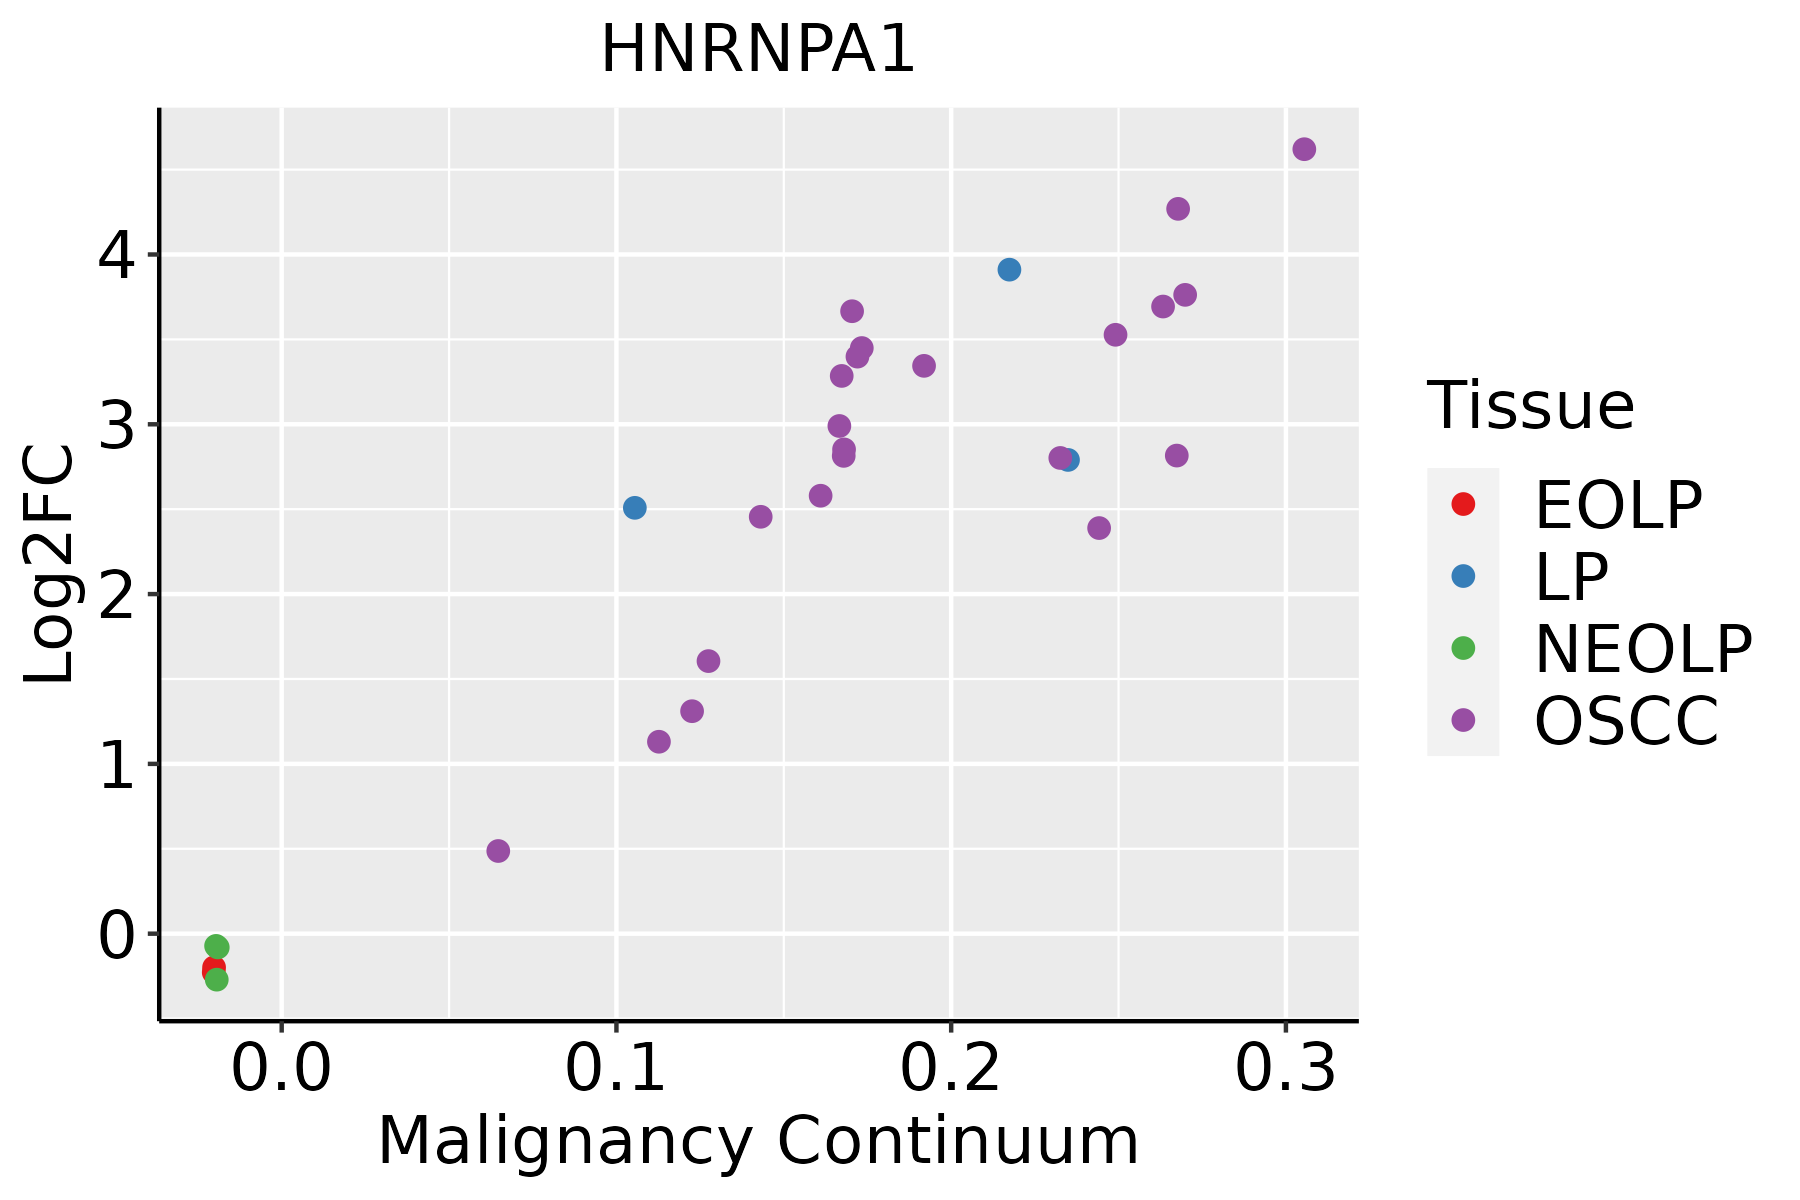 | EOLP: Erosive Oral lichen planus |
| LP: leukoplakia | ||
| NEOLP: Non-erosive oral lichen planus | ||
| OSCC: Oral squamous cell carcinoma | ||
| Prostate |  | BPH: Benign Prostatic Hyperplasia |
| Skin |  | AK: Actinic keratosis |
| cSCC: Cutaneous squamous cell carcinoma | ||
| SCCIS:squamous cell carcinoma in situ | ||
| Thyroid |  | ATC: Anaplastic thyroid cancer |
| HT: Hashimoto's thyroiditis | ||
| PTC: Papillary thyroid cancer |
| ∗log2FC in expression of this searched gene in stem-like cells from each diseased tissue sample relative to stem-like cells in normal samples in each tissue plotted against the malignancy continuum. Samples are colored based on if they are from different disease stage. |
Top |
Malignant transformation related pathway analysis |
| Find out the enriched GO biological processes and KEGG pathways involved in transition from healthy to precancer to cancer |
| Tissue | Disease Stage | Enriched GO biological Processes |
| Colorectum | AD |  |
| Colorectum | SER |  |
| Colorectum | MSS |  |
| Colorectum | MSI-H |  |
| Colorectum | FAP |  |
| ∗Top 15 enriched GO BP terms are showed in the bar plot of each disease state in each tissue. Each row represents a significant GO biological process which is colored according to the -log10(p.adjust). |
| Page: 1 2 3 4 5 6 7 8 9 |
| GO ID | Tissue | Disease Stage | Description | Gene Ratio | Bg Ratio | pvalue | p.adjust | Count |
| GO:000838021 | Stomach | CAG | RNA splicing | 32/552 | 434/18723 | 2.08e-06 | 1.16e-04 | 32 |
| GO:003166731 | Stomach | CAG | response to nutrient levels | 32/552 | 474/18723 | 1.28e-05 | 5.12e-04 | 32 |
| GO:000037721 | Stomach | CAG | RNA splicing, via transesterification reactions with bulged adenosine as nucleophile | 24/552 | 320/18723 | 2.97e-05 | 1.02e-03 | 24 |
| GO:000039821 | Stomach | CAG | mRNA splicing, via spliceosome | 24/552 | 320/18723 | 2.97e-05 | 1.02e-03 | 24 |
| GO:000037521 | Stomach | CAG | RNA splicing, via transesterification reactions | 24/552 | 324/18723 | 3.62e-05 | 1.18e-03 | 24 |
| GO:200027831 | Stomach | CAG | regulation of DNA biosynthetic process | 12/552 | 106/18723 | 6.78e-05 | 1.89e-03 | 12 |
| GO:004348431 | Stomach | CAG | regulation of RNA splicing | 13/552 | 148/18723 | 4.47e-04 | 7.68e-03 | 13 |
| GO:001083321 | Stomach | CAG | telomere maintenance via telomere lengthening | 9/552 | 81/18723 | 6.24e-04 | 1.02e-02 | 9 |
| GO:000691321 | Stomach | CAG | nucleocytoplasmic transport | 20/552 | 301/18723 | 6.50e-04 | 1.05e-02 | 20 |
| GO:005116921 | Stomach | CAG | nuclear transport | 20/552 | 301/18723 | 6.50e-04 | 1.05e-02 | 20 |
| GO:005116831 | Stomach | CAG | nuclear export | 13/552 | 154/18723 | 6.53e-04 | 1.05e-02 | 13 |
| GO:000700421 | Stomach | CAG | telomere maintenance via telomerase | 8/552 | 69/18723 | 9.34e-04 | 1.38e-02 | 8 |
| GO:00062784 | Stomach | CAG | RNA-dependent DNA biosynthetic process | 8/552 | 75/18723 | 1.62e-03 | 1.93e-02 | 8 |
| GO:001063931 | Stomach | CAG | negative regulation of organelle organization | 21/552 | 348/18723 | 1.63e-03 | 1.94e-02 | 21 |
| GO:00064036 | Stomach | CAG | RNA localization | 14/552 | 201/18723 | 2.62e-03 | 2.71e-02 | 14 |
| GO:007189721 | Stomach | CAG | DNA biosynthetic process | 13/552 | 180/18723 | 2.69e-03 | 2.77e-02 | 13 |
| GO:007149631 | Stomach | CAG | cellular response to external stimulus | 19/552 | 320/18723 | 3.17e-03 | 3.09e-02 | 19 |
| GO:200057321 | Stomach | CAG | positive regulation of DNA biosynthetic process | 7/552 | 66/18723 | 3.23e-03 | 3.14e-02 | 7 |
| GO:00322066 | Stomach | CAG | positive regulation of telomere maintenance | 6/552 | 52/18723 | 4.12e-03 | 3.75e-02 | 6 |
| GO:190435831 | Stomach | CAG | positive regulation of telomere maintenance via telomere lengthening | 5/552 | 37/18723 | 4.37e-03 | 3.92e-02 | 5 |
| Page: 1 2 3 4 5 6 7 8 9 10 11 12 13 14 15 16 17 18 19 20 21 22 23 24 25 26 27 28 29 30 31 32 33 34 35 36 37 38 39 40 41 42 43 44 45 46 47 48 49 50 51 52 53 54 55 56 57 58 59 60 61 62 63 64 65 66 67 68 69 70 71 |
| Pathway ID | Tissue | Disease Stage | Description | Gene Ratio | Bg Ratio | pvalue | p.adjust | qvalue | Count |
| hsa0501416 | Breast | Precancer | Amyotrophic lateral sclerosis | 98/684 | 364/8465 | 2.13e-28 | 8.41e-27 | 6.44e-27 | 98 |
| hsa030408 | Breast | Precancer | Spliceosome | 39/684 | 217/8465 | 1.44e-06 | 2.27e-05 | 1.74e-05 | 39 |
| hsa0501417 | Breast | Precancer | Amyotrophic lateral sclerosis | 98/684 | 364/8465 | 2.13e-28 | 8.41e-27 | 6.44e-27 | 98 |
| hsa0304013 | Breast | Precancer | Spliceosome | 39/684 | 217/8465 | 1.44e-06 | 2.27e-05 | 1.74e-05 | 39 |
| hsa0501423 | Breast | IDC | Amyotrophic lateral sclerosis | 102/867 | 364/8465 | 1.29e-22 | 5.22e-21 | 3.91e-21 | 102 |
| hsa0501433 | Breast | IDC | Amyotrophic lateral sclerosis | 102/867 | 364/8465 | 1.29e-22 | 5.22e-21 | 3.91e-21 | 102 |
| hsa0501443 | Breast | DCIS | Amyotrophic lateral sclerosis | 101/846 | 364/8465 | 7.14e-23 | 2.88e-21 | 2.12e-21 | 101 |
| hsa0304043 | Breast | DCIS | Spliceosome | 40/846 | 217/8465 | 8.97e-05 | 8.52e-04 | 6.28e-04 | 40 |
| hsa0501453 | Breast | DCIS | Amyotrophic lateral sclerosis | 101/846 | 364/8465 | 7.14e-23 | 2.88e-21 | 2.12e-21 | 101 |
| hsa0304053 | Breast | DCIS | Spliceosome | 40/846 | 217/8465 | 8.97e-05 | 8.52e-04 | 6.28e-04 | 40 |
| hsa0501418 | Cervix | CC | Amyotrophic lateral sclerosis | 103/1267 | 364/8465 | 1.79e-11 | 4.47e-10 | 2.64e-10 | 103 |
| hsa0501419 | Cervix | CC | Amyotrophic lateral sclerosis | 103/1267 | 364/8465 | 1.79e-11 | 4.47e-10 | 2.64e-10 | 103 |
| hsa0501444 | Cervix | N_HPV | Amyotrophic lateral sclerosis | 41/349 | 364/8465 | 3.11e-09 | 1.06e-07 | 8.26e-08 | 41 |
| hsa0501454 | Cervix | N_HPV | Amyotrophic lateral sclerosis | 41/349 | 364/8465 | 3.11e-09 | 1.06e-07 | 8.26e-08 | 41 |
| hsa05014 | Colorectum | AD | Amyotrophic lateral sclerosis | 164/2092 | 364/8465 | 4.28e-18 | 1.27e-16 | 8.09e-17 | 164 |
| hsa03040 | Colorectum | AD | Spliceosome | 73/2092 | 217/8465 | 1.73e-03 | 9.68e-03 | 6.18e-03 | 73 |
| hsa050141 | Colorectum | AD | Amyotrophic lateral sclerosis | 164/2092 | 364/8465 | 4.28e-18 | 1.27e-16 | 8.09e-17 | 164 |
| hsa030401 | Colorectum | AD | Spliceosome | 73/2092 | 217/8465 | 1.73e-03 | 9.68e-03 | 6.18e-03 | 73 |
| hsa050142 | Colorectum | SER | Amyotrophic lateral sclerosis | 138/1580 | 364/8465 | 9.89e-19 | 2.99e-17 | 2.17e-17 | 138 |
| hsa050143 | Colorectum | SER | Amyotrophic lateral sclerosis | 138/1580 | 364/8465 | 9.89e-19 | 2.99e-17 | 2.17e-17 | 138 |
| Page: 1 2 3 4 5 |
Top |
Cell-cell communication analysis |
| Identification of potential cell-cell interactions between two cell types and their ligand-receptor pairs for different disease states |
| Ligand | Receptor | LRpair | Pathway | Tissue | Disease Stage |
| Page: 1 |
Top |
Single-cell gene regulatory network inference analysis |
| Find out the significant the regulons (TFs) and the target genes of each regulon across cell types for different disease states |
| TF | Cell Type | Tissue | Disease Stage | Target Gene | RSS | Regulon Activity |
| ∗The dot plots of a searched regulon are shown for all cell subpopulations in each disease state of each tissue based on the regulon specific score inferred using pySCENIC and by calculating the average expression. |
| Page: 1 |
Top |
Somatic mutation of malignant transformation related genes |
| Annotation of somatic variants for genes involved in malignant transformation |
| Hugo Symbol | Variant Class | Variant Classification | dbSNP RS | HGVSc | HGVSp | HGVSp Short | SWISSPROT | BIOTYPE | SIFT | PolyPhen | Tumor Sample Barcode | Tissue | Histology | Sex | Age | Stage | Therapy Types | Drugs | Outcome |
| HNRNPA1 | SNV | Missense_Mutation | c.1075N>A | p.Gly359Ser | p.G359S | P09651 | protein_coding | tolerated(0.22) | benign(0.228) | TCGA-A1-A0SK-01 | Breast | breast invasive carcinoma | Female | <65 | I/II | Unknown | Unknown | PD | |
| HNRNPA1 | SNV | Missense_Mutation | novel | c.794N>C | p.Arg265Thr | p.R265T | P09651 | protein_coding | tolerated(0.52) | probably_damaging(0.95) | TCGA-BH-A2L8-01 | Breast | breast invasive carcinoma | Female | <65 | I/II | Chemotherapy | cytoxan | CR |
| HNRNPA1 | deletion | Frame_Shift_Del | novel | c.375_385delNNNNNNNNNNN | p.Phe125LeufsTer4 | p.F125Lfs*4 | P09651 | protein_coding | TCGA-A2-A0EQ-01 | Breast | breast invasive carcinoma | Female | <65 | I/II | Chemotherapy | adriamycin | SD | ||
| HNRNPA1 | SNV | Missense_Mutation | c.82N>A | p.Glu28Lys | p.E28K | P09651 | protein_coding | deleterious(0.03) | possibly_damaging(0.763) | TCGA-C5-A902-01 | Cervix | cervical & endocervical cancer | Female | <65 | I/II | Chemotherapy | cisplatin | SD | |
| HNRNPA1 | SNV | Missense_Mutation | c.80N>G | p.Asp27Gly | p.D27G | P09651 | protein_coding | deleterious(0.02) | possibly_damaging(0.592) | TCGA-AA-A00N-01 | Colorectum | colon adenocarcinoma | Male | >=65 | I/II | Unknown | Unknown | PD | |
| HNRNPA1 | SNV | Missense_Mutation | c.974N>G | p.Phe325Cys | p.F325C | P09651 | protein_coding | deleterious(0.04) | possibly_damaging(0.669) | TCGA-AA-A010-01 | Colorectum | colon adenocarcinoma | Female | <65 | I/II | Chemotherapy | folinic | CR | |
| HNRNPA1 | SNV | Missense_Mutation | novel | c.731N>G | p.Tyr244Cys | p.Y244C | P09651 | protein_coding | tolerated(0.08) | benign(0) | TCGA-CA-6717-01 | Colorectum | colon adenocarcinoma | Male | <65 | I/II | Chemotherapy | oxaliplatin | CR |
| HNRNPA1 | SNV | Missense_Mutation | c.623G>A | p.Gly208Asp | p.G208D | P09651 | protein_coding | tolerated(0.09) | benign(0.006) | TCGA-CK-4951-01 | Colorectum | colon adenocarcinoma | Female | >=65 | I/II | Unknown | Unknown | PD | |
| HNRNPA1 | SNV | Missense_Mutation | c.555N>C | p.Glu185Asp | p.E185D | P09651 | protein_coding | deleterious(0.02) | benign(0.187) | TCGA-CM-6168-01 | Colorectum | colon adenocarcinoma | Female | >=65 | I/II | Unknown | Unknown | SD | |
| HNRNPA1 | SNV | Missense_Mutation | novel | c.266C>T | p.Ala89Val | p.A89V | P09651 | protein_coding | deleterious(0.02) | possibly_damaging(0.553) | TCGA-A5-A0G2-01 | Endometrium | uterine corpus endometrioid carcinoma | Female | <65 | III/IV | Unknown | Unknown | SD |
| Page: 1 2 3 4 5 |
Top |
Related drugs of malignant transformation related genes |
| Identification of chemicals and drugs interact with genes involved in malignant transfromation |
| (DGIdb 4.0) |
| Entrez ID | Symbol | Category | Interaction Types | Drug Claim Name | Drug Name | PMIDs |
| 3178 | HNRNPA1 | DRUGGABLE GENOME | CAMPTOTHECIN | CAMPTOTHECIN | 22071521 |
| Page: 1 |

Copyright 2023-Present -The University of Texas Health Science Center at Houston |