
|
|||||
|
 | |
| |
| |
| |
| |
| |
|
Gene: TGFB1 |
Gene summary for TGFB1 |
| Gene information | Species | Human | Gene symbol | TGFB1 | Gene ID | 7040 |
| Gene name | transforming growth factor beta 1 | |
| Gene Alias | CED | |
| Cytomap | 19q13.2 | |
| Gene Type | protein-coding | GO ID | GO:0000018 | UniProtAcc | P01137 |
Top |
Malignant transformation analysis |
| Identification of the aberrant gene expression in precancerous and cancerous lesions by comparing the gene expression of stem-like cells in diseased tissues with normal stem cells |
| Entrez ID | Symbol | Replicates | Species | Organ | Tissue | Adj P-value | Log2FC | Malignancy |
| 7040 | TGFB1 | LZE4T | Human | Esophagus | ESCC | 1.43e-05 | 2.58e-01 | 0.0811 |
| 7040 | TGFB1 | LZE20T | Human | Esophagus | ESCC | 6.37e-06 | 3.69e-01 | 0.0662 |
| 7040 | TGFB1 | LZE22D1 | Human | Esophagus | HGIN | 1.14e-03 | 1.78e-01 | 0.0595 |
| 7040 | TGFB1 | LZE22T | Human | Esophagus | ESCC | 3.87e-10 | 7.23e-01 | 0.068 |
| 7040 | TGFB1 | LZE24T | Human | Esophagus | ESCC | 2.12e-38 | 1.17e+00 | 0.0596 |
| 7040 | TGFB1 | LZE21T | Human | Esophagus | ESCC | 9.25e-05 | 5.08e-01 | 0.0655 |
| 7040 | TGFB1 | P1T-E | Human | Esophagus | ESCC | 4.83e-08 | 6.50e-01 | 0.0875 |
| 7040 | TGFB1 | P2T-E | Human | Esophagus | ESCC | 5.15e-08 | 1.12e-01 | 0.1177 |
| 7040 | TGFB1 | P4T-E | Human | Esophagus | ESCC | 9.88e-33 | 7.78e-01 | 0.1323 |
| 7040 | TGFB1 | P5T-E | Human | Esophagus | ESCC | 4.15e-27 | 5.74e-01 | 0.1327 |
| 7040 | TGFB1 | P8T-E | Human | Esophagus | ESCC | 9.16e-24 | 5.53e-01 | 0.0889 |
| 7040 | TGFB1 | P9T-E | Human | Esophagus | ESCC | 4.33e-12 | 3.66e-01 | 0.1131 |
| 7040 | TGFB1 | P10T-E | Human | Esophagus | ESCC | 2.54e-21 | 4.23e-01 | 0.116 |
| 7040 | TGFB1 | P11T-E | Human | Esophagus | ESCC | 1.78e-27 | 1.14e+00 | 0.1426 |
| 7040 | TGFB1 | P12T-E | Human | Esophagus | ESCC | 1.01e-20 | 4.48e-01 | 0.1122 |
| 7040 | TGFB1 | P15T-E | Human | Esophagus | ESCC | 2.41e-37 | 7.87e-01 | 0.1149 |
| 7040 | TGFB1 | P16T-E | Human | Esophagus | ESCC | 1.21e-04 | 1.65e-01 | 0.1153 |
| 7040 | TGFB1 | P17T-E | Human | Esophagus | ESCC | 8.42e-19 | 8.11e-01 | 0.1278 |
| 7040 | TGFB1 | P19T-E | Human | Esophagus | ESCC | 2.47e-04 | 4.32e-01 | 0.1662 |
| 7040 | TGFB1 | P20T-E | Human | Esophagus | ESCC | 3.03e-33 | 7.74e-01 | 0.1124 |
| Page: 1 2 3 4 5 6 |
| Tissue | Expression Dynamics | Abbreviation |
| Esophagus |  | ESCC: Esophageal squamous cell carcinoma |
| HGIN: High-grade intraepithelial neoplasias | ||
| LGIN: Low-grade intraepithelial neoplasias | ||
| Liver | 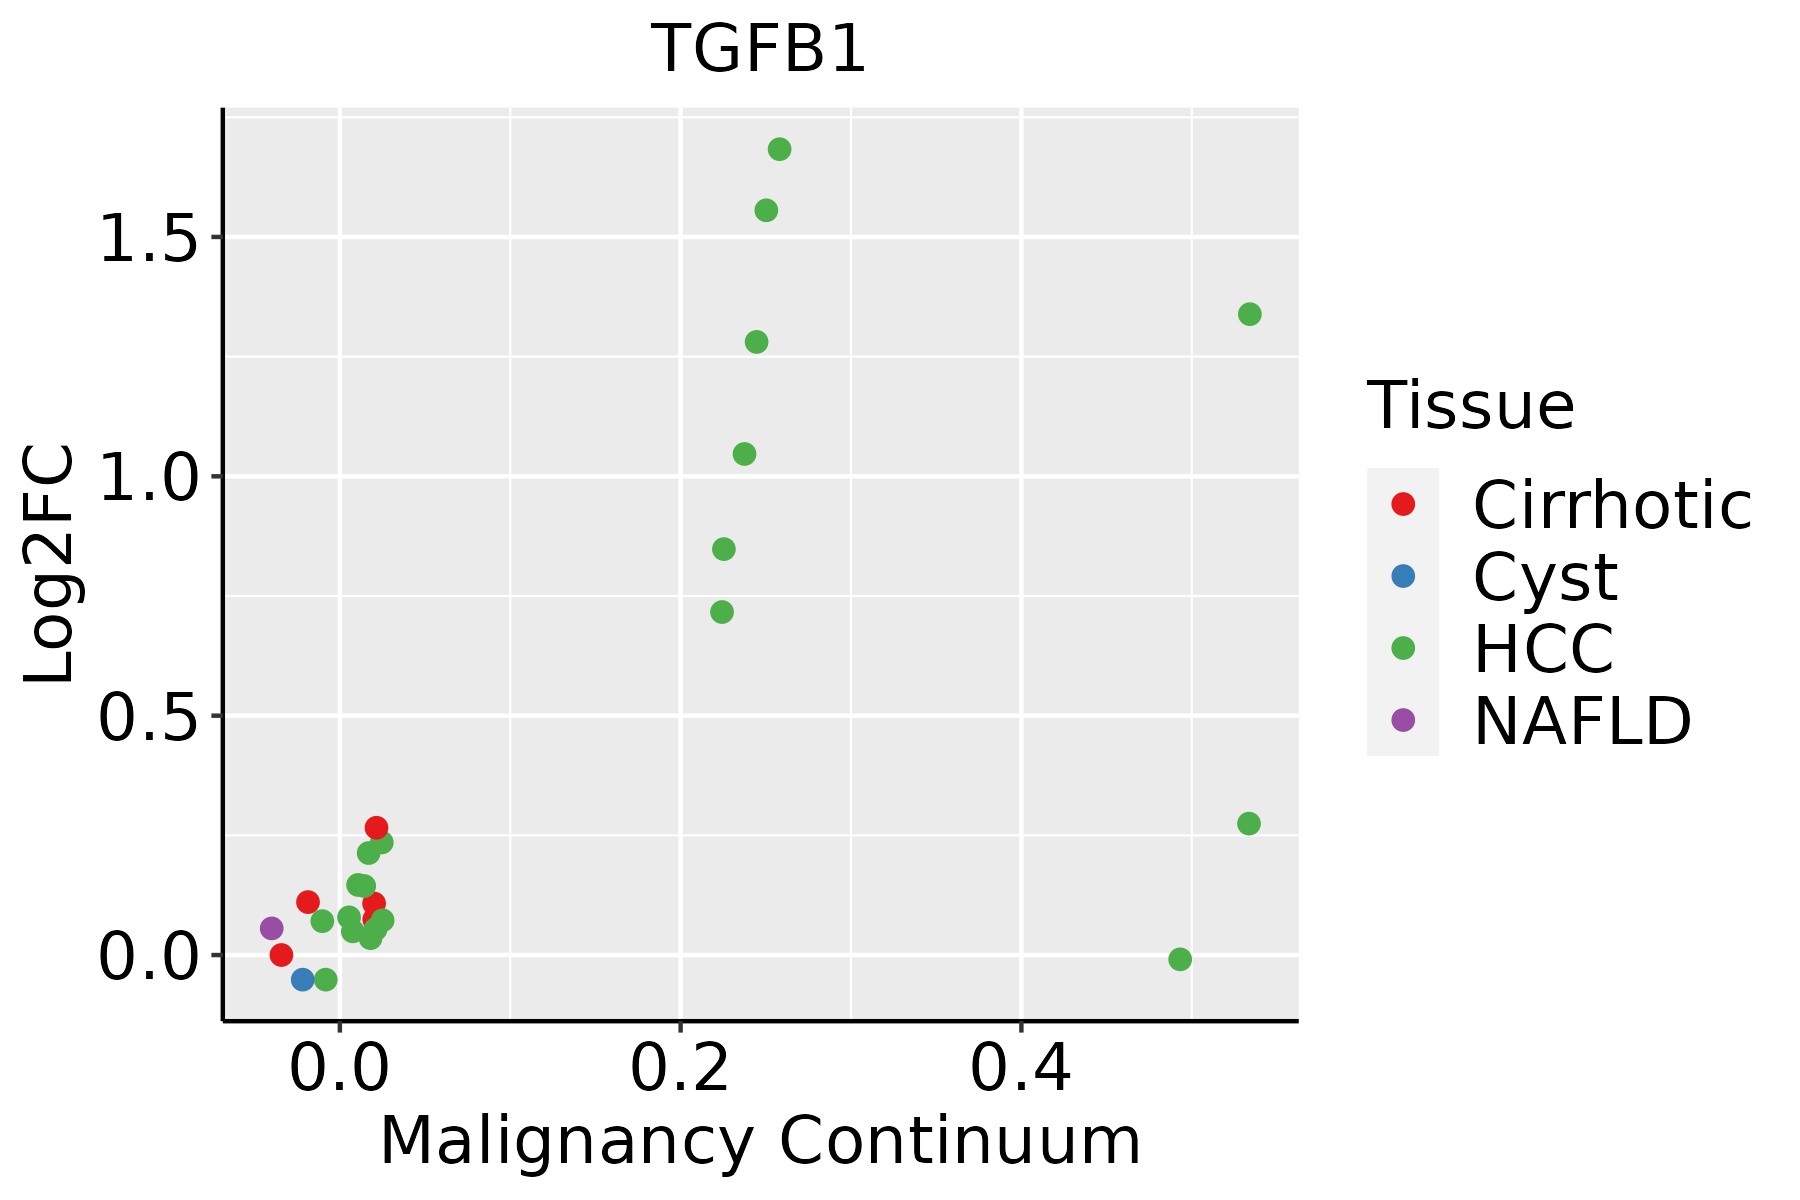 | HCC: Hepatocellular carcinoma |
| NAFLD: Non-alcoholic fatty liver disease | ||
| Oral Cavity | 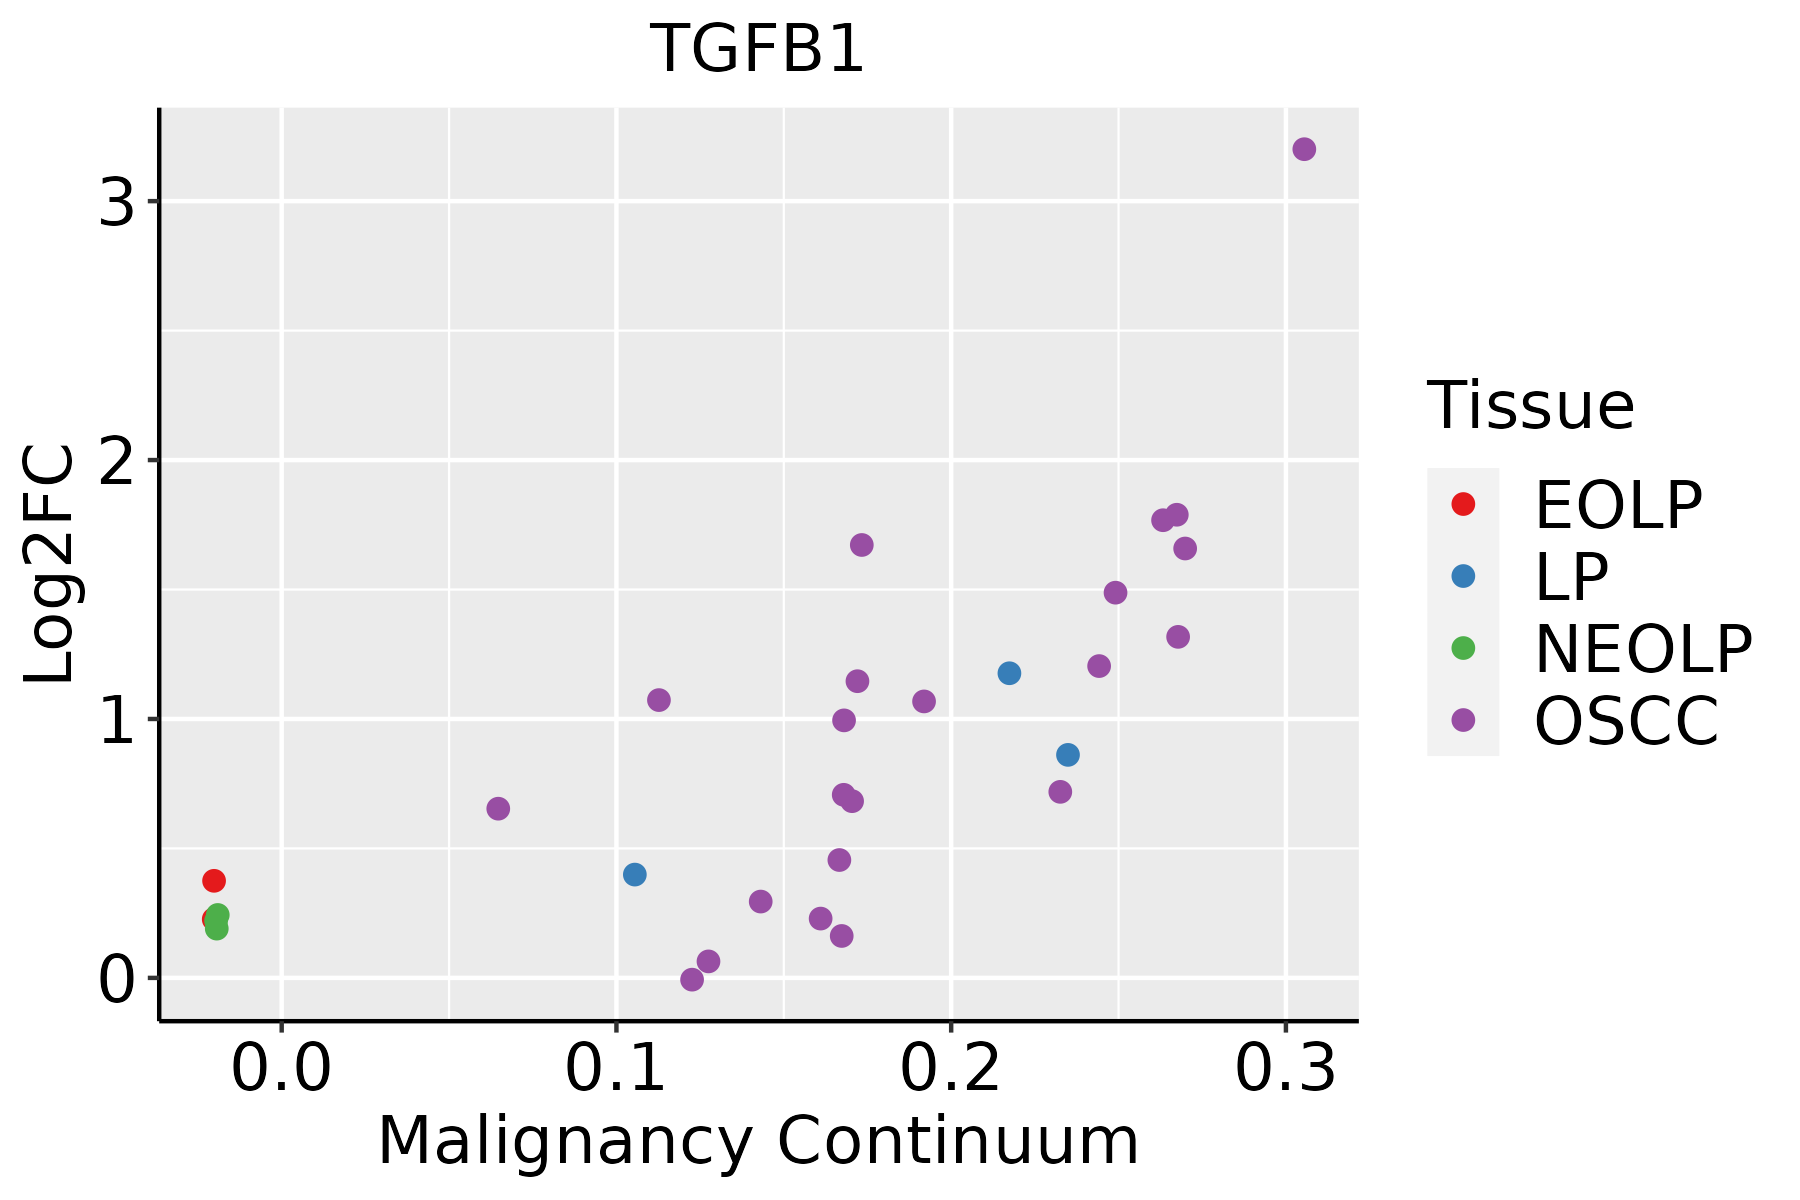 | EOLP: Erosive Oral lichen planus |
| LP: leukoplakia | ||
| NEOLP: Non-erosive oral lichen planus | ||
| OSCC: Oral squamous cell carcinoma | ||
| Skin | 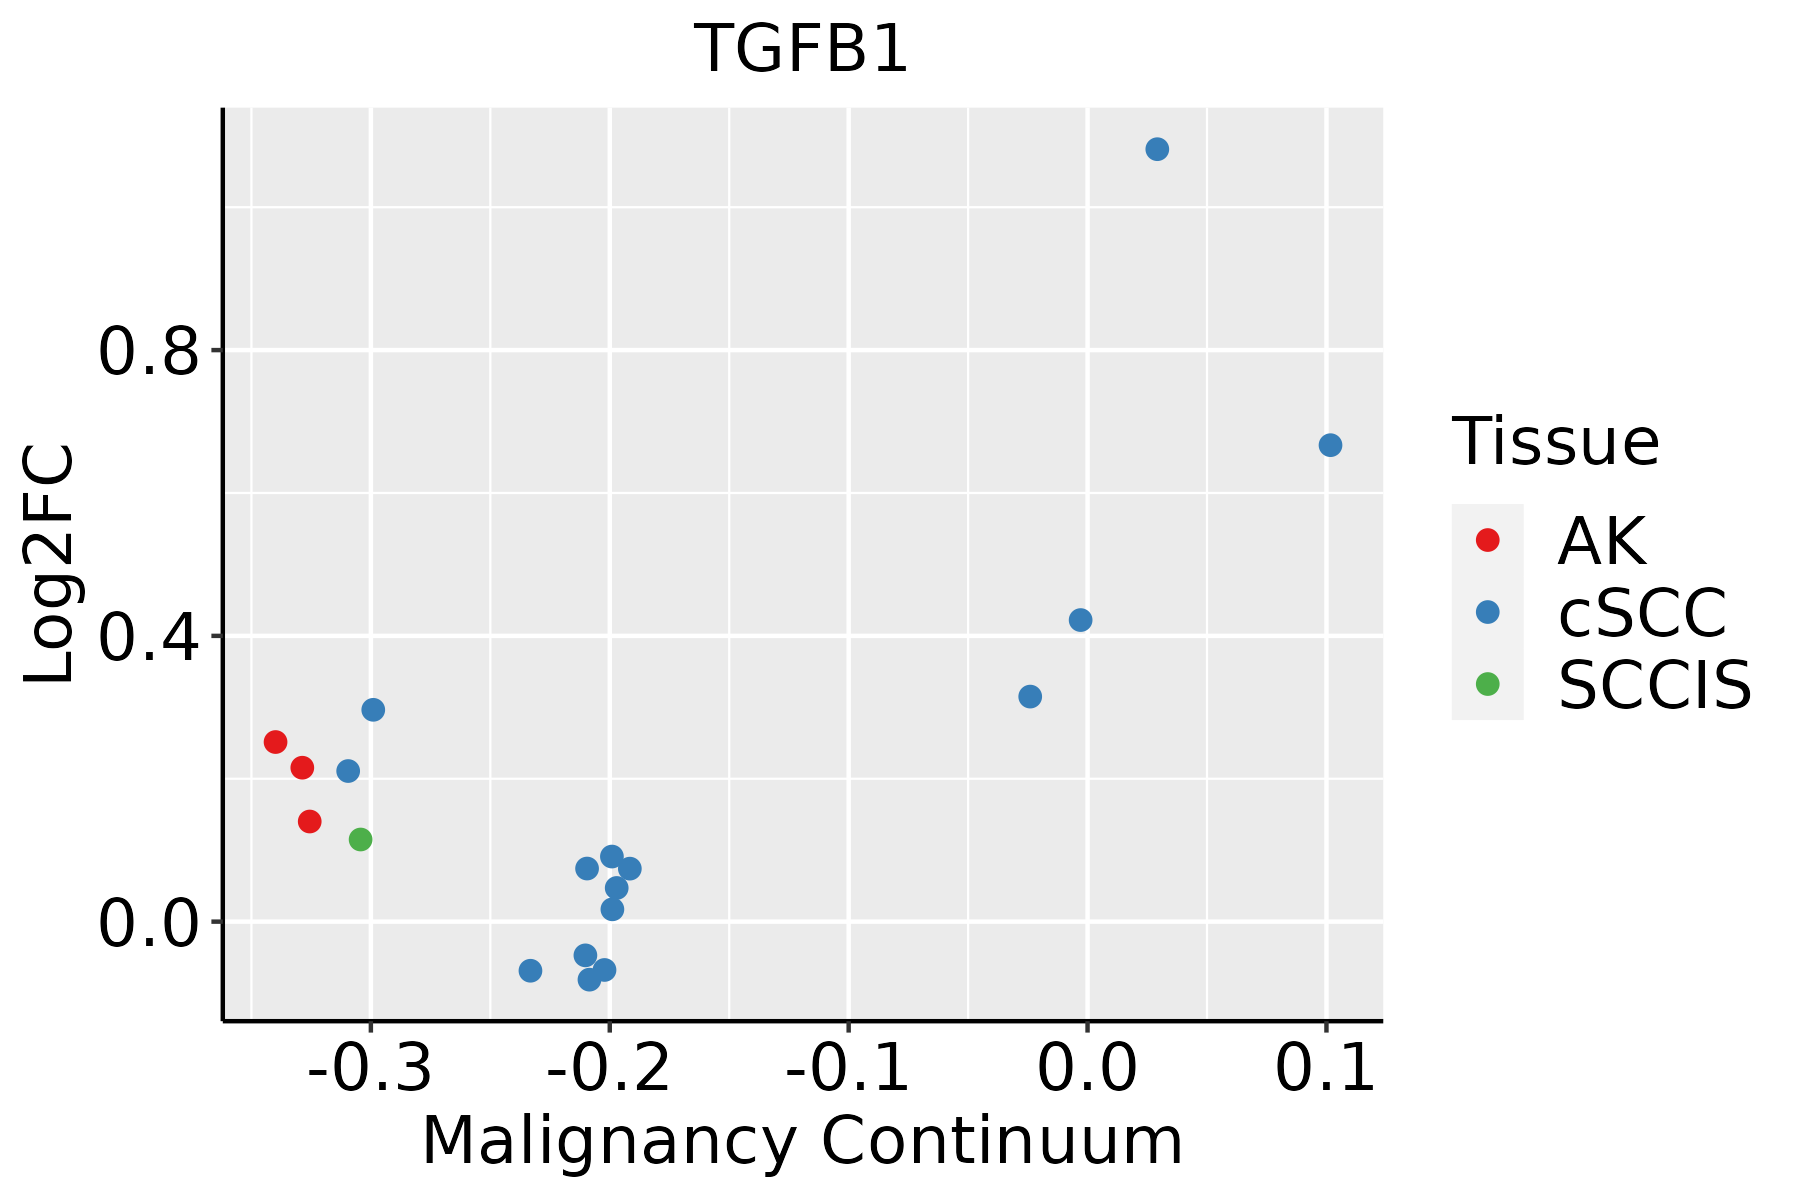 | AK: Actinic keratosis |
| cSCC: Cutaneous squamous cell carcinoma | ||
| SCCIS:squamous cell carcinoma in situ | ||
| Thyroid | 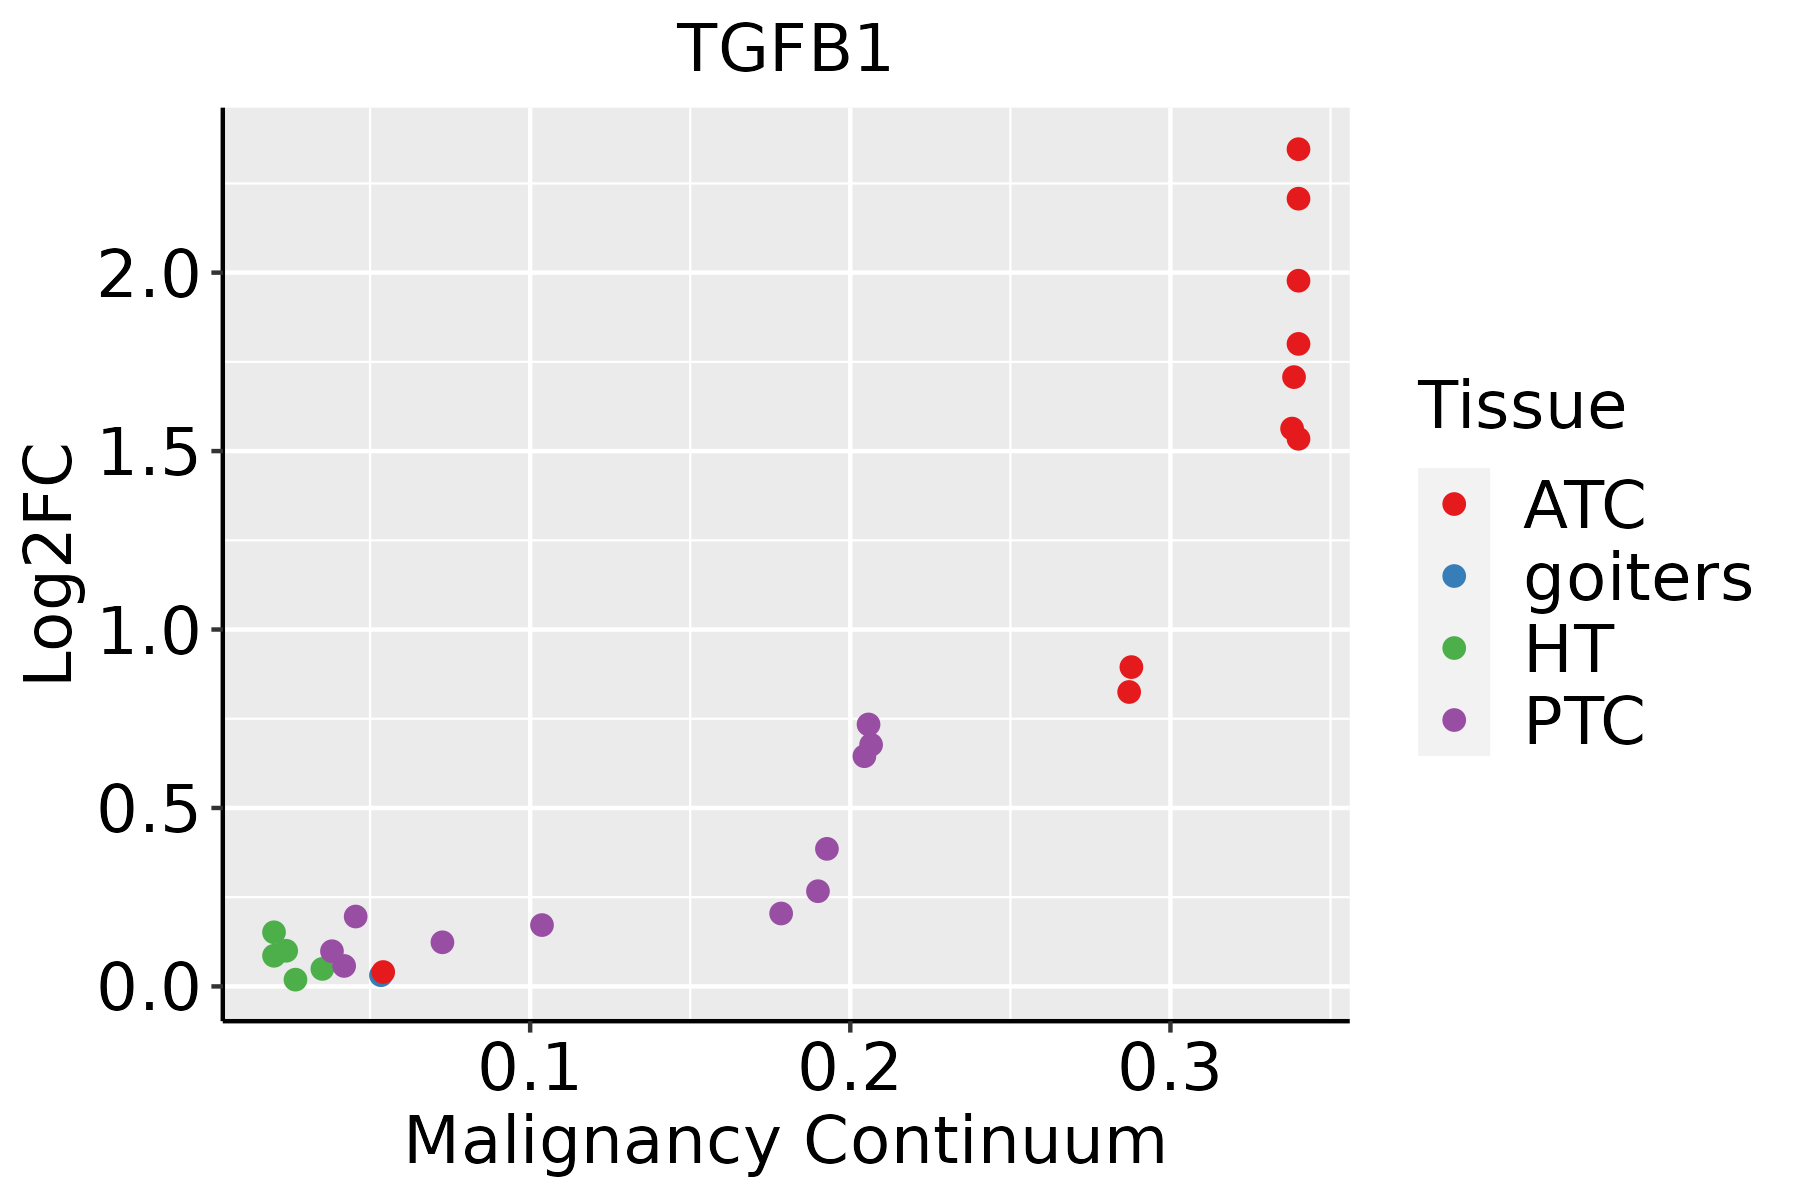 | ATC: Anaplastic thyroid cancer |
| HT: Hashimoto's thyroiditis | ||
| PTC: Papillary thyroid cancer |
| ∗log2FC in expression of this searched gene in stem-like cells from each diseased tissue sample relative to stem-like cells in normal samples in each tissue plotted against the malignancy continuum. Samples are colored based on if they are from different disease stage. |
Top |
Malignant transformation related pathway analysis |
| Find out the enriched GO biological processes and KEGG pathways involved in transition from healthy to precancer to cancer |
| Tissue | Disease Stage | Enriched GO biological Processes |
| Colorectum | AD |  |
| Colorectum | SER |  |
| Colorectum | MSS |  |
| Colorectum | MSI-H |  |
| Colorectum | FAP |  |
| ∗Top 15 enriched GO BP terms are showed in the bar plot of each disease state in each tissue. Each row represents a significant GO biological process which is colored according to the -log10(p.adjust). |
| Page: 1 2 3 4 5 6 7 8 9 |
| GO ID | Tissue | Disease Stage | Description | Gene Ratio | Bg Ratio | pvalue | p.adjust | Count |
| GO:005189714 | Oral cavity | EOLP | positive regulation of protein kinase B signaling | 26/2218 | 120/18723 | 1.57e-03 | 1.05e-02 | 26 |
| GO:00507301 | Oral cavity | EOLP | regulation of peptidyl-tyrosine phosphorylation | 48/2218 | 264/18723 | 1.61e-03 | 1.08e-02 | 48 |
| GO:00331381 | Oral cavity | EOLP | positive regulation of peptidyl-serine phosphorylation | 24/2218 | 108/18723 | 1.62e-03 | 1.08e-02 | 24 |
| GO:00181081 | Oral cavity | EOLP | peptidyl-tyrosine phosphorylation | 64/2218 | 375/18723 | 1.65e-03 | 1.09e-02 | 64 |
| GO:004338817 | Oral cavity | EOLP | positive regulation of DNA binding | 15/2218 | 56/18723 | 1.73e-03 | 1.14e-02 | 15 |
| GO:00075176 | Oral cavity | EOLP | muscle organ development | 57/2218 | 327/18723 | 1.76e-03 | 1.15e-02 | 57 |
| GO:00024433 | Oral cavity | EOLP | leukocyte mediated immunity | 73/2218 | 440/18723 | 1.78e-03 | 1.16e-02 | 73 |
| GO:005076912 | Oral cavity | EOLP | positive regulation of neurogenesis | 42/2218 | 225/18723 | 1.83e-03 | 1.19e-02 | 42 |
| GO:004230721 | Oral cavity | EOLP | positive regulation of protein import into nucleus | 12/2218 | 41/18723 | 2.16e-03 | 1.35e-02 | 12 |
| GO:00107621 | Oral cavity | EOLP | regulation of fibroblast migration | 11/2218 | 36/18723 | 2.24e-03 | 1.39e-02 | 11 |
| GO:000718311 | Oral cavity | EOLP | SMAD protein complex assembly | 6/2218 | 13/18723 | 2.24e-03 | 1.39e-02 | 6 |
| GO:190382821 | Oral cavity | EOLP | negative regulation of cellular protein localization | 25/2218 | 117/18723 | 2.33e-03 | 1.43e-02 | 25 |
| GO:00900924 | Oral cavity | EOLP | regulation of transmembrane receptor protein serine/threonine kinase signaling pathway | 46/2218 | 256/18723 | 2.53e-03 | 1.53e-02 | 46 |
| GO:004544415 | Oral cavity | EOLP | fat cell differentiation | 42/2218 | 229/18723 | 2.58e-03 | 1.56e-02 | 42 |
| GO:007122222 | Oral cavity | EOLP | cellular response to lipopolysaccharide | 39/2218 | 209/18723 | 2.62e-03 | 1.58e-02 | 39 |
| GO:005071415 | Oral cavity | EOLP | positive regulation of protein secretion | 28/2218 | 137/18723 | 2.65e-03 | 1.59e-02 | 28 |
| GO:000238112 | Oral cavity | EOLP | immunoglobulin production involved in immunoglobulin-mediated immune response | 17/2218 | 70/18723 | 2.78e-03 | 1.66e-02 | 17 |
| GO:00435364 | Oral cavity | EOLP | positive regulation of blood vessel endothelial cell migration | 18/2218 | 76/18723 | 2.85e-03 | 1.69e-02 | 18 |
| GO:200037923 | Oral cavity | EOLP | positive regulation of reactive oxygen species metabolic process | 18/2218 | 76/18723 | 2.85e-03 | 1.69e-02 | 18 |
| GO:0002700 | Oral cavity | EOLP | regulation of production of molecular mediator of immune response | 32/2218 | 164/18723 | 2.98e-03 | 1.75e-02 | 32 |
| Page: 1 2 3 4 5 6 7 8 9 10 11 12 13 14 15 16 17 18 19 20 21 22 23 24 25 26 27 28 29 30 31 32 33 34 35 36 37 38 39 40 41 42 43 44 45 46 47 48 49 50 51 52 53 54 55 56 57 58 59 60 61 62 63 64 65 66 67 68 69 70 71 72 73 74 75 76 77 78 79 80 81 82 83 84 85 86 87 88 89 90 91 92 93 94 95 96 |
| Pathway ID | Tissue | Disease Stage | Description | Gene Ratio | Bg Ratio | pvalue | p.adjust | qvalue | Count |
| hsa0541530 | Esophagus | HGIN | Diabetic cardiomyopathy | 80/1383 | 203/8465 | 1.35e-15 | 3.38e-14 | 2.69e-14 | 80 |
| hsa0493230 | Esophagus | HGIN | Non-alcoholic fatty liver disease | 66/1383 | 155/8465 | 5.21e-15 | 1.21e-13 | 9.64e-14 | 66 |
| hsa0421828 | Esophagus | HGIN | Cellular senescence | 42/1383 | 156/8465 | 4.94e-04 | 5.03e-03 | 4.00e-03 | 42 |
| hsa0516639 | Esophagus | HGIN | Human T-cell leukemia virus 1 infection | 51/1383 | 222/8465 | 5.84e-03 | 4.05e-02 | 3.22e-02 | 51 |
| hsa0520528 | Esophagus | HGIN | Proteoglycans in cancer | 47/1383 | 205/8465 | 8.23e-03 | 4.71e-02 | 3.74e-02 | 47 |
| hsa05415114 | Esophagus | HGIN | Diabetic cardiomyopathy | 80/1383 | 203/8465 | 1.35e-15 | 3.38e-14 | 2.69e-14 | 80 |
| hsa04932113 | Esophagus | HGIN | Non-alcoholic fatty liver disease | 66/1383 | 155/8465 | 5.21e-15 | 1.21e-13 | 9.64e-14 | 66 |
| hsa04218111 | Esophagus | HGIN | Cellular senescence | 42/1383 | 156/8465 | 4.94e-04 | 5.03e-03 | 4.00e-03 | 42 |
| hsa05166114 | Esophagus | HGIN | Human T-cell leukemia virus 1 infection | 51/1383 | 222/8465 | 5.84e-03 | 4.05e-02 | 3.22e-02 | 51 |
| hsa05205112 | Esophagus | HGIN | Proteoglycans in cancer | 47/1383 | 205/8465 | 8.23e-03 | 4.71e-02 | 3.74e-02 | 47 |
| hsa0411023 | Esophagus | ESCC | Cell cycle | 126/4205 | 157/8465 | 1.34e-15 | 5.60e-14 | 2.87e-14 | 126 |
| hsa04932210 | Esophagus | ESCC | Non-alcoholic fatty liver disease | 122/4205 | 155/8465 | 5.69e-14 | 1.59e-12 | 8.14e-13 | 122 |
| hsa05166211 | Esophagus | ESCC | Human T-cell leukemia virus 1 infection | 164/4205 | 222/8465 | 8.13e-14 | 2.09e-12 | 1.07e-12 | 164 |
| hsa0421829 | Esophagus | ESCC | Cellular senescence | 119/4205 | 156/8465 | 5.89e-12 | 9.40e-11 | 4.81e-11 | 119 |
| hsa05415211 | Esophagus | ESCC | Diabetic cardiomyopathy | 146/4205 | 203/8465 | 5.81e-11 | 7.78e-10 | 3.99e-10 | 146 |
| hsa0521020 | Esophagus | ESCC | Colorectal cancer | 69/4205 | 86/8465 | 4.06e-09 | 4.13e-08 | 2.11e-08 | 69 |
| hsa0521216 | Esophagus | ESCC | Pancreatic cancer | 62/4205 | 76/8465 | 7.37e-09 | 6.85e-08 | 3.51e-08 | 62 |
| hsa0522020 | Esophagus | ESCC | Chronic myeloid leukemia | 61/4205 | 76/8465 | 3.20e-08 | 2.68e-07 | 1.37e-07 | 61 |
| hsa0520529 | Esophagus | ESCC | Proteoglycans in cancer | 138/4205 | 205/8465 | 1.79e-07 | 1.40e-06 | 7.15e-07 | 138 |
| hsa0493310 | Esophagus | ESCC | AGE-RAGE signaling pathway in diabetic complications | 72/4205 | 100/8465 | 4.15e-06 | 2.28e-05 | 1.17e-05 | 72 |
| Page: 1 2 3 4 5 6 7 8 9 10 11 |
Top |
Cell-cell communication analysis |
| Identification of potential cell-cell interactions between two cell types and their ligand-receptor pairs for different disease states |
| Ligand | Receptor | LRpair | Pathway | Tissue | Disease Stage |
| TGFB1 | TGFbR1_R2 | TGFB1_TGFBR1_TGFBR2 | TGFb | Breast | ADJ |
| TGFB1 | TGFbR1_R2 | TGFB1_TGFBR1_TGFBR2 | TGFb | Breast | DCIS |
| TGFB1 | ACVR1_TGFbR | TGFB1_ACVR1_TGFBR1 | TGFb | Breast | DCIS |
| TGFB1 | TGFbR1_R2 | TGFB1_TGFBR1_TGFBR2 | TGFb | Breast | IDC |
| TGFB1 | TGFbR1_R2 | TGFB1_TGFBR1_TGFBR2 | TGFb | Cervix | CC |
| TGFB1 | ACVR1_TGFbR | TGFB1_ACVR1_TGFBR1 | TGFb | Cervix | CC |
| TGFB1 | ACVR1B_TGFbR2 | TGFB1_ACVR1B_TGFBR2 | TGFb | CRC | AD |
| TGFB1 | TGFbR1_R2 | TGFB1_TGFBR1_TGFBR2 | TGFb | CRC | CRC |
| TGFB1 | ACVR1B_TGFbR2 | TGFB1_ACVR1B_TGFBR2 | TGFb | CRC | CRC |
| TGFB1 | ACVR1C_TGFbR2 | TGFB1_ACVR1C_TGFBR2 | TGFb | CRC | CRC |
| TGFB1 | TGFbR1_R2 | TGFB1_TGFBR1_TGFBR2 | TGFb | CRC | MSI-H |
| TGFB1 | ACVR1B_TGFbR2 | TGFB1_ACVR1B_TGFBR2 | TGFb | CRC | MSI-H |
| TGFB1 | ACVR1_TGFbR | TGFB1_ACVR1_TGFBR1 | TGFb | CRC | MSI-H |
| TGFB1 | TGFbR1_R2 | TGFB1_TGFBR1_TGFBR2 | TGFb | CRC | SER |
| TGFB1 | TGFbR1_R2 | TGFB1_TGFBR1_TGFBR2 | TGFb | Endometrium | ADJ |
| TGFB1 | TGFbR1_R2 | TGFB1_TGFBR1_TGFBR2 | TGFb | Endometrium | AEH |
| TGFB1 | ACVR1B_TGFbR2 | TGFB1_ACVR1B_TGFBR2 | TGFb | Endometrium | AEH |
| TGFB1 | TGFbR1_R2 | TGFB1_TGFBR1_TGFBR2 | TGFb | Esophagus | ESCC |
| TGFB1 | ACVR1_TGFbR | TGFB1_ACVR1_TGFBR1 | TGFb | Esophagus | ESCC |
| TGFB1 | TGFbR1_R2 | TGFB1_TGFBR1_TGFBR2 | TGFb | HNSCC | ADJ |
| Page: 1 2 3 |
Top |
Single-cell gene regulatory network inference analysis |
| Find out the significant the regulons (TFs) and the target genes of each regulon across cell types for different disease states |
| TF | Cell Type | Tissue | Disease Stage | Target Gene | RSS | Regulon Activity |
| ∗The dot plots of a searched regulon are shown for all cell subpopulations in each disease state of each tissue based on the regulon specific score inferred using pySCENIC and by calculating the average expression. |
| Page: 1 |
Top |
Somatic mutation of malignant transformation related genes |
| Annotation of somatic variants for genes involved in malignant transformation |
| Hugo Symbol | Variant Class | Variant Classification | dbSNP RS | HGVSc | HGVSp | HGVSp Short | SWISSPROT | BIOTYPE | SIFT | PolyPhen | Tumor Sample Barcode | Tissue | Histology | Sex | Age | Stage | Therapy Types | Drugs | Outcome |
| TGFB1 | SNV | Missense_Mutation | novel | c.1079N>T | p.Ala360Val | p.A360V | P01137 | protein_coding | tolerated(0.75) | benign(0.001) | TCGA-3C-AAAU-01 | Breast | breast invasive carcinoma | Female | <65 | I/II | Chemotherapy | zoladex | SD |
| TGFB1 | SNV | Missense_Mutation | c.1031A>T | p.Asn344Ile | p.N344I | P01137 | protein_coding | deleterious(0) | probably_damaging(0.998) | TCGA-AR-A1AR-01 | Breast | breast invasive carcinoma | Female | <65 | III/IV | Unspecific | Docetaxel | PD | |
| TGFB1 | SNV | Missense_Mutation | c.368N>T | p.Lys123Met | p.K123M | P01137 | protein_coding | tolerated(0.12) | possibly_damaging(0.45) | TCGA-AM-5821-01 | Colorectum | colon adenocarcinoma | Female | >=65 | I/II | Unknown | Unknown | SD | |
| TGFB1 | SNV | Missense_Mutation | c.1099N>A | p.Val367Met | p.V367M | P01137 | protein_coding | deleterious(0.01) | probably_damaging(0.989) | TCGA-CK-4951-01 | Colorectum | colon adenocarcinoma | Female | >=65 | I/II | Unknown | Unknown | PD | |
| TGFB1 | SNV | Missense_Mutation | c.829N>T | p.Arg277Cys | p.R277C | P01137 | protein_coding | deleterious(0) | probably_damaging(0.961) | TCGA-CK-5913-01 | Colorectum | colon adenocarcinoma | Female | <65 | I/II | Unknown | Unknown | SD | |
| TGFB1 | SNV | Missense_Mutation | c.727N>A | p.Arg243Ser | p.R243S | P01137 | protein_coding | tolerated(0.77) | benign(0.428) | TCGA-NH-A5IV-01 | Colorectum | colon adenocarcinoma | Female | >=65 | I/II | Unknown | Unknown | SD | |
| TGFB1 | SNV | Missense_Mutation | rs142642007 | c.442N>A | p.Val148Met | p.V148M | P01137 | protein_coding | tolerated(0.12) | benign(0.01) | TCGA-SS-A7HO-01 | Colorectum | colon adenocarcinoma | Female | <65 | I/II | Chemotherapy | oxaliplatin | PD |
| TGFB1 | SNV | Missense_Mutation | c.883N>A | p.Val295Met | p.V295M | P01137 | protein_coding | deleterious(0) | probably_damaging(0.992) | TCGA-AH-6544-01 | Colorectum | rectum adenocarcinoma | Male | <65 | III/IV | Chemotherapy | oxaliplatin | SD | |
| TGFB1 | SNV | Missense_Mutation | rs201327622 | c.661G>A | p.Ala221Thr | p.A221T | P01137 | protein_coding | tolerated(0.17) | benign(0.034) | TCGA-A5-A2K5-01 | Endometrium | uterine corpus endometrioid carcinoma | Female | >=65 | I/II | Unknown | Unknown | SD |
| TGFB1 | SNV | Missense_Mutation | c.248N>T | p.Ser83Ile | p.S83I | P01137 | protein_coding | deleterious(0) | possibly_damaging(0.706) | TCGA-AP-A059-01 | Endometrium | uterine corpus endometrioid carcinoma | Female | >=65 | I/II | Unknown | Unknown | SD |
| Page: 1 2 3 4 |
Top |
Related drugs of malignant transformation related genes |
| Identification of chemicals and drugs interact with genes involved in malignant transfromation |
| (DGIdb 4.0) |
| Entrez ID | Symbol | Category | Interaction Types | Drug Claim Name | Drug Name | PMIDs |
| 7040 | TGFB1 | TRANSCRIPTION FACTOR, DRUGGABLE GENOME, CELL SURFACE, GROWTH FACTOR | Disitertide | DISITERTIDE | 24393789 | |
| 7040 | TGFB1 | TRANSCRIPTION FACTOR, DRUGGABLE GENOME, CELL SURFACE, GROWTH FACTOR | ANTIOXIDANT | 12221586 | ||
| 7040 | TGFB1 | TRANSCRIPTION FACTOR, DRUGGABLE GENOME, CELL SURFACE, GROWTH FACTOR | Pirfenidone | PIRFENIDONE | ||
| 7040 | TGFB1 | TRANSCRIPTION FACTOR, DRUGGABLE GENOME, CELL SURFACE, GROWTH FACTOR | VERAPAMIL | VERAPAMIL | ||
| 7040 | TGFB1 | TRANSCRIPTION FACTOR, DRUGGABLE GENOME, CELL SURFACE, GROWTH FACTOR | TOREMIFENE | TOREMIFENE | 12476040 | |
| 7040 | TGFB1 | TRANSCRIPTION FACTOR, DRUGGABLE GENOME, CELL SURFACE, GROWTH FACTOR | TAMOXIFEN | TAMOXIFEN | 8019941 | |
| 7040 | TGFB1 | TRANSCRIPTION FACTOR, DRUGGABLE GENOME, CELL SURFACE, GROWTH FACTOR | BRDU | 10495776 | ||
| 7040 | TGFB1 | TRANSCRIPTION FACTOR, DRUGGABLE GENOME, CELL SURFACE, GROWTH FACTOR | PIRFENIDONE | PIRFENIDONE | 12907346 | |
| 7040 | TGFB1 | TRANSCRIPTION FACTOR, DRUGGABLE GENOME, CELL SURFACE, GROWTH FACTOR | TRIAMCINOLONE | TRIAMCINOLONE | 12174062 | |
| 7040 | TGFB1 | TRANSCRIPTION FACTOR, DRUGGABLE GENOME, CELL SURFACE, GROWTH FACTOR | BOVINE CARTILAGE | 12525389 |
| Page: 1 2 3 4 5 6 |

Copyright 2023-Present -The University of Texas Health Science Center at Houston |