
|
|||||
|
 | |
| |
| |
| |
| |
| |
|
Gene: CCND1 |
Gene summary for CCND1 |
| Gene information | Species | Human | Gene symbol | CCND1 | Gene ID | 595 |
| Gene name | cyclin D1 | |
| Gene Alias | BCL1 | |
| Cytomap | 11q13.3 | |
| Gene Type | protein-coding | GO ID | GO:0000003 | UniProtAcc | P24385 |
Top |
Malignant transformation analysis |
| Identification of the aberrant gene expression in precancerous and cancerous lesions by comparing the gene expression of stem-like cells in diseased tissues with normal stem cells |
| Entrez ID | Symbol | Replicates | Species | Organ | Tissue | Adj P-value | Log2FC | Malignancy |
| 595 | CCND1 | GSM4909282 | Human | Breast | IDC | 4.46e-07 | 3.80e-01 | -0.0288 |
| 595 | CCND1 | GSM4909285 | Human | Breast | IDC | 6.34e-26 | 6.74e-01 | 0.21 |
| 595 | CCND1 | GSM4909286 | Human | Breast | IDC | 7.10e-38 | 7.67e-01 | 0.1081 |
| 595 | CCND1 | GSM4909290 | Human | Breast | IDC | 2.08e-18 | 6.48e-01 | 0.2096 |
| 595 | CCND1 | GSM4909293 | Human | Breast | IDC | 4.74e-05 | 7.54e-02 | 0.1581 |
| 595 | CCND1 | GSM4909296 | Human | Breast | IDC | 2.62e-04 | 2.02e-01 | 0.1524 |
| 595 | CCND1 | GSM4909297 | Human | Breast | IDC | 7.34e-16 | 2.54e-01 | 0.1517 |
| 595 | CCND1 | GSM4909298 | Human | Breast | IDC | 5.97e-64 | 1.09e+00 | 0.1551 |
| 595 | CCND1 | GSM4909301 | Human | Breast | IDC | 3.29e-64 | 1.02e+00 | 0.1577 |
| 595 | CCND1 | GSM4909302 | Human | Breast | IDC | 2.10e-06 | 3.41e-01 | 0.1545 |
| 595 | CCND1 | GSM4909304 | Human | Breast | IDC | 1.77e-33 | 6.71e-01 | 0.1636 |
| 595 | CCND1 | GSM4909305 | Human | Breast | IDC | 7.59e-07 | 4.46e-01 | 0.0436 |
| 595 | CCND1 | GSM4909306 | Human | Breast | IDC | 1.64e-10 | 4.56e-01 | 0.1564 |
| 595 | CCND1 | GSM4909307 | Human | Breast | IDC | 2.21e-28 | 7.04e-01 | 0.1569 |
| 595 | CCND1 | GSM4909308 | Human | Breast | IDC | 1.64e-72 | 1.08e+00 | 0.158 |
| 595 | CCND1 | GSM4909309 | Human | Breast | IDC | 5.74e-03 | 2.49e-01 | 0.0483 |
| 595 | CCND1 | GSM4909311 | Human | Breast | IDC | 8.79e-18 | 6.08e-02 | 0.1534 |
| 595 | CCND1 | GSM4909312 | Human | Breast | IDC | 1.56e-15 | 4.42e-01 | 0.1552 |
| 595 | CCND1 | GSM4909317 | Human | Breast | IDC | 4.62e-02 | 3.00e-01 | 0.1355 |
| 595 | CCND1 | GSM4909318 | Human | Breast | IDC | 2.32e-03 | 4.51e-01 | 0.2031 |
| Page: 1 2 3 4 5 6 7 8 9 10 11 12 |
| Tissue | Expression Dynamics | Abbreviation |
| Breast | 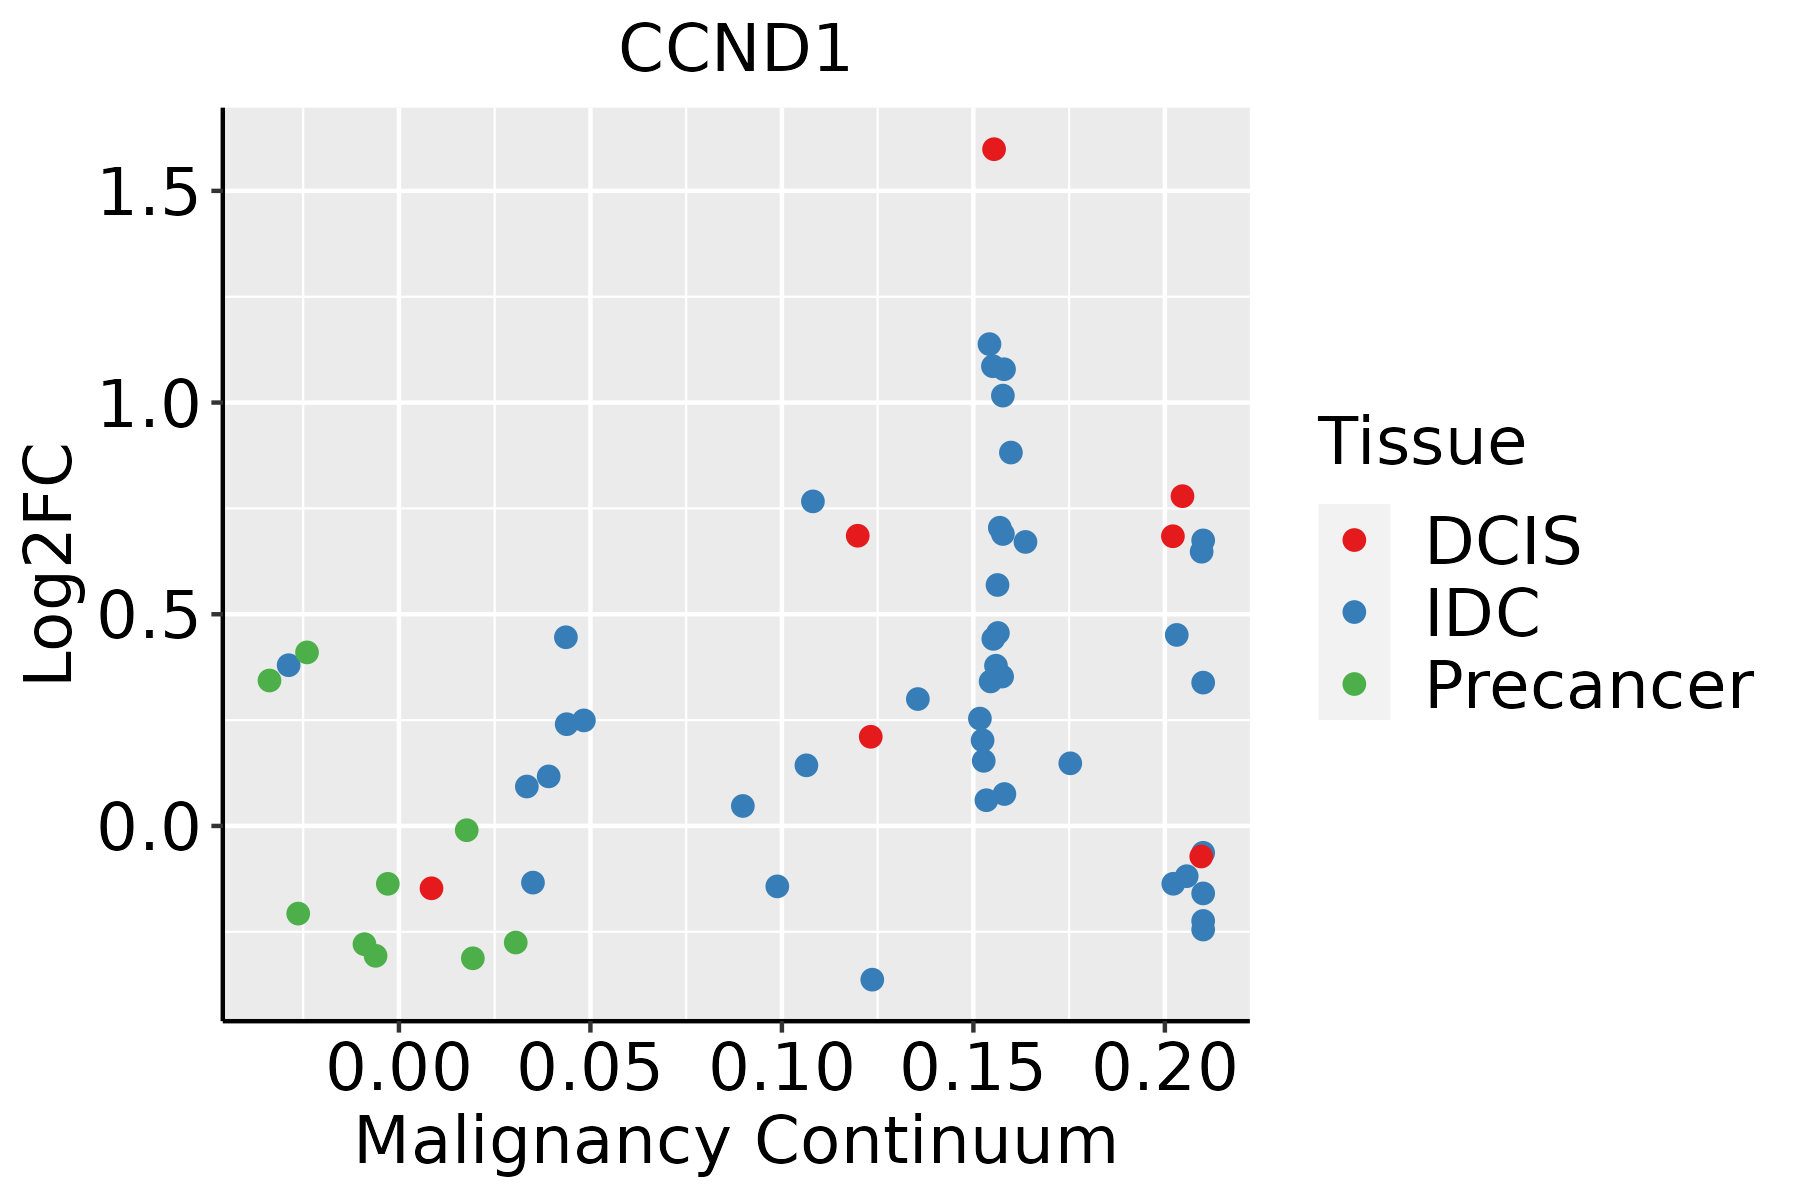 | IDC: Invasive ductal carcinoma |
| DCIS: Ductal carcinoma in situ | ||
| Precancer(BRCA1-mut): Precancerous lesion from BRCA1 mutation carriers | ||
| Cervix | 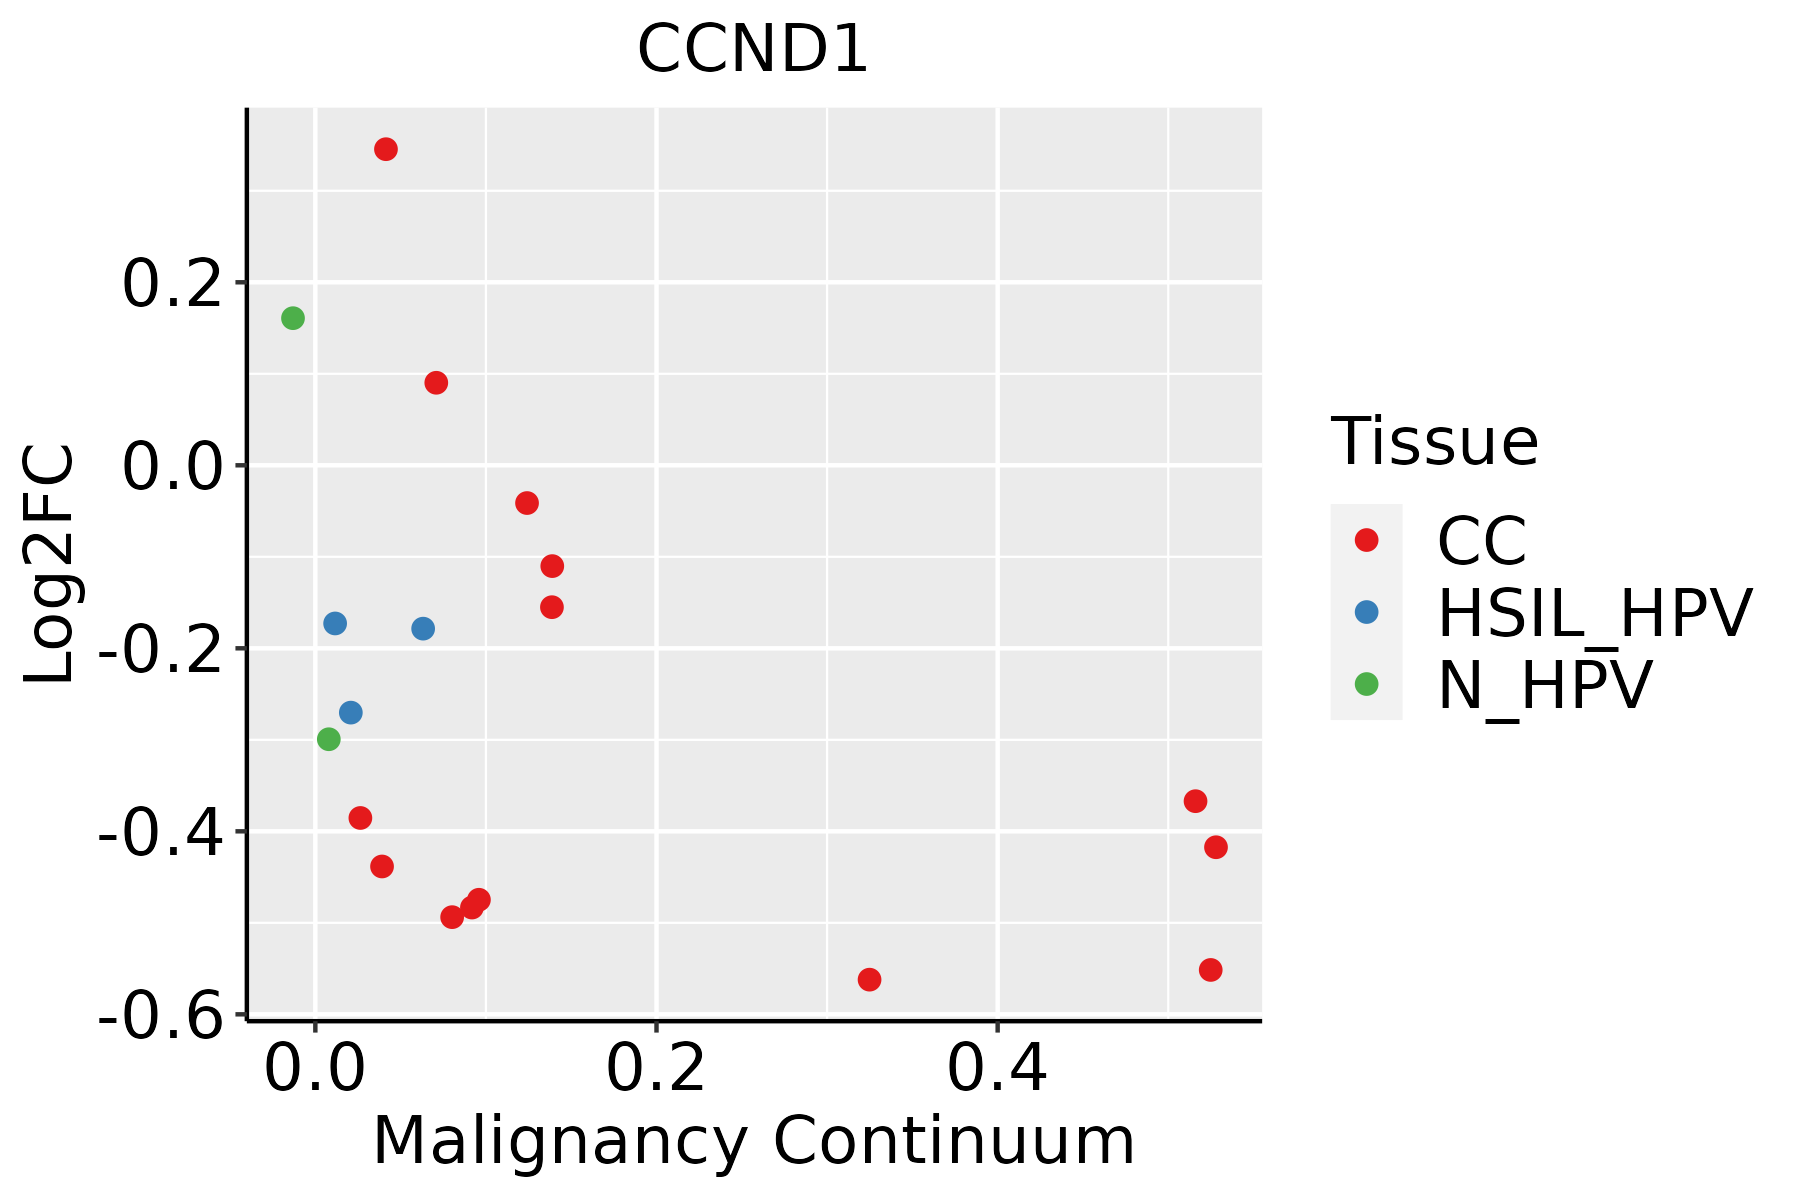 | CC: Cervix cancer |
| HSIL_HPV: HPV-infected high-grade squamous intraepithelial lesions | ||
| N_HPV: HPV-infected normal cervix | ||
| Endometrium |  | AEH: Atypical endometrial hyperplasia |
| EEC: Endometrioid Cancer | ||
| Esophagus |  | ESCC: Esophageal squamous cell carcinoma |
| HGIN: High-grade intraepithelial neoplasias | ||
| LGIN: Low-grade intraepithelial neoplasias | ||
| GC | 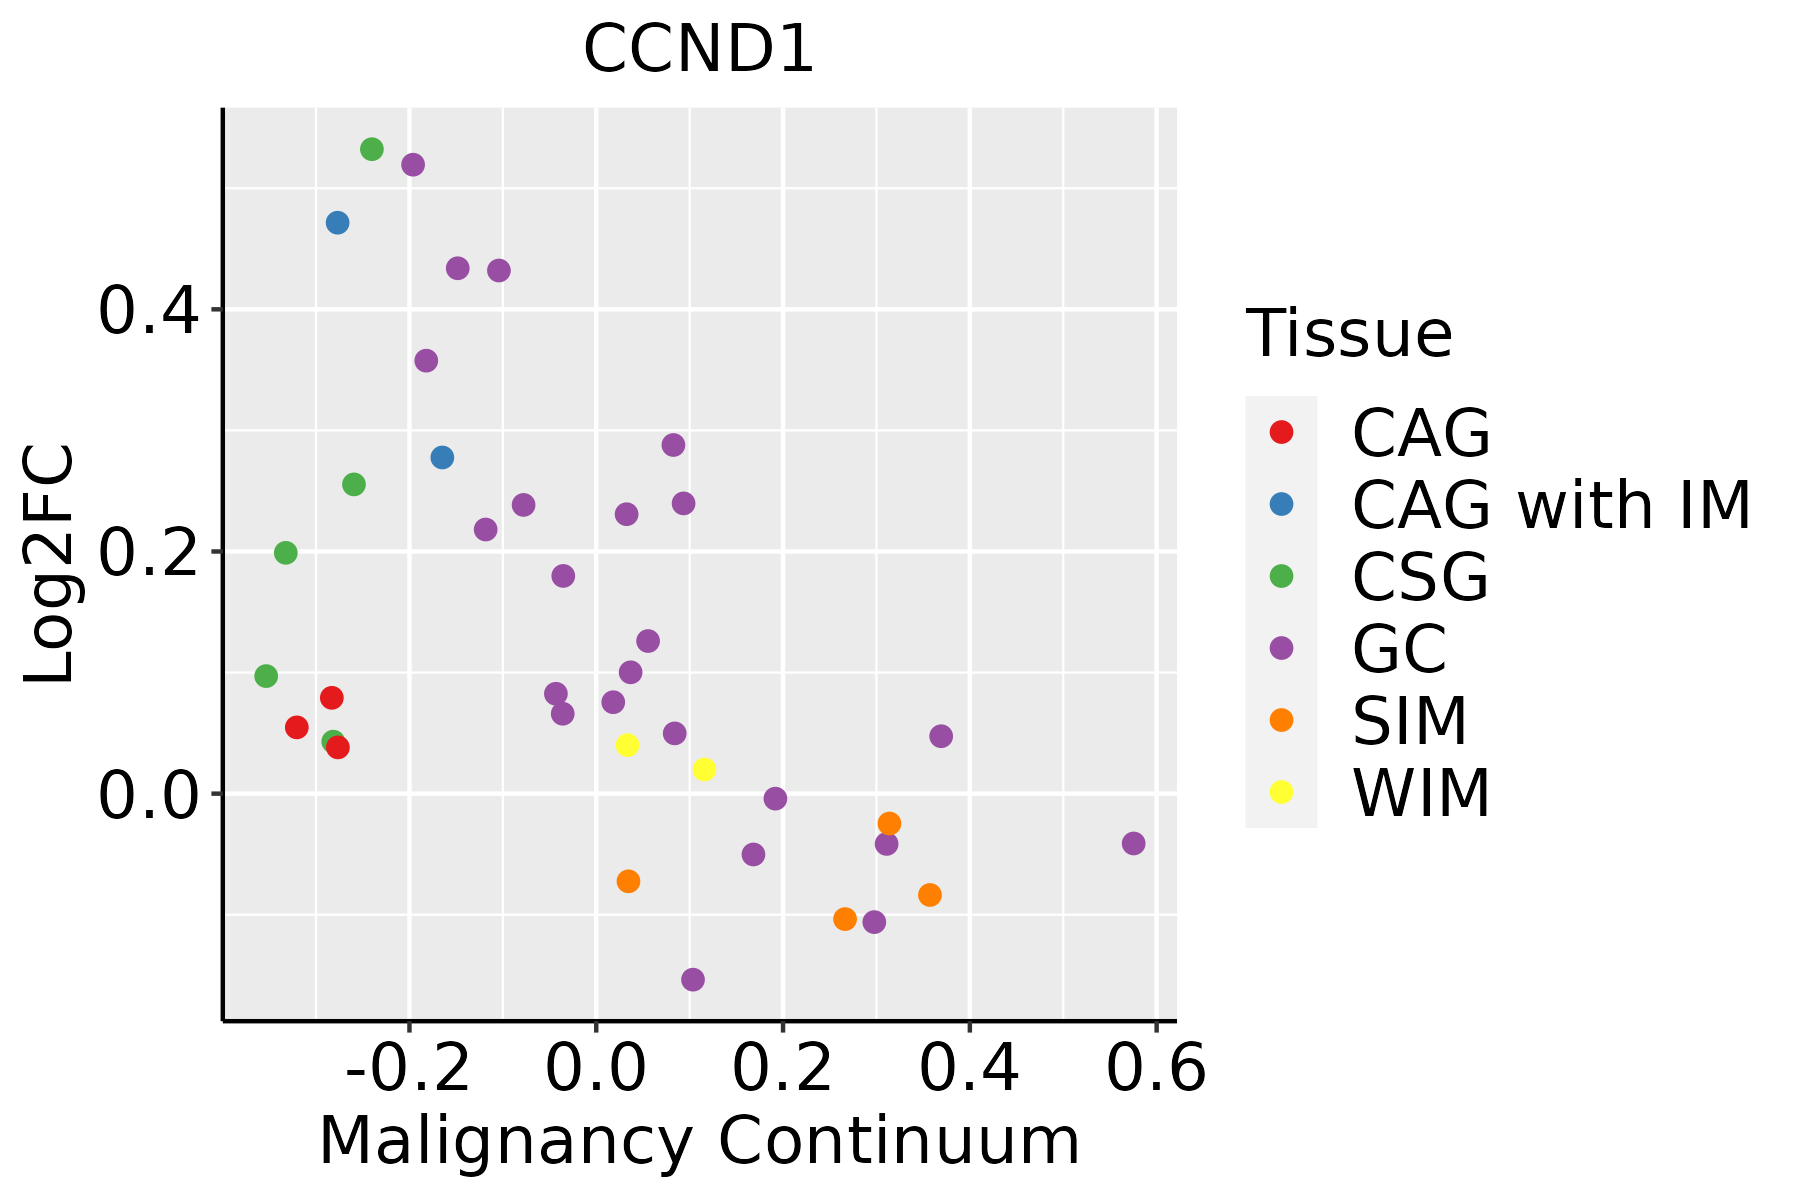 | CAG: Chronic atrophic gastritis |
| CAG with IM: Chronic atrophic gastritis with intestinal metaplasia | ||
| CSG: Chronic superficial gastritis | ||
| GC: Gastric cancer | ||
| SIM: Severe intestinal metaplasia | ||
| WIM: Wild intestinal metaplasia | ||
| Liver | 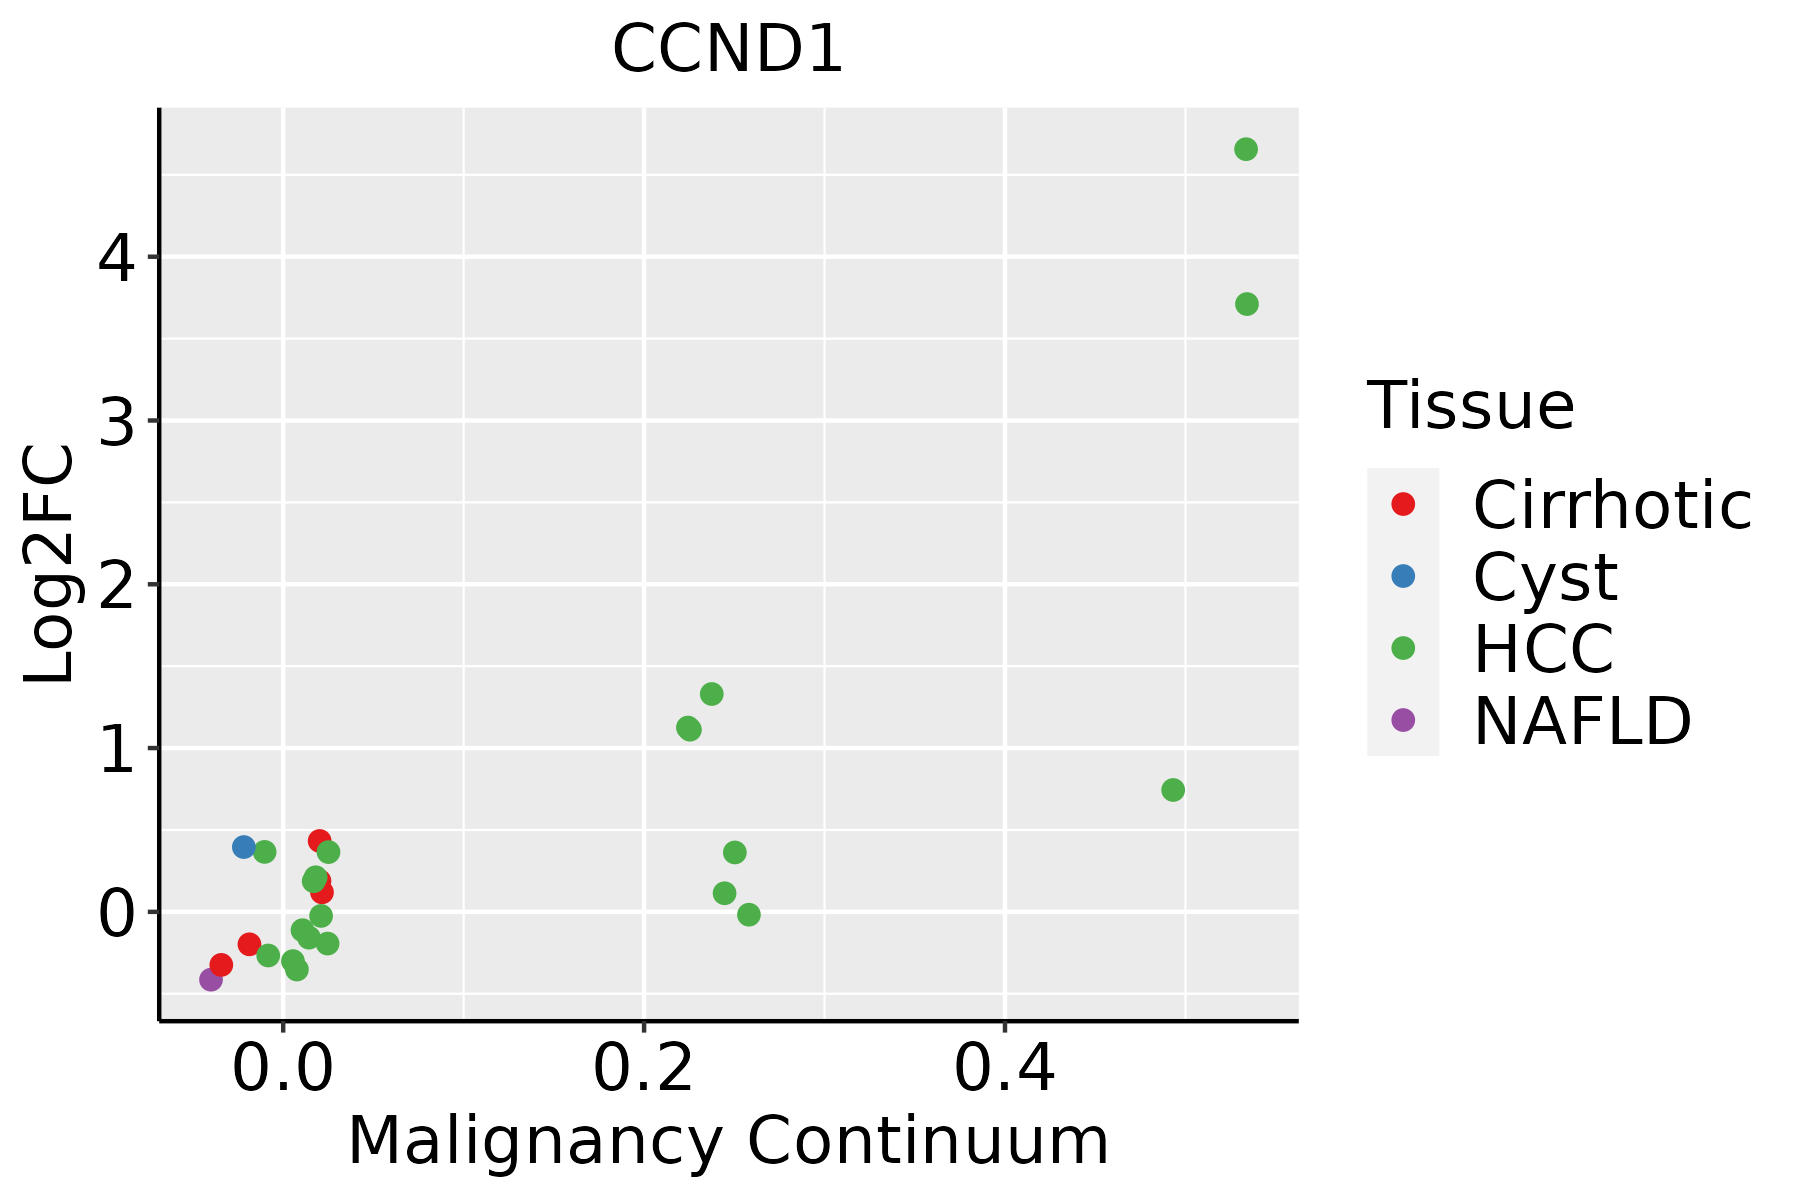 | HCC: Hepatocellular carcinoma |
| NAFLD: Non-alcoholic fatty liver disease | ||
| Lung | 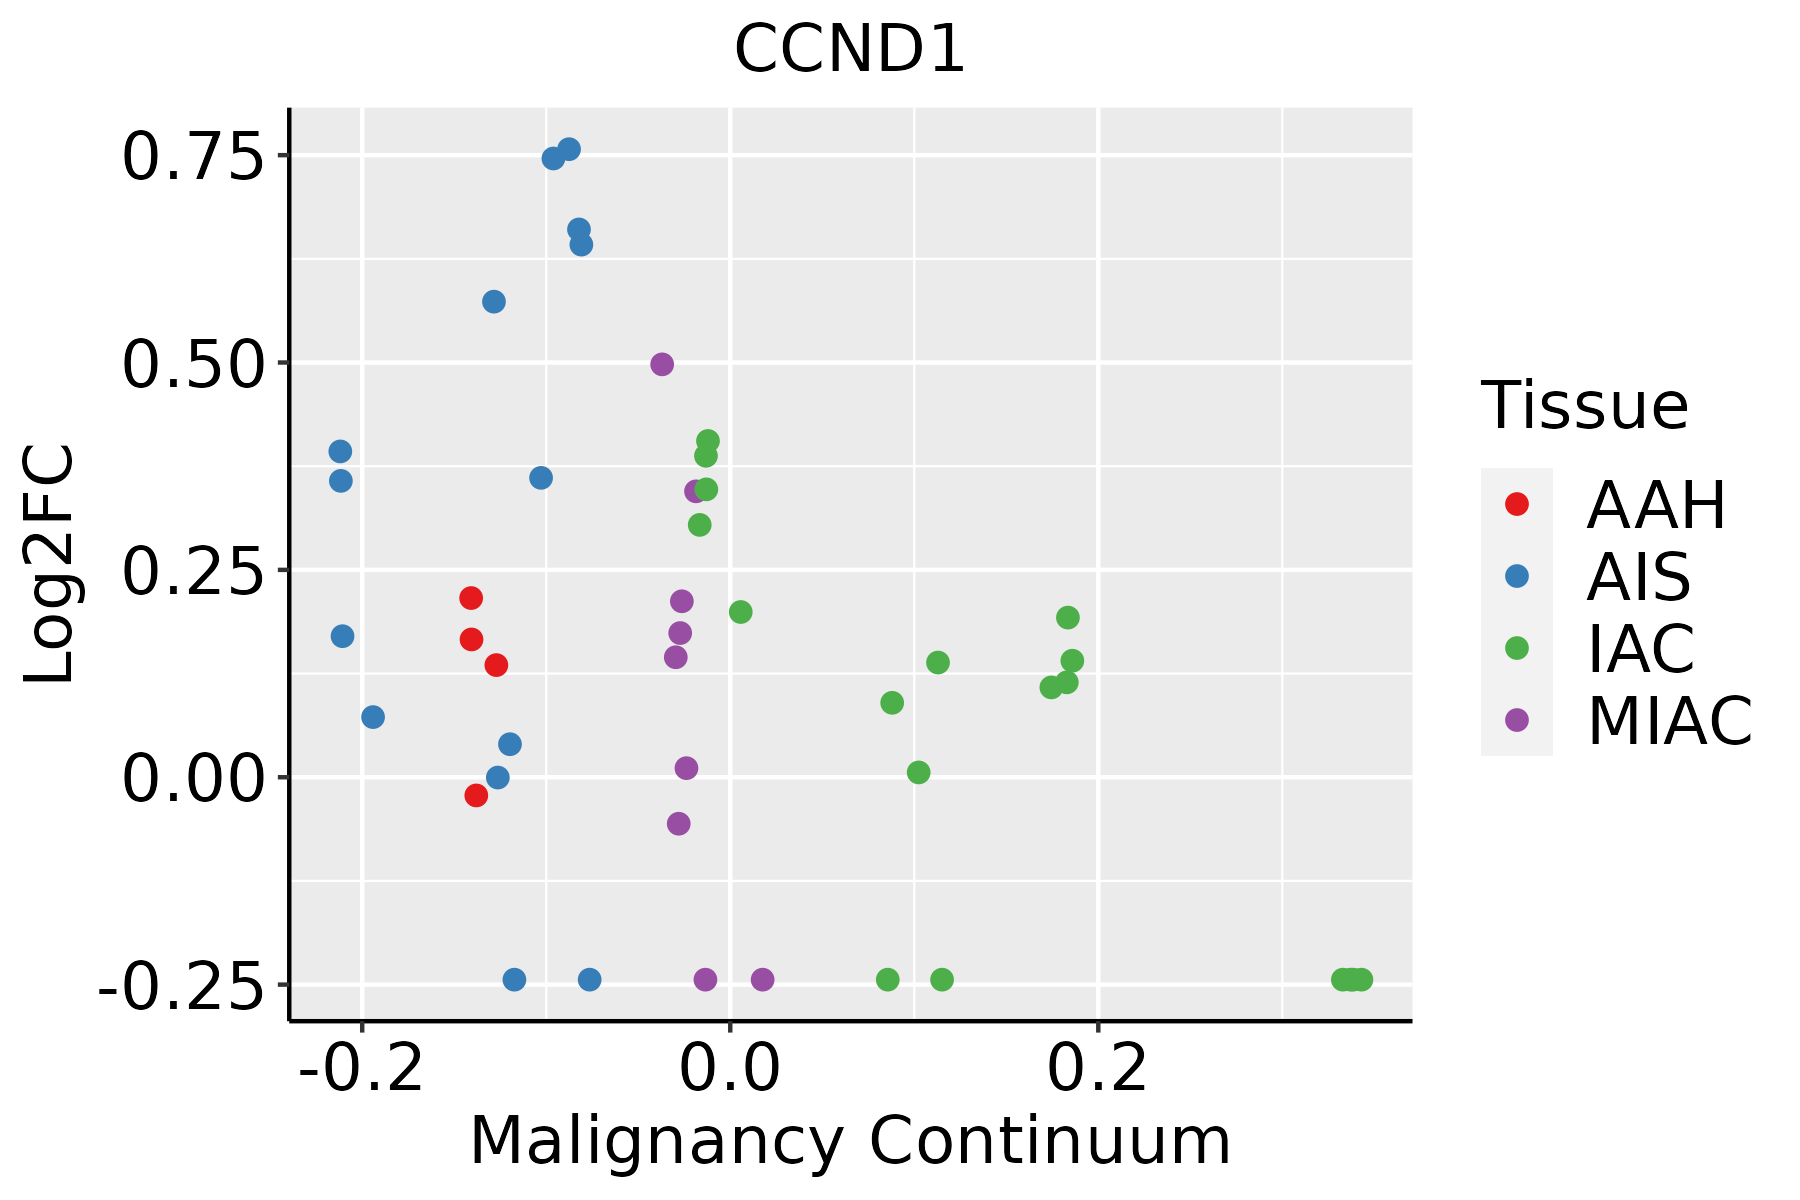 | AAH: Atypical adenomatous hyperplasia |
| AIS: Adenocarcinoma in situ | ||
| IAC: Invasive lung adenocarcinoma | ||
| MIA: Minimally invasive adenocarcinoma | ||
| Oral Cavity |  | EOLP: Erosive Oral lichen planus |
| LP: leukoplakia | ||
| NEOLP: Non-erosive oral lichen planus | ||
| OSCC: Oral squamous cell carcinoma | ||
| Prostate | 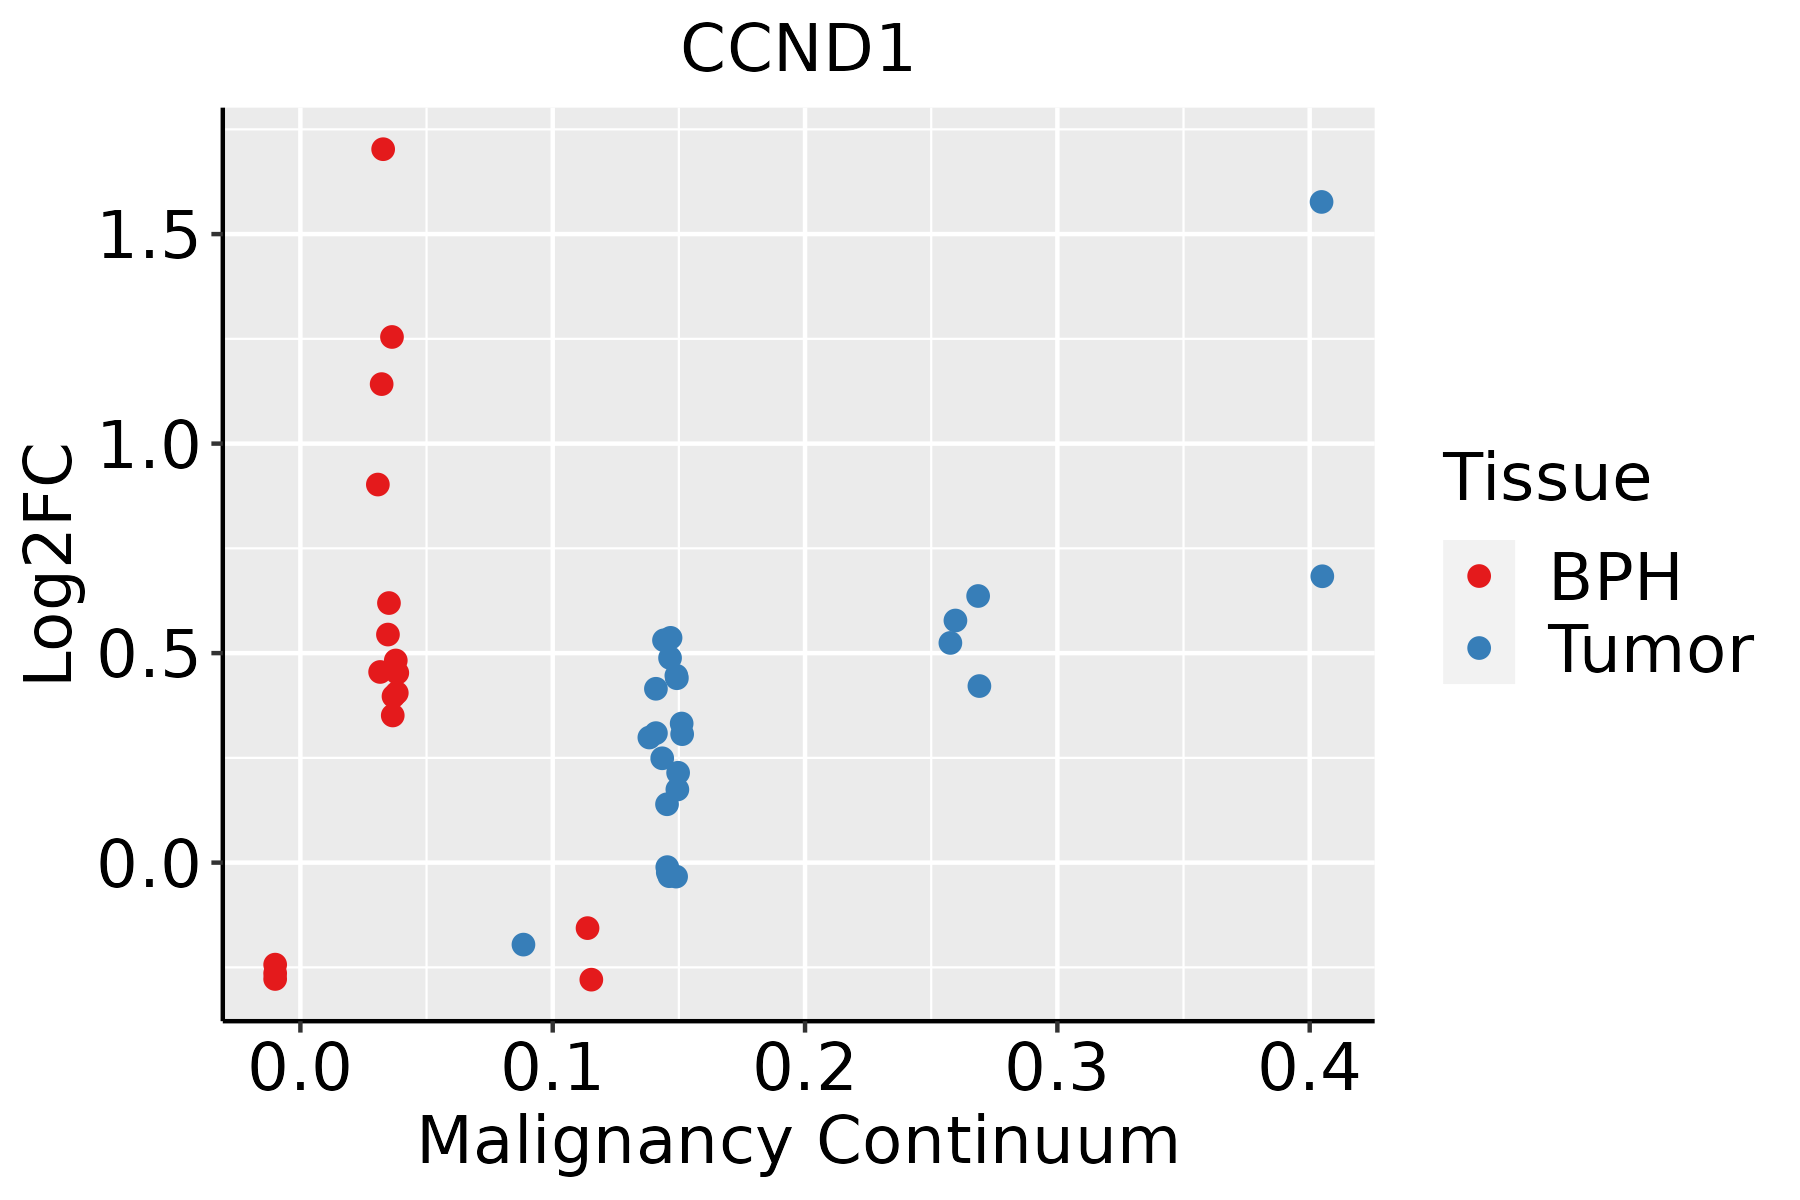 | BPH: Benign Prostatic Hyperplasia |
| Skin | 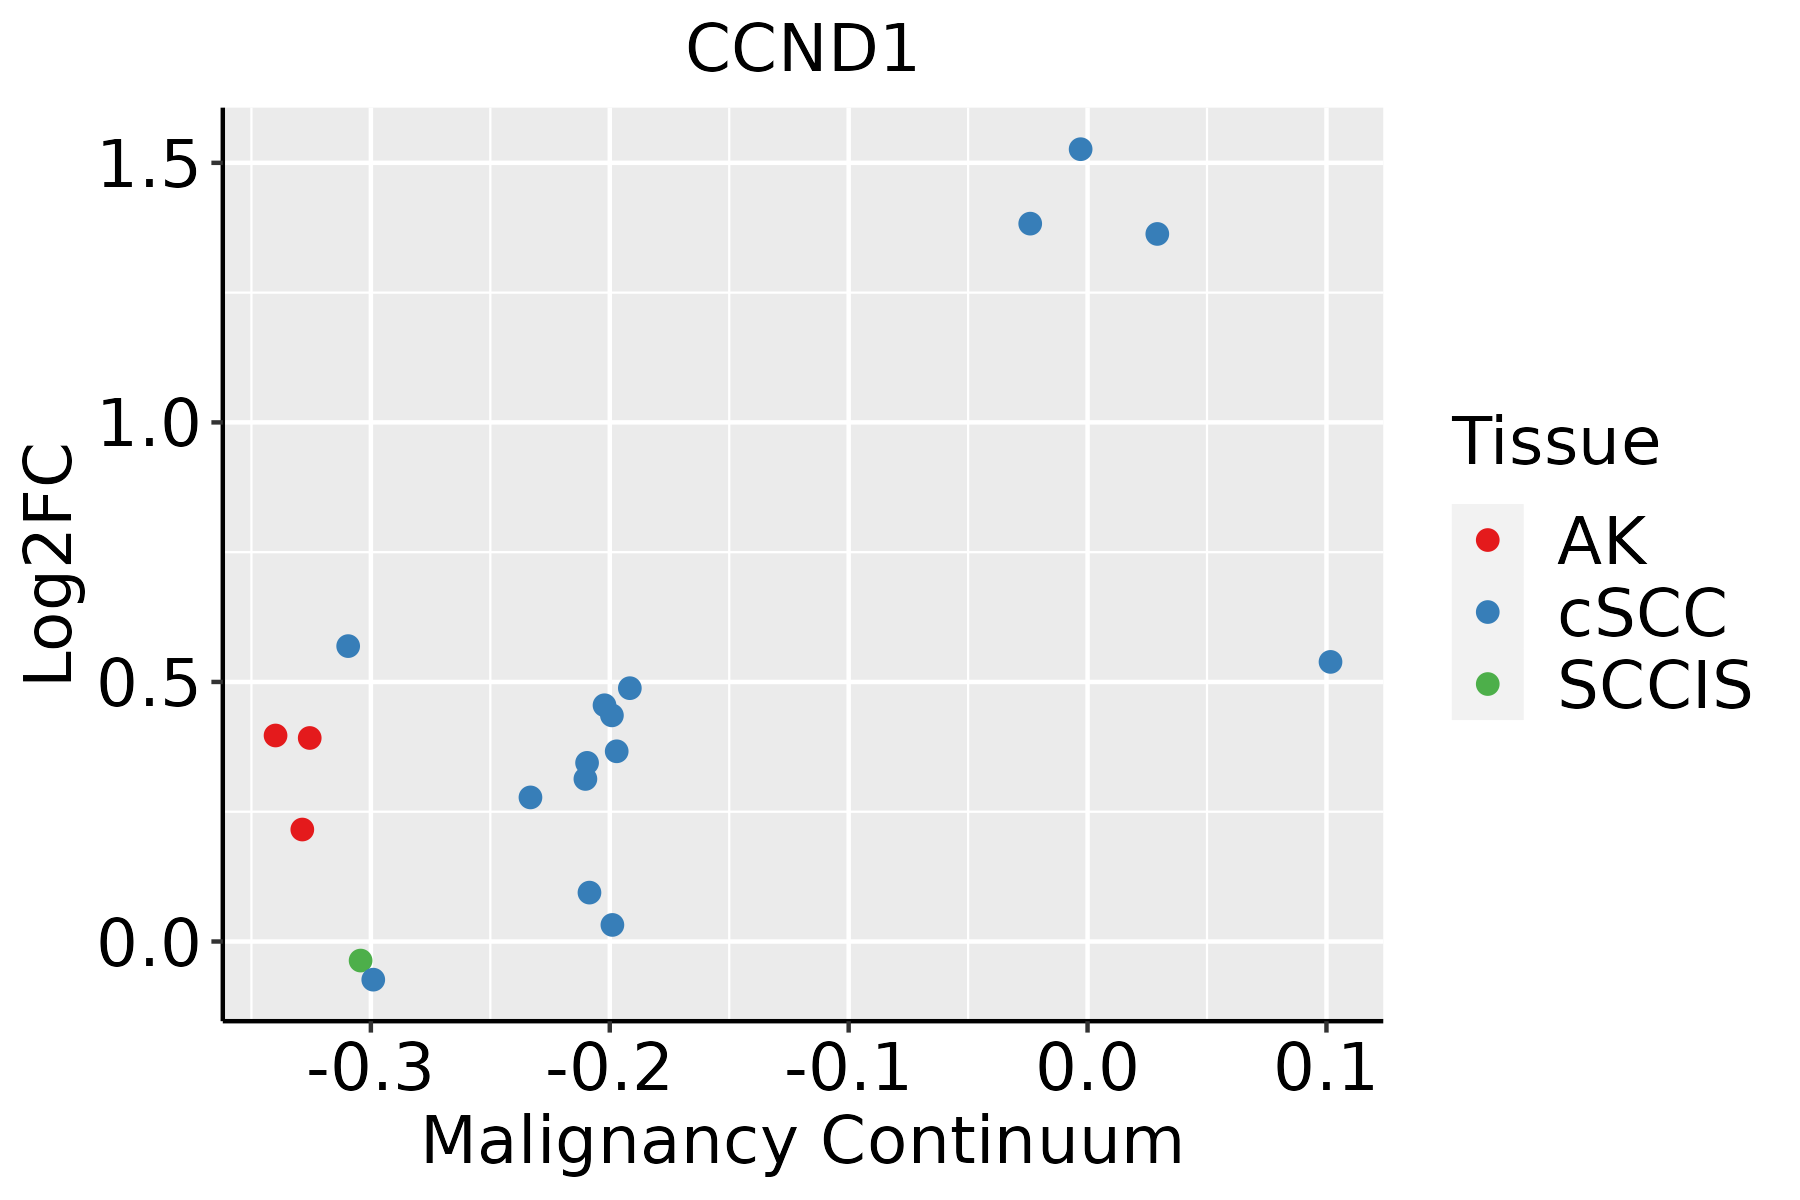 | AK: Actinic keratosis |
| cSCC: Cutaneous squamous cell carcinoma | ||
| SCCIS:squamous cell carcinoma in situ | ||
| Thyroid | 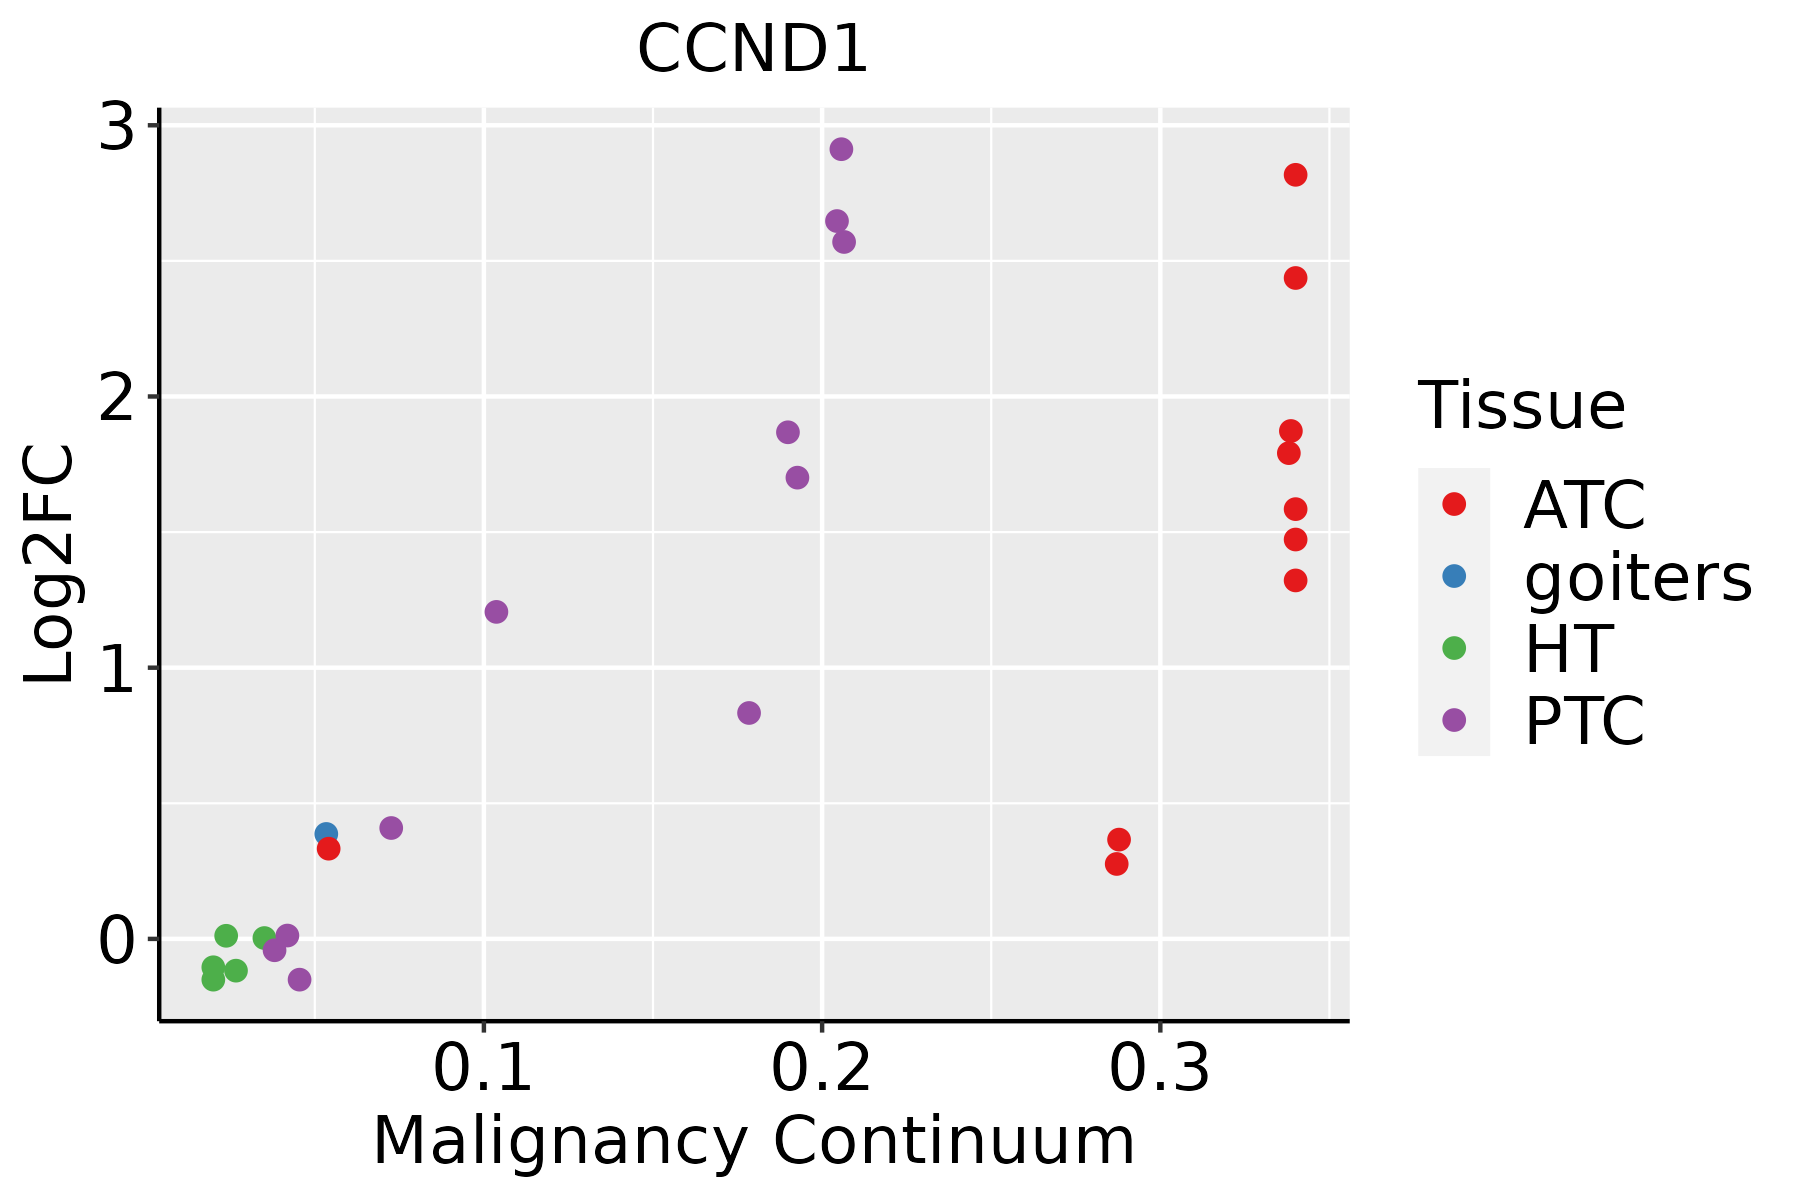 | ATC: Anaplastic thyroid cancer |
| HT: Hashimoto's thyroiditis | ||
| PTC: Papillary thyroid cancer |
| ∗log2FC in expression of this searched gene in stem-like cells from each diseased tissue sample relative to stem-like cells in normal samples in each tissue plotted against the malignancy continuum. Samples are colored based on if they are from different disease stage. |
Top |
Malignant transformation related pathway analysis |
| Find out the enriched GO biological processes and KEGG pathways involved in transition from healthy to precancer to cancer |
| Tissue | Disease Stage | Enriched GO biological Processes |
| Colorectum | AD |  |
| Colorectum | SER |  |
| Colorectum | MSS |  |
| Colorectum | MSI-H |  |
| Colorectum | FAP |  |
| ∗Top 15 enriched GO BP terms are showed in the bar plot of each disease state in each tissue. Each row represents a significant GO biological process which is colored according to the -log10(p.adjust). |
| Page: 1 2 3 4 5 6 7 8 9 |
| GO ID | Tissue | Disease Stage | Description | Gene Ratio | Bg Ratio | pvalue | p.adjust | Count |
| GO:0033674111 | Thyroid | PTC | positive regulation of kinase activity | 201/5968 | 467/18723 | 1.95e-07 | 3.54e-06 | 201 |
| GO:004593119 | Thyroid | PTC | positive regulation of mitotic cell cycle | 65/5968 | 121/18723 | 5.08e-07 | 8.26e-06 | 65 |
| GO:0009314111 | Thyroid | PTC | response to radiation | 195/5968 | 456/18723 | 5.10e-07 | 8.27e-06 | 195 |
| GO:0031667113 | Thyroid | PTC | response to nutrient levels | 201/5968 | 474/18723 | 7.00e-07 | 1.10e-05 | 201 |
| GO:00094117 | Thyroid | PTC | response to UV | 76/5968 | 149/18723 | 8.97e-07 | 1.36e-05 | 76 |
| GO:00000829 | Thyroid | PTC | G1/S transition of mitotic cell cycle | 102/5968 | 214/18723 | 9.48e-07 | 1.43e-05 | 102 |
| GO:00448439 | Thyroid | PTC | cell cycle G1/S phase transition | 112/5968 | 241/18723 | 1.37e-06 | 1.96e-05 | 112 |
| GO:00457867 | Thyroid | PTC | negative regulation of cell cycle | 166/5968 | 385/18723 | 1.93e-06 | 2.64e-05 | 166 |
| GO:19019878 | Thyroid | PTC | regulation of cell cycle phase transition | 167/5968 | 390/18723 | 2.97e-06 | 3.87e-05 | 167 |
| GO:007190210 | Thyroid | PTC | positive regulation of protein serine/threonine kinase activity | 93/5968 | 200/18723 | 1.01e-05 | 1.12e-04 | 93 |
| GO:1901654113 | Thyroid | PTC | response to ketone | 90/5968 | 194/18723 | 1.56e-05 | 1.65e-04 | 90 |
| GO:0010038112 | Thyroid | PTC | response to metal ion | 157/5968 | 373/18723 | 1.80e-05 | 1.86e-04 | 157 |
| GO:004277010 | Thyroid | PTC | signal transduction in response to DNA damage | 81/5968 | 172/18723 | 2.07e-05 | 2.08e-04 | 81 |
| GO:00459307 | Thyroid | PTC | negative regulation of mitotic cell cycle | 105/5968 | 235/18723 | 2.41e-05 | 2.39e-04 | 105 |
| GO:19019917 | Thyroid | PTC | negative regulation of mitotic cell cycle phase transition | 83/5968 | 179/18723 | 3.34e-05 | 3.17e-04 | 83 |
| GO:004544418 | Thyroid | PTC | fat cell differentiation | 102/5968 | 229/18723 | 3.66e-05 | 3.40e-04 | 102 |
| GO:0061458112 | Thyroid | PTC | reproductive system development | 173/5968 | 427/18723 | 8.70e-05 | 7.23e-04 | 173 |
| GO:009006816 | Thyroid | PTC | positive regulation of cell cycle process | 103/5968 | 236/18723 | 9.03e-05 | 7.50e-04 | 103 |
| GO:190402912 | Thyroid | PTC | regulation of cyclin-dependent protein kinase activity | 49/5968 | 98/18723 | 1.40e-04 | 1.09e-03 | 49 |
| GO:200004515 | Thyroid | PTC | regulation of G1/S transition of mitotic cell cycle | 66/5968 | 142/18723 | 1.86e-04 | 1.41e-03 | 66 |
| Page: 1 2 3 4 5 6 7 8 9 10 11 12 13 14 15 16 17 18 19 20 21 22 23 24 25 26 27 28 29 30 31 32 33 34 35 36 37 38 39 40 41 42 43 44 45 46 47 48 49 50 51 52 53 54 55 56 57 58 59 60 61 62 63 64 65 66 |
| Pathway ID | Tissue | Disease Stage | Description | Gene Ratio | Bg Ratio | pvalue | p.adjust | qvalue | Count |
| hsa0516718 | Breast | Precancer | Kaposi sarcoma-associated herpesvirus infection | 36/684 | 194/8465 | 1.68e-06 | 2.53e-05 | 1.94e-05 | 36 |
| hsa0453018 | Breast | Precancer | Tight junction | 31/684 | 169/8465 | 1.13e-05 | 1.26e-04 | 9.64e-05 | 31 |
| hsa0516918 | Breast | Precancer | Epstein-Barr virus infection | 35/684 | 202/8465 | 1.15e-05 | 1.26e-04 | 9.64e-05 | 35 |
| hsa042189 | Breast | Precancer | Cellular senescence | 29/684 | 156/8465 | 1.66e-05 | 1.69e-04 | 1.30e-04 | 29 |
| hsa0541618 | Breast | Precancer | Viral myocarditis | 14/684 | 60/8465 | 2.32e-04 | 1.98e-03 | 1.52e-03 | 14 |
| hsa0516618 | Breast | Precancer | Human T-cell leukemia virus 1 infection | 33/684 | 222/8465 | 4.29e-04 | 3.31e-03 | 2.53e-03 | 33 |
| hsa0520514 | Breast | Precancer | Proteoglycans in cancer | 30/684 | 205/8465 | 1.00e-03 | 7.18e-03 | 5.50e-03 | 30 |
| hsa0516316 | Breast | Precancer | Human cytomegalovirus infection | 32/684 | 225/8465 | 1.13e-03 | 7.57e-03 | 5.80e-03 | 32 |
| hsa052196 | Breast | Precancer | Bladder cancer | 9/684 | 41/8465 | 4.65e-03 | 2.72e-02 | 2.08e-02 | 9 |
| hsa052036 | Breast | Precancer | Viral carcinogenesis | 27/684 | 204/8465 | 7.19e-03 | 4.06e-02 | 3.11e-02 | 27 |
| hsa0516719 | Breast | Precancer | Kaposi sarcoma-associated herpesvirus infection | 36/684 | 194/8465 | 1.68e-06 | 2.53e-05 | 1.94e-05 | 36 |
| hsa0453019 | Breast | Precancer | Tight junction | 31/684 | 169/8465 | 1.13e-05 | 1.26e-04 | 9.64e-05 | 31 |
| hsa0516919 | Breast | Precancer | Epstein-Barr virus infection | 35/684 | 202/8465 | 1.15e-05 | 1.26e-04 | 9.64e-05 | 35 |
| hsa0421814 | Breast | Precancer | Cellular senescence | 29/684 | 156/8465 | 1.66e-05 | 1.69e-04 | 1.30e-04 | 29 |
| hsa0541619 | Breast | Precancer | Viral myocarditis | 14/684 | 60/8465 | 2.32e-04 | 1.98e-03 | 1.52e-03 | 14 |
| hsa0516619 | Breast | Precancer | Human T-cell leukemia virus 1 infection | 33/684 | 222/8465 | 4.29e-04 | 3.31e-03 | 2.53e-03 | 33 |
| hsa0520515 | Breast | Precancer | Proteoglycans in cancer | 30/684 | 205/8465 | 1.00e-03 | 7.18e-03 | 5.50e-03 | 30 |
| hsa0516317 | Breast | Precancer | Human cytomegalovirus infection | 32/684 | 225/8465 | 1.13e-03 | 7.57e-03 | 5.80e-03 | 32 |
| hsa0521913 | Breast | Precancer | Bladder cancer | 9/684 | 41/8465 | 4.65e-03 | 2.72e-02 | 2.08e-02 | 9 |
| hsa0520312 | Breast | Precancer | Viral carcinogenesis | 27/684 | 204/8465 | 7.19e-03 | 4.06e-02 | 3.11e-02 | 27 |
| Page: 1 2 3 4 5 6 7 8 9 10 11 12 13 14 15 16 17 18 19 20 21 22 23 24 25 26 27 28 29 30 31 32 33 34 35 36 37 38 |
Top |
Cell-cell communication analysis |
| Identification of potential cell-cell interactions between two cell types and their ligand-receptor pairs for different disease states |
| Ligand | Receptor | LRpair | Pathway | Tissue | Disease Stage |
| Page: 1 |
Top |
Single-cell gene regulatory network inference analysis |
| Find out the significant the regulons (TFs) and the target genes of each regulon across cell types for different disease states |
| TF | Cell Type | Tissue | Disease Stage | Target Gene | RSS | Regulon Activity |
| ∗The dot plots of a searched regulon are shown for all cell subpopulations in each disease state of each tissue based on the regulon specific score inferred using pySCENIC and by calculating the average expression. |
| Page: 1 |
Top |
Somatic mutation of malignant transformation related genes |
| Annotation of somatic variants for genes involved in malignant transformation |
| Hugo Symbol | Variant Class | Variant Classification | dbSNP RS | HGVSc | HGVSp | HGVSp Short | SWISSPROT | BIOTYPE | SIFT | PolyPhen | Tumor Sample Barcode | Tissue | Histology | Sex | Age | Stage | Therapy Types | Drugs | Outcome |
| CCND1 | SNV | Missense_Mutation | rs755986542 | c.778N>T | p.Arg260Cys | p.R260C | P24385 | protein_coding | deleterious(0.03) | benign(0.218) | TCGA-BH-A0BP-01 | Breast | breast invasive carcinoma | Female | >=65 | I/II | Unknown | Unknown | SD |
| CCND1 | SNV | Missense_Mutation | c.859N>A | p.Pro287Thr | p.P287T | P24385 | protein_coding | deleterious(0) | probably_damaging(1) | TCGA-JW-A5VH-01 | Cervix | cervical & endocervical cancer | Female | <65 | I/II | Chemotherapy | carboplatin | PD | |
| CCND1 | SNV | Missense_Mutation | c.859N>A | p.Pro287Thr | p.P287T | P24385 | protein_coding | deleterious(0) | probably_damaging(1) | TCGA-VS-A9UJ-01 | Cervix | cervical & endocervical cancer | Female | <65 | I/II | Unknown | Unknown | PD | |
| CCND1 | SNV | Missense_Mutation | novel | c.701C>T | p.Ser234Phe | p.S234F | P24385 | protein_coding | deleterious(0) | probably_damaging(0.99) | TCGA-AA-3692-01 | Colorectum | colon adenocarcinoma | Female | <65 | III/IV | Chemotherapy | folinic | PD |
| CCND1 | SNV | Missense_Mutation | c.859C>A | p.Pro287Thr | p.P287T | P24385 | protein_coding | deleterious(0) | probably_damaging(1) | TCGA-AJ-A2QO-01 | Endometrium | uterine corpus endometrioid carcinoma | Female | >=65 | I/II | Unknown | Unknown | SD | |
| CCND1 | SNV | Missense_Mutation | c.405G>T | p.Glu135Asp | p.E135D | P24385 | protein_coding | tolerated(0.69) | benign(0) | TCGA-AP-A0LM-01 | Endometrium | uterine corpus endometrioid carcinoma | Female | <65 | III/IV | Chemotherapy | cisplatin | SD | |
| CCND1 | SNV | Missense_Mutation | c.860N>A | p.Pro287His | p.P287H | P24385 | protein_coding | deleterious(0) | probably_damaging(1) | TCGA-AP-A1E1-01 | Endometrium | uterine corpus endometrioid carcinoma | Female | >=65 | I/II | Unknown | Unknown | SD | |
| CCND1 | SNV | Missense_Mutation | c.694N>C | p.Phe232Leu | p.F232L | P24385 | protein_coding | tolerated(1) | benign(0) | TCGA-AX-A05Z-01 | Endometrium | uterine corpus endometrioid carcinoma | Female | <65 | III/IV | Chemotherapy | adriamycin | SD | |
| CCND1 | SNV | Missense_Mutation | c.718G>A | p.Asp240Asn | p.D240N | P24385 | protein_coding | deleterious(0) | probably_damaging(0.969) | TCGA-AX-A063-01 | Endometrium | uterine corpus endometrioid carcinoma | Female | <65 | I/II | Unknown | Unknown | SD | |
| CCND1 | SNV | Missense_Mutation | c.512C>T | p.Ala171Val | p.A171V | P24385 | protein_coding | tolerated(0.16) | benign(0.001) | TCGA-AX-A0J0-01 | Endometrium | uterine corpus endometrioid carcinoma | Female | <65 | I/II | Unknown | Unknown | SD |
| Page: 1 2 3 4 5 |
Top |
Related drugs of malignant transformation related genes |
| Identification of chemicals and drugs interact with genes involved in malignant transfromation |
| (DGIdb 4.0) |
| Entrez ID | Symbol | Category | Interaction Types | Drug Claim Name | Drug Name | PMIDs |
| 595 | CCND1 | DRUGGABLE GENOME, CLINICALLY ACTIONABLE, TRANSCRIPTION FACTOR, KINASE, DRUG RESISTANCE | NIFEDIPINE | NIFEDIPINE | 10051745 | |
| 595 | CCND1 | DRUGGABLE GENOME, CLINICALLY ACTIONABLE, TRANSCRIPTION FACTOR, KINASE, DRUG RESISTANCE | fluorouracil | FLUOROURACIL | 23567490 | |
| 595 | CCND1 | DRUGGABLE GENOME, CLINICALLY ACTIONABLE, TRANSCRIPTION FACTOR, KINASE, DRUG RESISTANCE | methotrexate | METHOTREXATE | 12972956,16870553 | |
| 595 | CCND1 | DRUGGABLE GENOME, CLINICALLY ACTIONABLE, TRANSCRIPTION FACTOR, KINASE, DRUG RESISTANCE | lapatinib | LAPATINIB | ||
| 595 | CCND1 | DRUGGABLE GENOME, CLINICALLY ACTIONABLE, TRANSCRIPTION FACTOR, KINASE, DRUG RESISTANCE | ACETAMINOPHEN | ACETAMINOPHEN | 11896290 | |
| 595 | CCND1 | DRUGGABLE GENOME, CLINICALLY ACTIONABLE, TRANSCRIPTION FACTOR, KINASE, DRUG RESISTANCE | ABT-263 | NAVITOCLAX | ||
| 595 | CCND1 | DRUGGABLE GENOME, CLINICALLY ACTIONABLE, TRANSCRIPTION FACTOR, KINASE, DRUG RESISTANCE | PALBOCICLIB | PALBOCICLIB | 24417566 | |
| 595 | CCND1 | DRUGGABLE GENOME, CLINICALLY ACTIONABLE, TRANSCRIPTION FACTOR, KINASE, DRUG RESISTANCE | TROGLITAZONE | TROGLITAZONE | 14764597 | |
| 595 | CCND1 | DRUGGABLE GENOME, CLINICALLY ACTIONABLE, TRANSCRIPTION FACTOR, KINASE, DRUG RESISTANCE | MTX | METHOTREXATE | 12972956 | |
| 595 | CCND1 | DRUGGABLE GENOME, CLINICALLY ACTIONABLE, TRANSCRIPTION FACTOR, KINASE, DRUG RESISTANCE | MPA | PROGESTERONE | 16123159 |
| Page: 1 2 3 4 |

Copyright 2023-Present -The University of Texas Health Science Center at Houston |