
|
|||||
|
 | |
| |
| |
| |
| |
| |
|
Gene: CCL2 |
Gene summary for CCL2 |
| Gene information | Species | Human | Gene symbol | CCL2 | Gene ID | 6347 |
| Gene name | C-C motif chemokine ligand 2 | |
| Gene Alias | GDCF-2 | |
| Cytomap | 17q12 | |
| Gene Type | protein-coding | GO ID | GO:0000082 | UniProtAcc | P13500 |
Top |
Malignant transformation analysis |
| Identification of the aberrant gene expression in precancerous and cancerous lesions by comparing the gene expression of stem-like cells in diseased tissues with normal stem cells |
| Entrez ID | Symbol | Replicates | Species | Organ | Tissue | Adj P-value | Log2FC | Malignancy |
| 6347 | CCL2 | GSM4909281 | Human | Breast | IDC | 1.51e-18 | -6.40e-01 | 0.21 |
| 6347 | CCL2 | GSM4909282 | Human | Breast | IDC | 2.04e-05 | -5.16e-01 | -0.0288 |
| 6347 | CCL2 | GSM4909285 | Human | Breast | IDC | 2.86e-19 | -6.38e-01 | 0.21 |
| 6347 | CCL2 | GSM4909286 | Human | Breast | IDC | 6.58e-19 | -6.36e-01 | 0.1081 |
| 6347 | CCL2 | GSM4909287 | Human | Breast | IDC | 1.03e-06 | -4.98e-01 | 0.2057 |
| 6347 | CCL2 | GSM4909289 | Human | Breast | IDC | 3.57e-03 | -6.40e-01 | 0.1064 |
| 6347 | CCL2 | GSM4909290 | Human | Breast | IDC | 1.10e-09 | -6.09e-01 | 0.2096 |
| 6347 | CCL2 | GSM4909291 | Human | Breast | IDC | 1.89e-03 | -5.47e-01 | 0.1753 |
| 6347 | CCL2 | GSM4909293 | Human | Breast | IDC | 4.62e-15 | -6.20e-01 | 0.1581 |
| 6347 | CCL2 | GSM4909294 | Human | Breast | IDC | 1.24e-19 | -6.29e-01 | 0.2022 |
| 6347 | CCL2 | GSM4909296 | Human | Breast | IDC | 5.76e-17 | -6.13e-01 | 0.1524 |
| 6347 | CCL2 | GSM4909297 | Human | Breast | IDC | 1.51e-18 | -6.30e-01 | 0.1517 |
| 6347 | CCL2 | GSM4909298 | Human | Breast | IDC | 7.38e-15 | -6.27e-01 | 0.1551 |
| 6347 | CCL2 | GSM4909299 | Human | Breast | IDC | 6.17e-05 | -5.31e-01 | 0.035 |
| 6347 | CCL2 | GSM4909300 | Human | Breast | IDC | 2.84e-02 | -5.55e-01 | 0.0334 |
| 6347 | CCL2 | GSM4909301 | Human | Breast | IDC | 1.13e-09 | -5.71e-01 | 0.1577 |
| 6347 | CCL2 | GSM4909302 | Human | Breast | IDC | 1.30e-12 | -6.06e-01 | 0.1545 |
| 6347 | CCL2 | GSM4909303 | Human | Breast | IDC | 2.35e-05 | -6.40e-01 | 0.0438 |
| 6347 | CCL2 | GSM4909304 | Human | Breast | IDC | 6.58e-19 | -6.39e-01 | 0.1636 |
| 6347 | CCL2 | GSM4909305 | Human | Breast | IDC | 3.49e-05 | -5.57e-01 | 0.0436 |
| Page: 1 2 3 4 5 6 7 8 |
| Tissue | Expression Dynamics | Abbreviation |
| Breast | 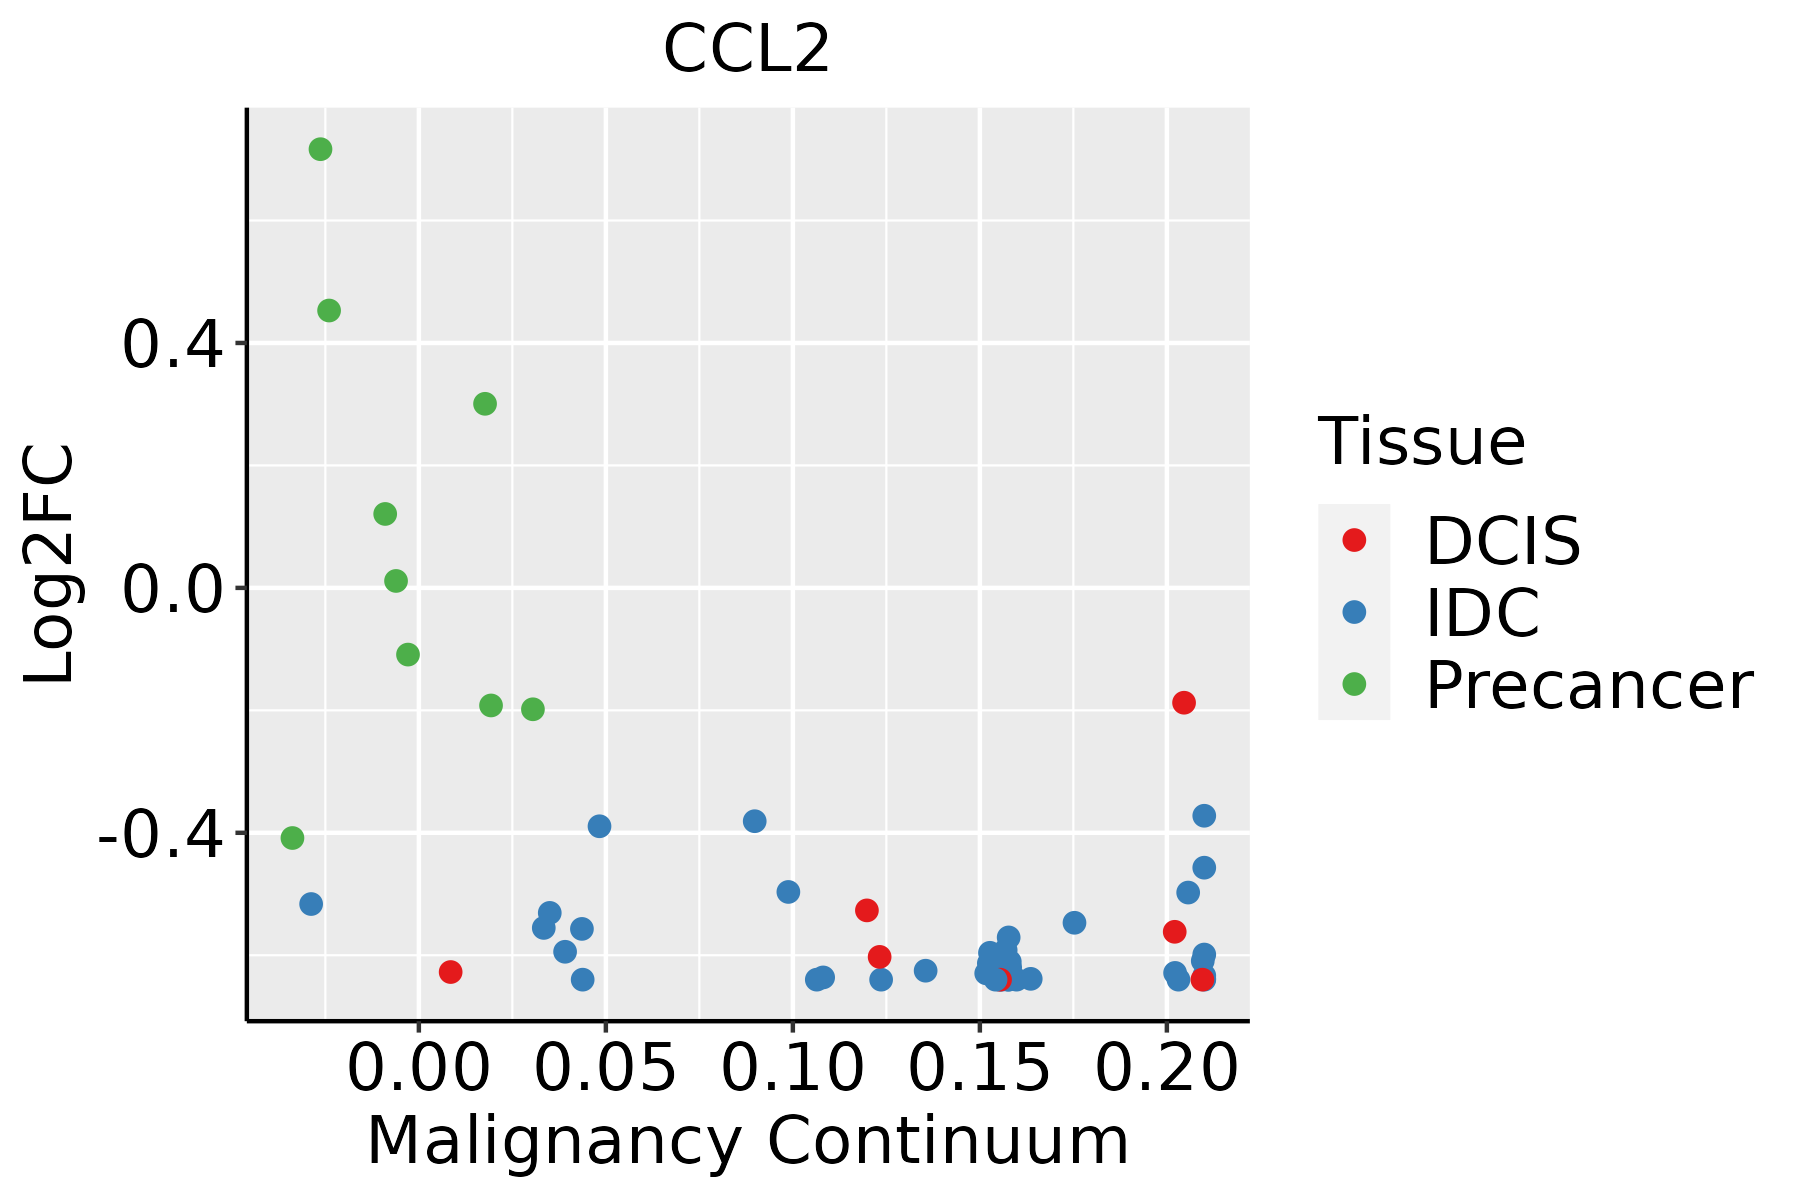 | IDC: Invasive ductal carcinoma |
| DCIS: Ductal carcinoma in situ | ||
| Precancer(BRCA1-mut): Precancerous lesion from BRCA1 mutation carriers | ||
| Cervix | 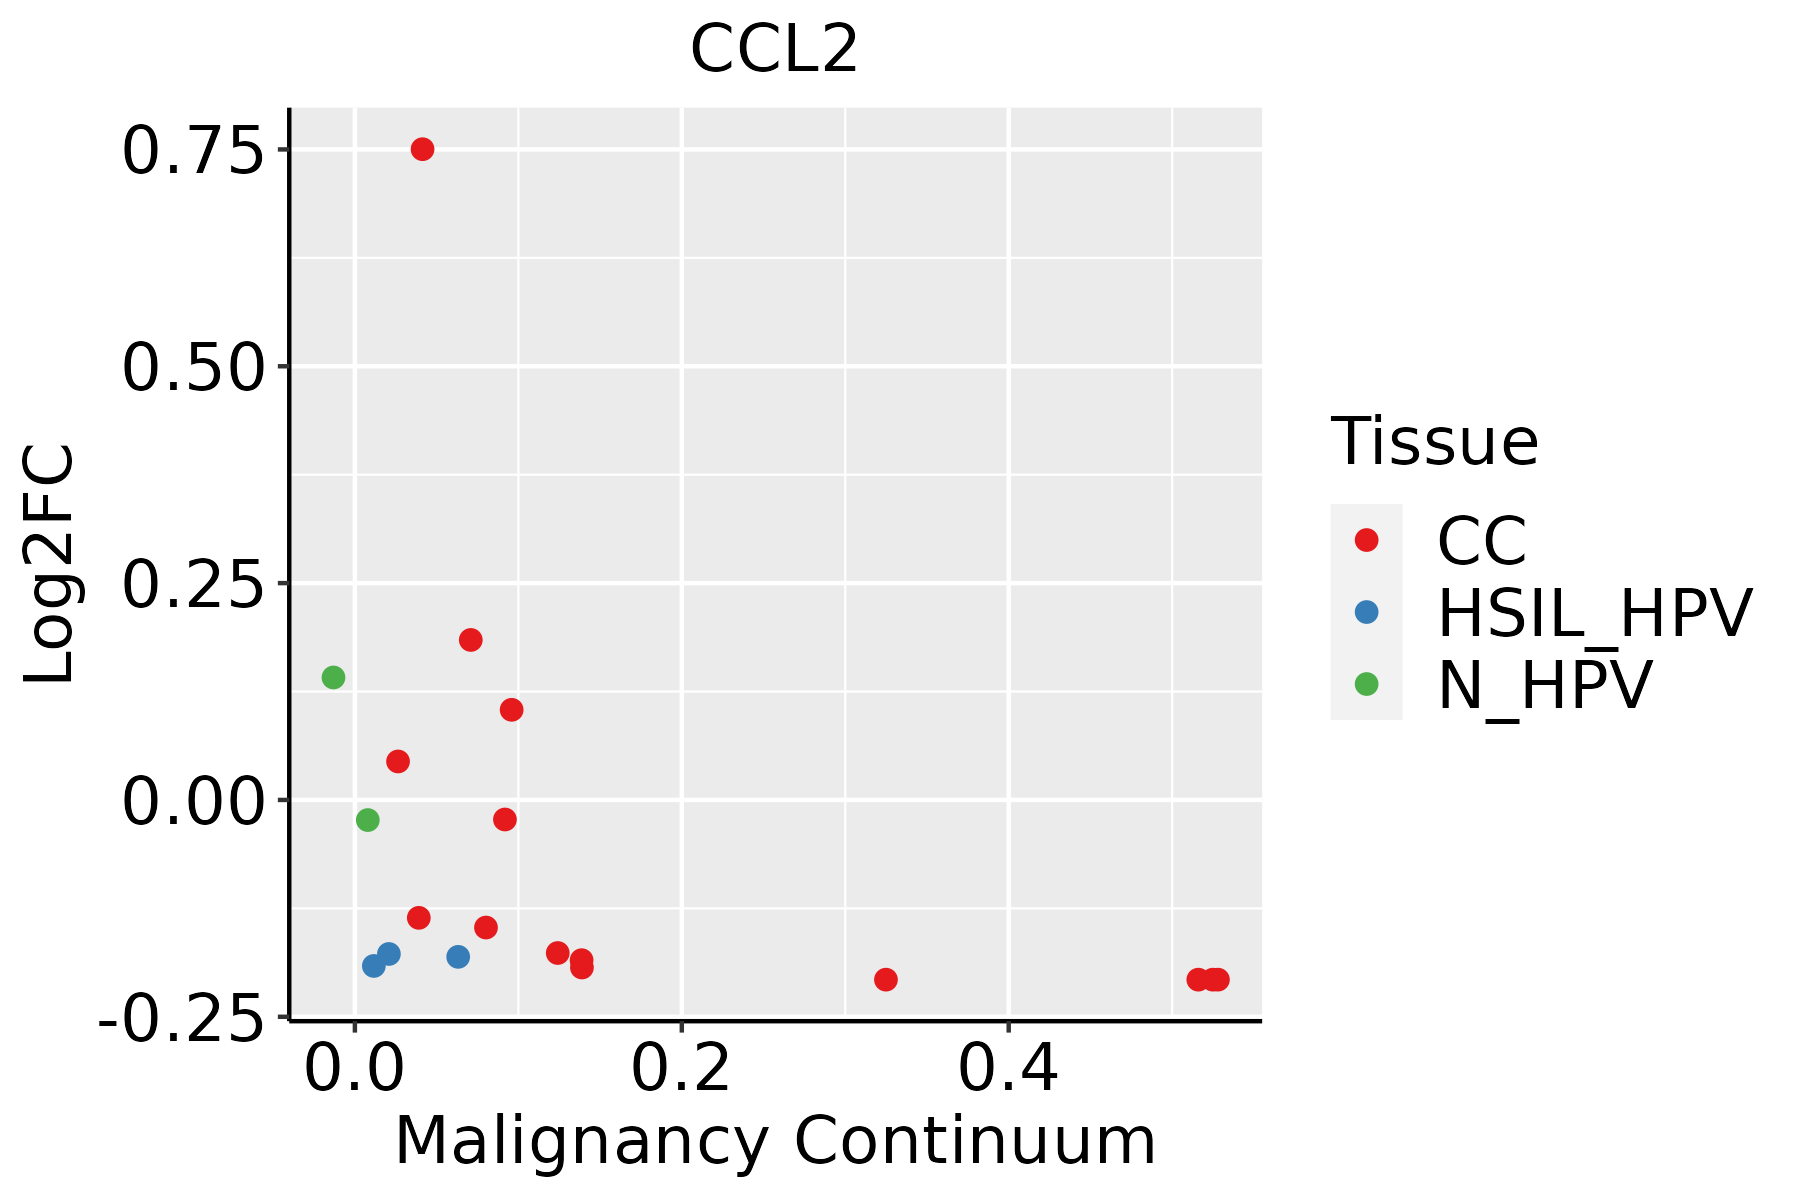 | CC: Cervix cancer |
| HSIL_HPV: HPV-infected high-grade squamous intraepithelial lesions | ||
| N_HPV: HPV-infected normal cervix | ||
| Esophagus | 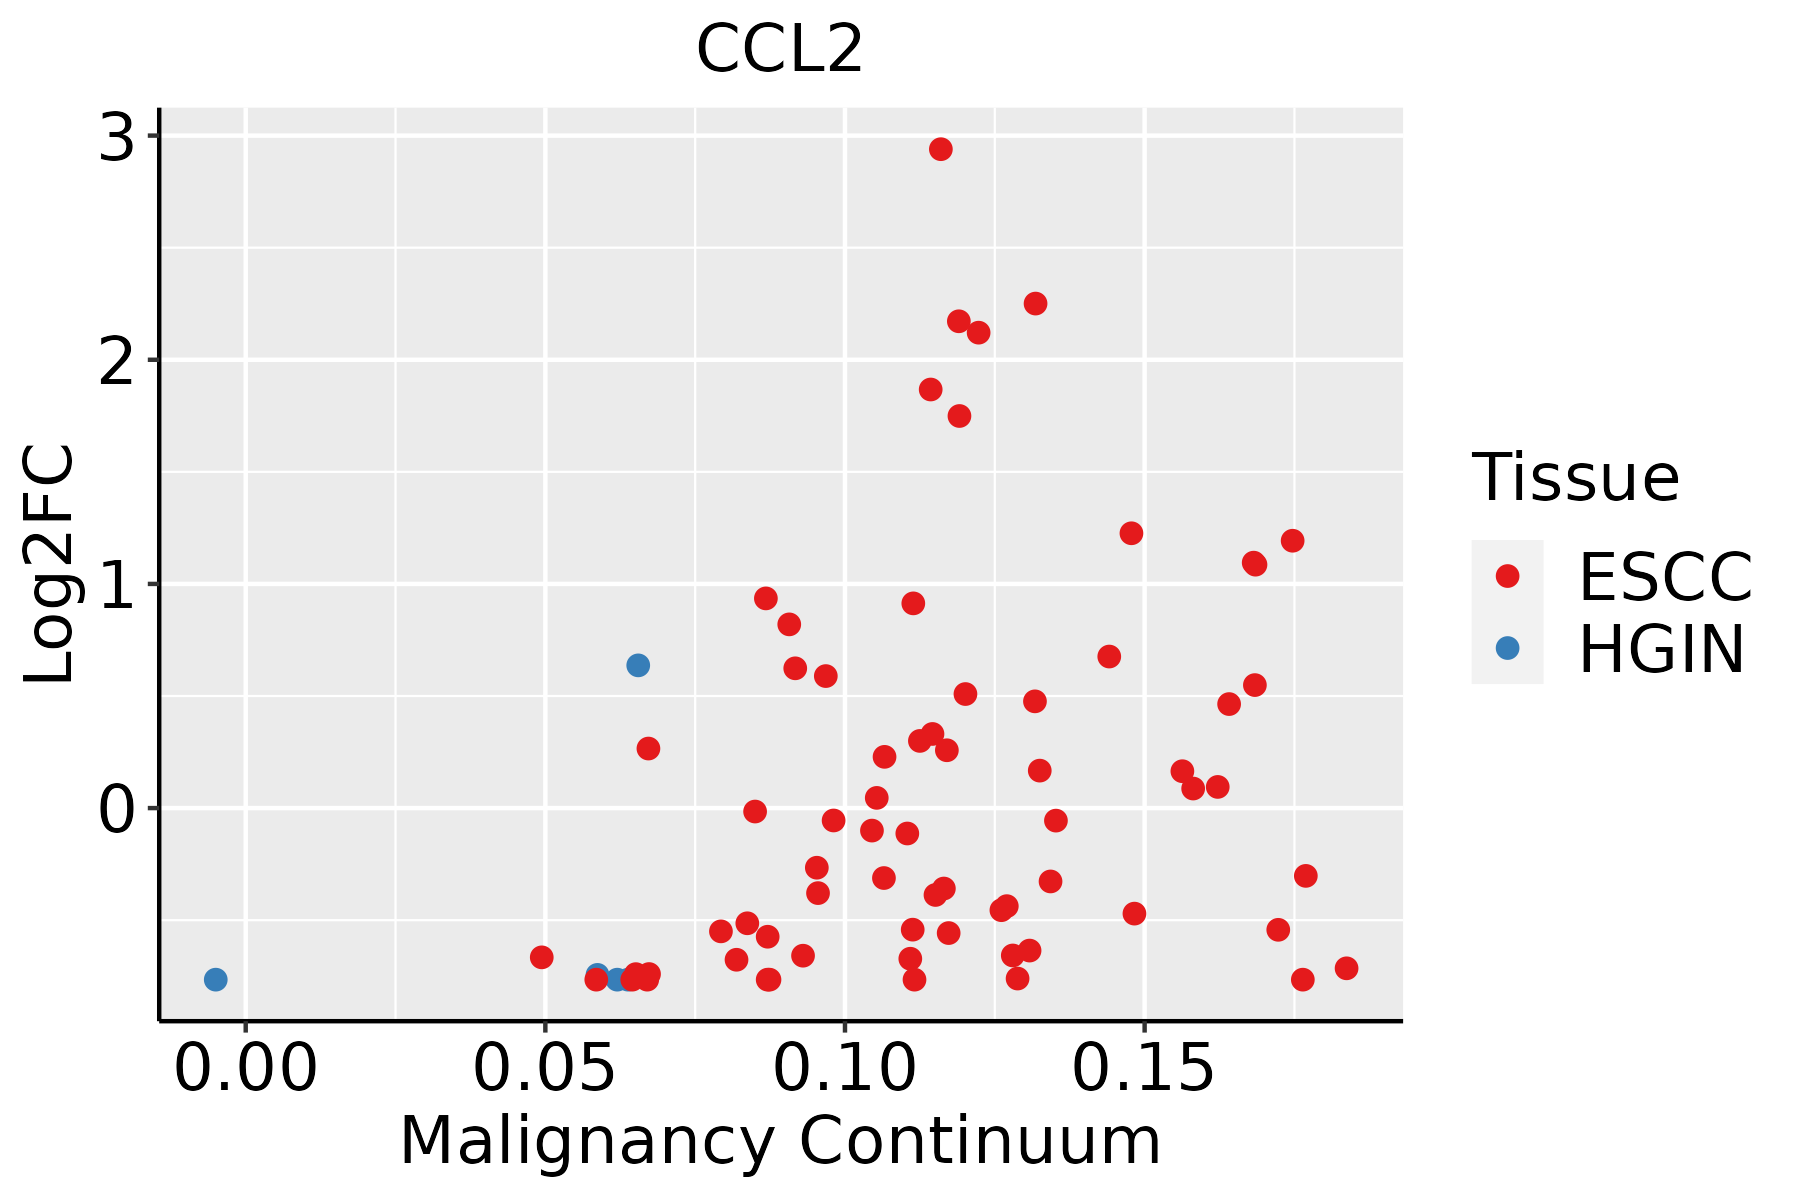 | ESCC: Esophageal squamous cell carcinoma |
| HGIN: High-grade intraepithelial neoplasias | ||
| LGIN: Low-grade intraepithelial neoplasias | ||
| Liver |  | HCC: Hepatocellular carcinoma |
| NAFLD: Non-alcoholic fatty liver disease | ||
| Lung |  | AAH: Atypical adenomatous hyperplasia |
| AIS: Adenocarcinoma in situ | ||
| IAC: Invasive lung adenocarcinoma | ||
| MIA: Minimally invasive adenocarcinoma | ||
| Oral Cavity |  | EOLP: Erosive Oral lichen planus |
| LP: leukoplakia | ||
| NEOLP: Non-erosive oral lichen planus | ||
| OSCC: Oral squamous cell carcinoma | ||
| Prostate | 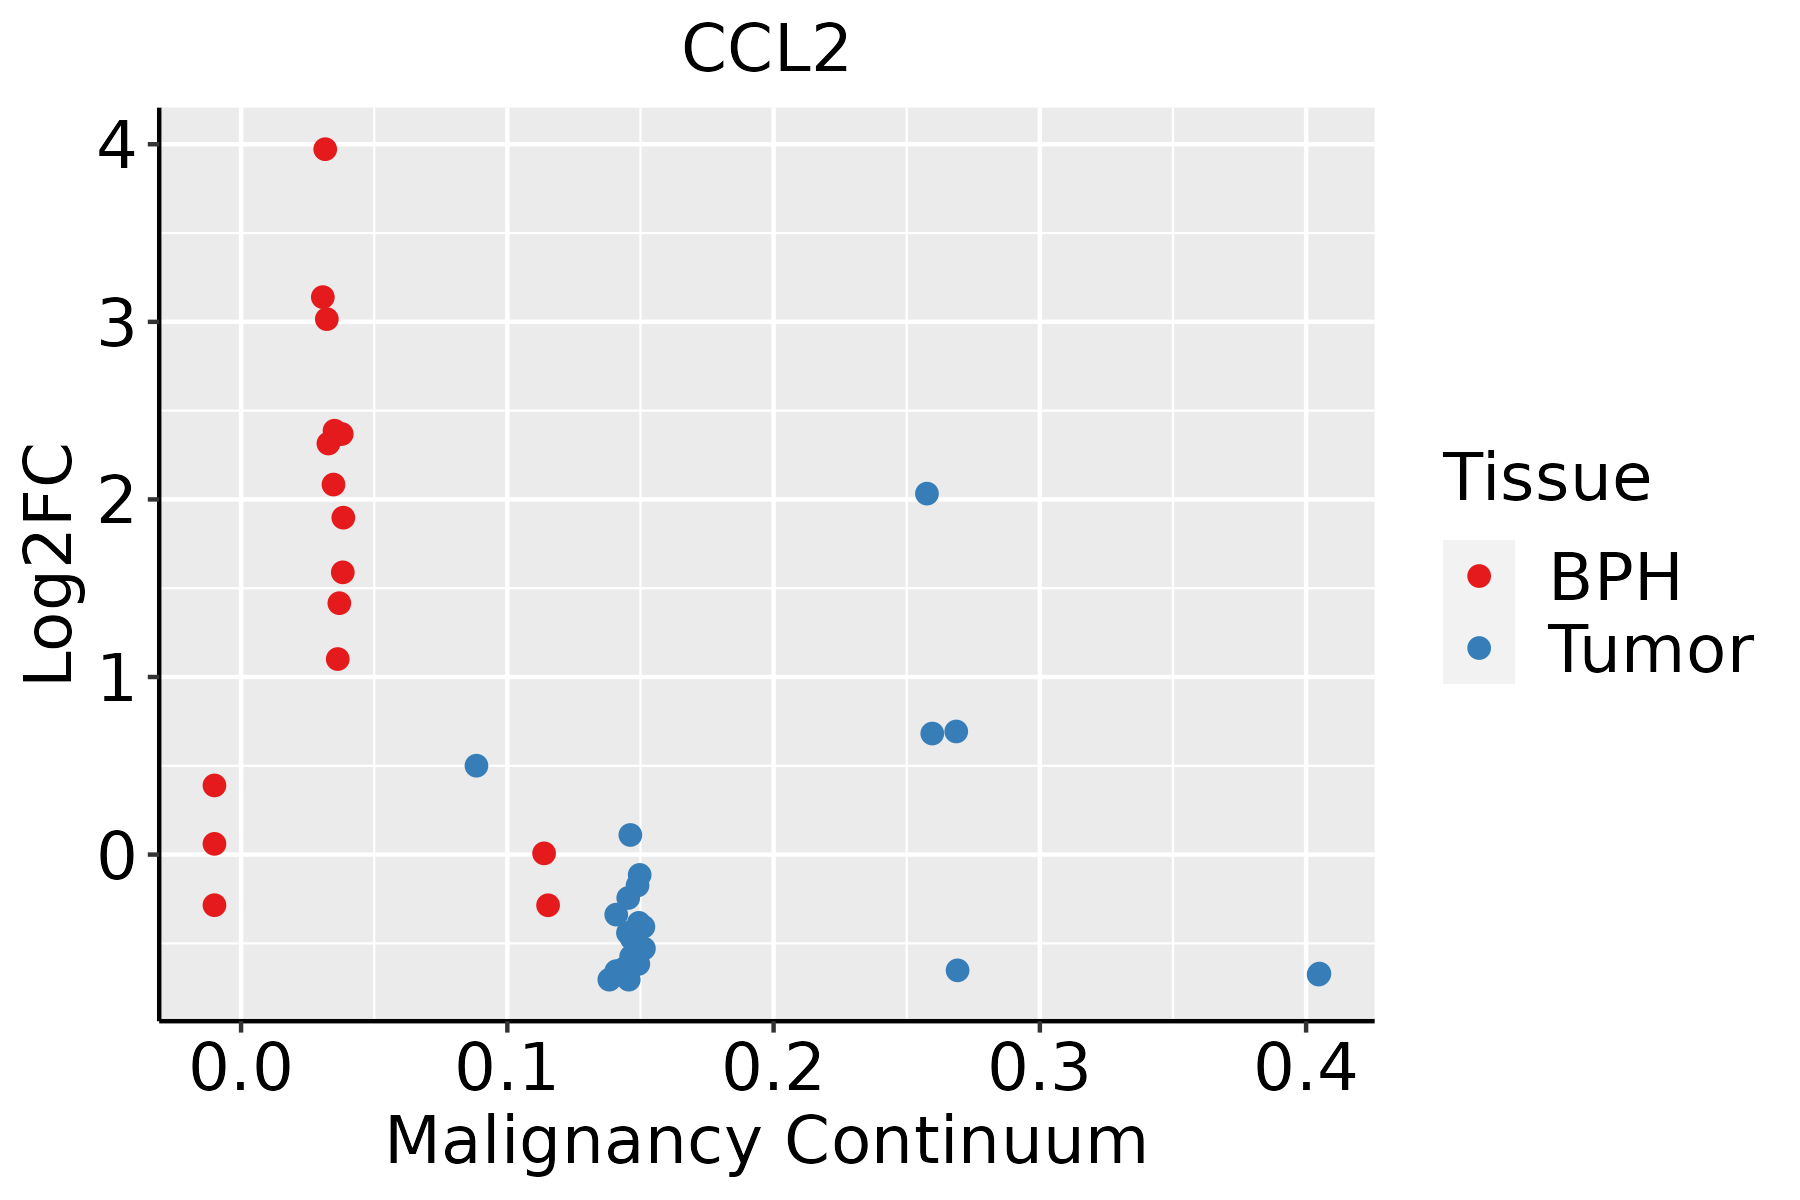 | BPH: Benign Prostatic Hyperplasia |
| Skin | 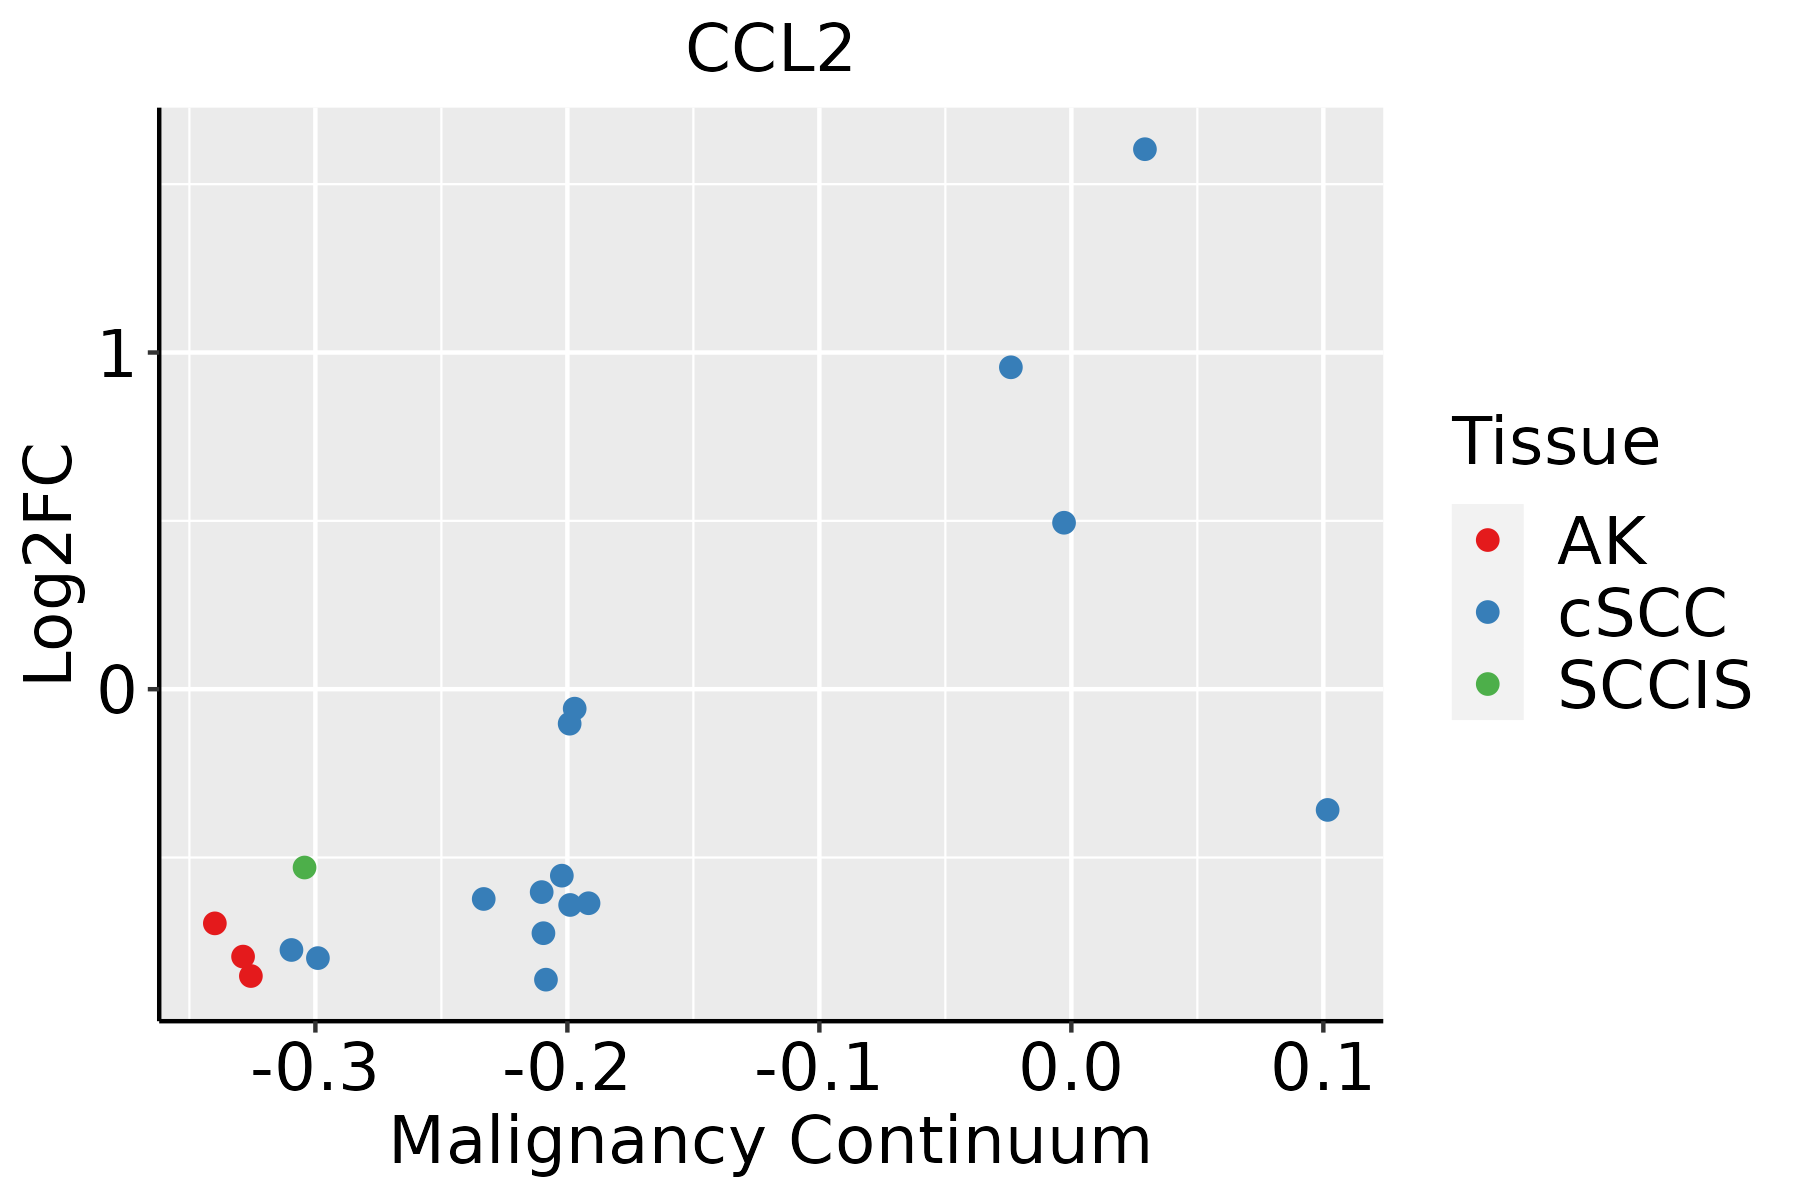 | AK: Actinic keratosis |
| cSCC: Cutaneous squamous cell carcinoma | ||
| SCCIS:squamous cell carcinoma in situ |
| ∗log2FC in expression of this searched gene in stem-like cells from each diseased tissue sample relative to stem-like cells in normal samples in each tissue plotted against the malignancy continuum. Samples are colored based on if they are from different disease stage. |
Top |
Malignant transformation related pathway analysis |
| Find out the enriched GO biological processes and KEGG pathways involved in transition from healthy to precancer to cancer |
| Tissue | Disease Stage | Enriched GO biological Processes |
| Colorectum | AD |  |
| Colorectum | SER |  |
| Colorectum | MSS |  |
| Colorectum | MSI-H |  |
| Colorectum | FAP |  |
| ∗Top 15 enriched GO BP terms are showed in the bar plot of each disease state in each tissue. Each row represents a significant GO biological process which is colored according to the -log10(p.adjust). |
| Page: 1 2 3 4 5 6 7 8 9 |
| GO ID | Tissue | Disease Stage | Description | Gene Ratio | Bg Ratio | pvalue | p.adjust | Count |
| GO:00224083 | Stomach | GC | negative regulation of cell-cell adhesion | 22/1159 | 196/18723 | 5.02e-03 | 3.98e-02 | 22 |
| GO:00071605 | Stomach | GC | cell-matrix adhesion | 25/1159 | 233/18723 | 5.24e-03 | 4.11e-02 | 25 |
| GO:0071677 | Stomach | GC | positive regulation of mononuclear cell migration | 10/1159 | 65/18723 | 6.34e-03 | 4.73e-02 | 10 |
| GO:00509001 | Stomach | CAG with IM | leukocyte migration | 40/1050 | 369/18723 | 5.16e-05 | 1.32e-03 | 40 |
| GO:00713561 | Stomach | CAG with IM | cellular response to tumor necrosis factor | 28/1050 | 229/18723 | 8.83e-05 | 2.04e-03 | 28 |
| GO:00305951 | Stomach | CAG with IM | leukocyte chemotaxis | 28/1050 | 230/18723 | 9.52e-05 | 2.16e-03 | 28 |
| GO:00026851 | Stomach | CAG with IM | regulation of leukocyte migration | 26/1050 | 210/18723 | 1.27e-04 | 2.64e-03 | 26 |
| GO:00026871 | Stomach | CAG with IM | positive regulation of leukocyte migration | 19/1050 | 135/18723 | 1.92e-04 | 3.62e-03 | 19 |
| GO:00346121 | Stomach | CAG with IM | response to tumor necrosis factor | 29/1050 | 253/18723 | 2.08e-04 | 3.88e-03 | 29 |
| GO:00716211 | Stomach | CAG with IM | granulocyte chemotaxis | 18/1050 | 125/18723 | 2.10e-04 | 3.90e-03 | 18 |
| GO:00975301 | Stomach | CAG with IM | granulocyte migration | 19/1050 | 148/18723 | 6.27e-04 | 8.92e-03 | 19 |
| GO:00975291 | Stomach | CAG with IM | myeloid leukocyte migration | 25/1050 | 220/18723 | 6.28e-04 | 8.92e-03 | 25 |
| GO:00427421 | Stomach | CAG with IM | defense response to bacterium | 34/1050 | 350/18723 | 1.32e-03 | 1.56e-02 | 34 |
| GO:00603261 | Stomach | CAG with IM | cell chemotaxis | 31/1050 | 310/18723 | 1.33e-03 | 1.57e-02 | 31 |
| GO:00716741 | Stomach | CAG with IM | mononuclear cell migration | 22/1050 | 196/18723 | 1.52e-03 | 1.70e-02 | 22 |
| GO:00305931 | Stomach | CAG with IM | neutrophil chemotaxis | 14/1050 | 103/18723 | 1.81e-03 | 1.94e-02 | 14 |
| GO:00716771 | Stomach | CAG with IM | positive regulation of mononuclear cell migration | 10/1050 | 65/18723 | 3.17e-03 | 2.95e-02 | 10 |
| GO:19902661 | Stomach | CAG with IM | neutrophil migration | 15/1050 | 122/18723 | 3.43e-03 | 3.08e-02 | 15 |
| GO:00716752 | Stomach | CAG with IM | regulation of mononuclear cell migration | 14/1050 | 115/18723 | 5.03e-03 | 4.05e-02 | 14 |
| GO:00509002 | Stomach | CSG | leukocyte migration | 40/1034 | 369/18723 | 3.68e-05 | 9.87e-04 | 40 |
| Page: 1 2 3 4 5 6 7 8 9 10 11 12 13 14 15 16 17 18 19 20 21 22 23 24 25 26 27 28 29 30 31 32 33 34 35 36 37 38 39 40 41 42 43 44 45 46 47 48 49 50 51 52 53 54 55 56 57 58 59 60 61 62 63 |
| Pathway ID | Tissue | Disease Stage | Description | Gene Ratio | Bg Ratio | pvalue | p.adjust | qvalue | Count |
| hsa0517118 | Breast | Precancer | Coronavirus disease - COVID-19 | 81/684 | 232/8465 | 3.74e-32 | 2.36e-30 | 1.81e-30 | 81 |
| hsa0541818 | Breast | Precancer | Fluid shear stress and atherosclerosis | 28/684 | 139/8465 | 4.74e-06 | 6.00e-05 | 4.59e-05 | 28 |
| hsa0541718 | Breast | Precancer | Lipid and atherosclerosis | 37/684 | 215/8465 | 7.64e-06 | 9.29e-05 | 7.12e-05 | 37 |
| hsa0465716 | Breast | Precancer | IL-17 signaling pathway | 20/684 | 94/8465 | 4.74e-05 | 4.54e-04 | 3.48e-04 | 20 |
| hsa0532312 | Breast | Precancer | Rheumatoid arthritis | 19/684 | 93/8465 | 1.30e-04 | 1.14e-03 | 8.73e-04 | 19 |
| hsa0516316 | Breast | Precancer | Human cytomegalovirus infection | 32/684 | 225/8465 | 1.13e-03 | 7.57e-03 | 5.80e-03 | 32 |
| hsa0517119 | Breast | Precancer | Coronavirus disease - COVID-19 | 81/684 | 232/8465 | 3.74e-32 | 2.36e-30 | 1.81e-30 | 81 |
| hsa0541819 | Breast | Precancer | Fluid shear stress and atherosclerosis | 28/684 | 139/8465 | 4.74e-06 | 6.00e-05 | 4.59e-05 | 28 |
| hsa0541719 | Breast | Precancer | Lipid and atherosclerosis | 37/684 | 215/8465 | 7.64e-06 | 9.29e-05 | 7.12e-05 | 37 |
| hsa0465717 | Breast | Precancer | IL-17 signaling pathway | 20/684 | 94/8465 | 4.74e-05 | 4.54e-04 | 3.48e-04 | 20 |
| hsa0532313 | Breast | Precancer | Rheumatoid arthritis | 19/684 | 93/8465 | 1.30e-04 | 1.14e-03 | 8.73e-04 | 19 |
| hsa0516317 | Breast | Precancer | Human cytomegalovirus infection | 32/684 | 225/8465 | 1.13e-03 | 7.57e-03 | 5.80e-03 | 32 |
| hsa0517124 | Breast | IDC | Coronavirus disease - COVID-19 | 86/867 | 232/8465 | 1.50e-28 | 9.72e-27 | 7.27e-27 | 86 |
| hsa0541824 | Breast | IDC | Fluid shear stress and atherosclerosis | 34/867 | 139/8465 | 9.41e-07 | 1.61e-05 | 1.20e-05 | 34 |
| hsa0516324 | Breast | IDC | Human cytomegalovirus infection | 39/867 | 225/8465 | 6.66e-04 | 5.41e-03 | 4.05e-03 | 39 |
| hsa0541724 | Breast | IDC | Lipid and atherosclerosis | 35/867 | 215/8465 | 3.67e-03 | 2.29e-02 | 1.71e-02 | 35 |
| hsa0517134 | Breast | IDC | Coronavirus disease - COVID-19 | 86/867 | 232/8465 | 1.50e-28 | 9.72e-27 | 7.27e-27 | 86 |
| hsa0541834 | Breast | IDC | Fluid shear stress and atherosclerosis | 34/867 | 139/8465 | 9.41e-07 | 1.61e-05 | 1.20e-05 | 34 |
| hsa0516334 | Breast | IDC | Human cytomegalovirus infection | 39/867 | 225/8465 | 6.66e-04 | 5.41e-03 | 4.05e-03 | 39 |
| hsa0541734 | Breast | IDC | Lipid and atherosclerosis | 35/867 | 215/8465 | 3.67e-03 | 2.29e-02 | 1.71e-02 | 35 |
| Page: 1 2 3 4 5 6 7 8 9 10 11 |
Top |
Cell-cell communication analysis |
| Identification of potential cell-cell interactions between two cell types and their ligand-receptor pairs for different disease states |
| Ligand | Receptor | LRpair | Pathway | Tissue | Disease Stage |
| CCL2 | CCR2 | CCL2_CCR2 | CCL | Breast | DCIS |
| CCL2 | ACKR1 | CCL2_ACKR1 | CCL | Breast | DCIS |
| CCL2 | ACKR1 | CCL2_ACKR1 | CCL | Breast | Healthy |
| CCL2 | ACKR1 | CCL2_ACKR1 | CCL | Breast | IDC |
| CCL2 | ACKR1 | CCL2_ACKR1 | CCL | Breast | Precancer |
| CCL2 | ACKR1 | CCL2_ACKR1 | CCL | Cervix | ADJ |
| CCL2 | ACKR1 | CCL2_ACKR1 | CCL | Cervix | CC |
| CCL2 | ACKR1 | CCL2_ACKR1 | CCL | Cervix | Precancer |
| CCL2 | ACKR1 | CCL2_ACKR1 | CCL | CRC | AD |
| CCL2 | ACKR1 | CCL2_ACKR1 | CCL | CRC | SER |
| CCL2 | ACKR1 | CCL2_ACKR1 | CCL | Endometrium | ADJ |
| CCL2 | ACKR1 | CCL2_ACKR1 | CCL | Endometrium | AEH |
| CCL2 | ACKR1 | CCL2_ACKR1 | CCL | Endometrium | Healthy |
| CCL2 | ACKR1 | CCL2_ACKR1 | CCL | Esophagus | ESCC |
| CCL2 | ACKR2 | CCL2_ACKR2 | CCL | Esophagus | ESCC |
| CCL2 | ACKR1 | CCL2_ACKR1 | CCL | Esophagus | Healthy |
| CCL2 | ACKR1 | CCL2_ACKR1 | CCL | GC | ADJ |
| CCL2 | ACKR1 | CCL2_ACKR1 | CCL | GC | GC |
| CCL2 | ACKR1 | CCL2_ACKR1 | CCL | GC | Healthy |
| CCL2 | ACKR1 | CCL2_ACKR1 | CCL | HNSCC | ADJ |
| Page: 1 2 3 |
Top |
Single-cell gene regulatory network inference analysis |
| Find out the significant the regulons (TFs) and the target genes of each regulon across cell types for different disease states |
| TF | Cell Type | Tissue | Disease Stage | Target Gene | RSS | Regulon Activity |
| ∗The dot plots of a searched regulon are shown for all cell subpopulations in each disease state of each tissue based on the regulon specific score inferred using pySCENIC and by calculating the average expression. |
| Page: 1 |
Top |
Somatic mutation of malignant transformation related genes |
| Annotation of somatic variants for genes involved in malignant transformation |
| Hugo Symbol | Variant Class | Variant Classification | dbSNP RS | HGVSc | HGVSp | HGVSp Short | SWISSPROT | BIOTYPE | SIFT | PolyPhen | Tumor Sample Barcode | Tissue | Histology | Sex | Age | Stage | Therapy Types | Drugs | Outcome |
| CCL2 | SNV | Missense_Mutation | c.200N>G | p.Lys67Arg | p.K67R | P13500 | protein_coding | tolerated(0.22) | benign(0.029) | TCGA-C8-A26Y-01 | Breast | breast invasive carcinoma | Female | >=65 | I/II | Unknown | Unknown | SD | |
| CCL2 | SNV | Missense_Mutation | c.149N>T | p.Ser50Ile | p.S50I | P13500 | protein_coding | deleterious(0) | probably_damaging(0.995) | TCGA-AA-A02R-01 | Colorectum | colon adenocarcinoma | Female | >=65 | I/II | Unknown | Unknown | PD | |
| CCL2 | SNV | Missense_Mutation | rs148937652 | c.146N>T | p.Ala49Val | p.A49V | P13500 | protein_coding | tolerated(0.32) | benign(0.015) | TCGA-G4-6302-01 | Colorectum | colon adenocarcinoma | Female | >=65 | I/II | Unknown | Unknown | SD |
| CCL2 | SNV | Missense_Mutation | novel | c.164C>T | p.Thr55Ile | p.T55I | P13500 | protein_coding | deleterious(0.02) | possibly_damaging(0.678) | TCGA-AJ-A3BG-01 | Endometrium | uterine corpus endometrioid carcinoma | Female | >=65 | I/II | Chemotherapy | carboplatin | PD |
| CCL2 | SNV | Missense_Mutation | novel | c.87N>A | p.Asn29Lys | p.N29K | P13500 | protein_coding | tolerated(0.07) | benign(0.098) | TCGA-AP-A1E4-01 | Endometrium | uterine corpus endometrioid carcinoma | Female | <65 | I/II | Hormone Therapy | zometa | SD |
| CCL2 | SNV | Missense_Mutation | novel | c.239N>G | p.Gln80Arg | p.Q80R | P13500 | protein_coding | deleterious(0.02) | possibly_damaging(0.589) | TCGA-55-8506-01 | Lung | lung adenocarcinoma | Female | <65 | I/II | Unknown | Unknown | SD |
| CCL2 | SNV | Missense_Mutation | novel | c.273C>A | p.Asp91Glu | p.D91E | P13500 | protein_coding | deleterious(0.04) | probably_damaging(0.927) | TCGA-78-7155-01 | Lung | lung adenocarcinoma | Male | >=65 | I/II | Chemotherapy | carboplatin | PD |
| CCL2 | SNV | Missense_Mutation | novel | c.178N>A | p.Pro60Thr | p.P60T | P13500 | protein_coding | deleterious(0.03) | possibly_damaging(0.718) | TCGA-CV-5970-01 | Oral cavity | head & neck squamous cell carcinoma | Male | <65 | I/II | Unknown | Unknown | PD |
| CCL2 | SNV | Missense_Mutation | novel | c.240N>C | p.Gln80His | p.Q80H | P13500 | protein_coding | deleterious(0.02) | probably_damaging(0.928) | TCGA-CV-6961-01 | Oral cavity | head & neck squamous cell carcinoma | Male | <65 | I/II | Unknown | Unknown | PD |
| CCL2 | SNV | Missense_Mutation | c.104G>A | p.Cys35Tyr | p.C35Y | P13500 | protein_coding | deleterious(0) | probably_damaging(0.999) | TCGA-F1-6177-01 | Stomach | stomach adenocarcinoma | Male | >=65 | I/II | Unknown | Unknown | SD |
| Page: 1 2 |
Top |
Related drugs of malignant transformation related genes |
| Identification of chemicals and drugs interact with genes involved in malignant transfromation |
| (DGIdb 4.0) |
| Entrez ID | Symbol | Category | Interaction Types | Drug Claim Name | Drug Name | PMIDs |
| 6347 | CCL2 | DRUGGABLE GENOME | NOX-E36 | |||
| 6347 | CCL2 | DRUGGABLE GENOME | Bindarit | BINDARIT | ||
| 6347 | CCL2 | DRUGGABLE GENOME | RS-504393 | |||
| 6347 | CCL2 | DRUGGABLE GENOME | MCP-1 | |||
| 6347 | CCL2 | DRUGGABLE GENOME | NOX-E36 | |||
| 6347 | CCL2 | DRUGGABLE GENOME | Carlumab | CARLUMAB | ||
| 6347 | CCL2 | DRUGGABLE GENOME | inhibitor | CHEMBL1742999 | CARLUMAB | |
| 6347 | CCL2 | DRUGGABLE GENOME | risperidone | RISPERIDONE | 24495780 |
| Page: 1 |

Copyright 2023-Present -The University of Texas Health Science Center at Houston |