
|
|||||
|
 | |
| |
| |
| |
| |
| |
|
Gene: YES1 |
Gene summary for YES1 |
| Gene information | Species | Human | Gene symbol | YES1 | Gene ID | 7525 |
| Gene name | YES proto-oncogene 1, Src family tyrosine kinase | |
| Gene Alias | HsT441 | |
| Cytomap | 18p11.32 | |
| Gene Type | protein-coding | GO ID | GO:0001775 | UniProtAcc | P07947 |
Top |
Malignant transformation analysis |
| Identification of the aberrant gene expression in precancerous and cancerous lesions by comparing the gene expression of stem-like cells in diseased tissues with normal stem cells |
| Entrez ID | Symbol | Replicates | Species | Organ | Tissue | Adj P-value | Log2FC | Malignancy |
| 7525 | YES1 | AEH-subject1 | Human | Endometrium | AEH | 4.35e-09 | 3.71e-01 | -0.3059 |
| 7525 | YES1 | AEH-subject3 | Human | Endometrium | AEH | 5.28e-04 | 2.41e-01 | -0.2576 |
| 7525 | YES1 | EEC-subject1 | Human | Endometrium | EEC | 3.91e-12 | 3.98e-01 | -0.2682 |
| 7525 | YES1 | EEC-subject3 | Human | Endometrium | EEC | 2.37e-03 | 2.16e-01 | -0.2525 |
| 7525 | YES1 | GSM6177620_NYU_UCEC1_lib1_lib1 | Human | Endometrium | EEC | 7.80e-12 | 2.22e-02 | -0.1869 |
| 7525 | YES1 | GSM6177620_NYU_UCEC1_lib2_lib2 | Human | Endometrium | EEC | 2.47e-09 | -2.95e-02 | -0.1875 |
| 7525 | YES1 | GSM6177620_NYU_UCEC1_lib3_lib3 | Human | Endometrium | EEC | 8.19e-13 | -2.92e-04 | -0.1883 |
| 7525 | YES1 | GSM6177621_NYU_UCEC2_lib1_lib1 | Human | Endometrium | EEC | 5.50e-05 | -4.11e-02 | -0.1934 |
| 7525 | YES1 | GSM6177622_NYU_UCEC3_lib1_lib1 | Human | Endometrium | EEC | 2.43e-09 | -3.27e-02 | -0.1917 |
| 7525 | YES1 | GSM6177622_NYU_UCEC3_lib2_lib2 | Human | Endometrium | EEC | 3.17e-12 | -8.19e-02 | -0.1916 |
| 7525 | YES1 | LZE2T | Human | Esophagus | ESCC | 3.00e-11 | 1.99e+00 | 0.082 |
| 7525 | YES1 | LZE4T | Human | Esophagus | ESCC | 2.96e-13 | 1.79e-01 | 0.0811 |
| 7525 | YES1 | LZE5T | Human | Esophagus | ESCC | 6.04e-05 | 1.18e-01 | 0.0514 |
| 7525 | YES1 | LZE7T | Human | Esophagus | ESCC | 8.23e-03 | 1.07e-01 | 0.0667 |
| 7525 | YES1 | LZE8T | Human | Esophagus | ESCC | 6.50e-07 | 1.71e-01 | 0.067 |
| 7525 | YES1 | LZE20T | Human | Esophagus | ESCC | 2.00e-04 | 9.74e-02 | 0.0662 |
| 7525 | YES1 | LZE22T | Human | Esophagus | ESCC | 1.45e-09 | 2.70e-01 | 0.068 |
| 7525 | YES1 | LZE24T | Human | Esophagus | ESCC | 1.00e-22 | 5.71e-01 | 0.0596 |
| 7525 | YES1 | LZE6T | Human | Esophagus | ESCC | 6.55e-05 | 6.71e-01 | 0.0845 |
| 7525 | YES1 | P1T-E | Human | Esophagus | ESCC | 8.32e-16 | 7.99e-01 | 0.0875 |
| Page: 1 2 3 4 5 6 7 8 |
| Tissue | Expression Dynamics | Abbreviation |
| Endometrium |  | AEH: Atypical endometrial hyperplasia |
| EEC: Endometrioid Cancer | ||
| Esophagus |  | ESCC: Esophageal squamous cell carcinoma |
| HGIN: High-grade intraepithelial neoplasias | ||
| LGIN: Low-grade intraepithelial neoplasias | ||
| Liver |  | HCC: Hepatocellular carcinoma |
| NAFLD: Non-alcoholic fatty liver disease | ||
| Lung | 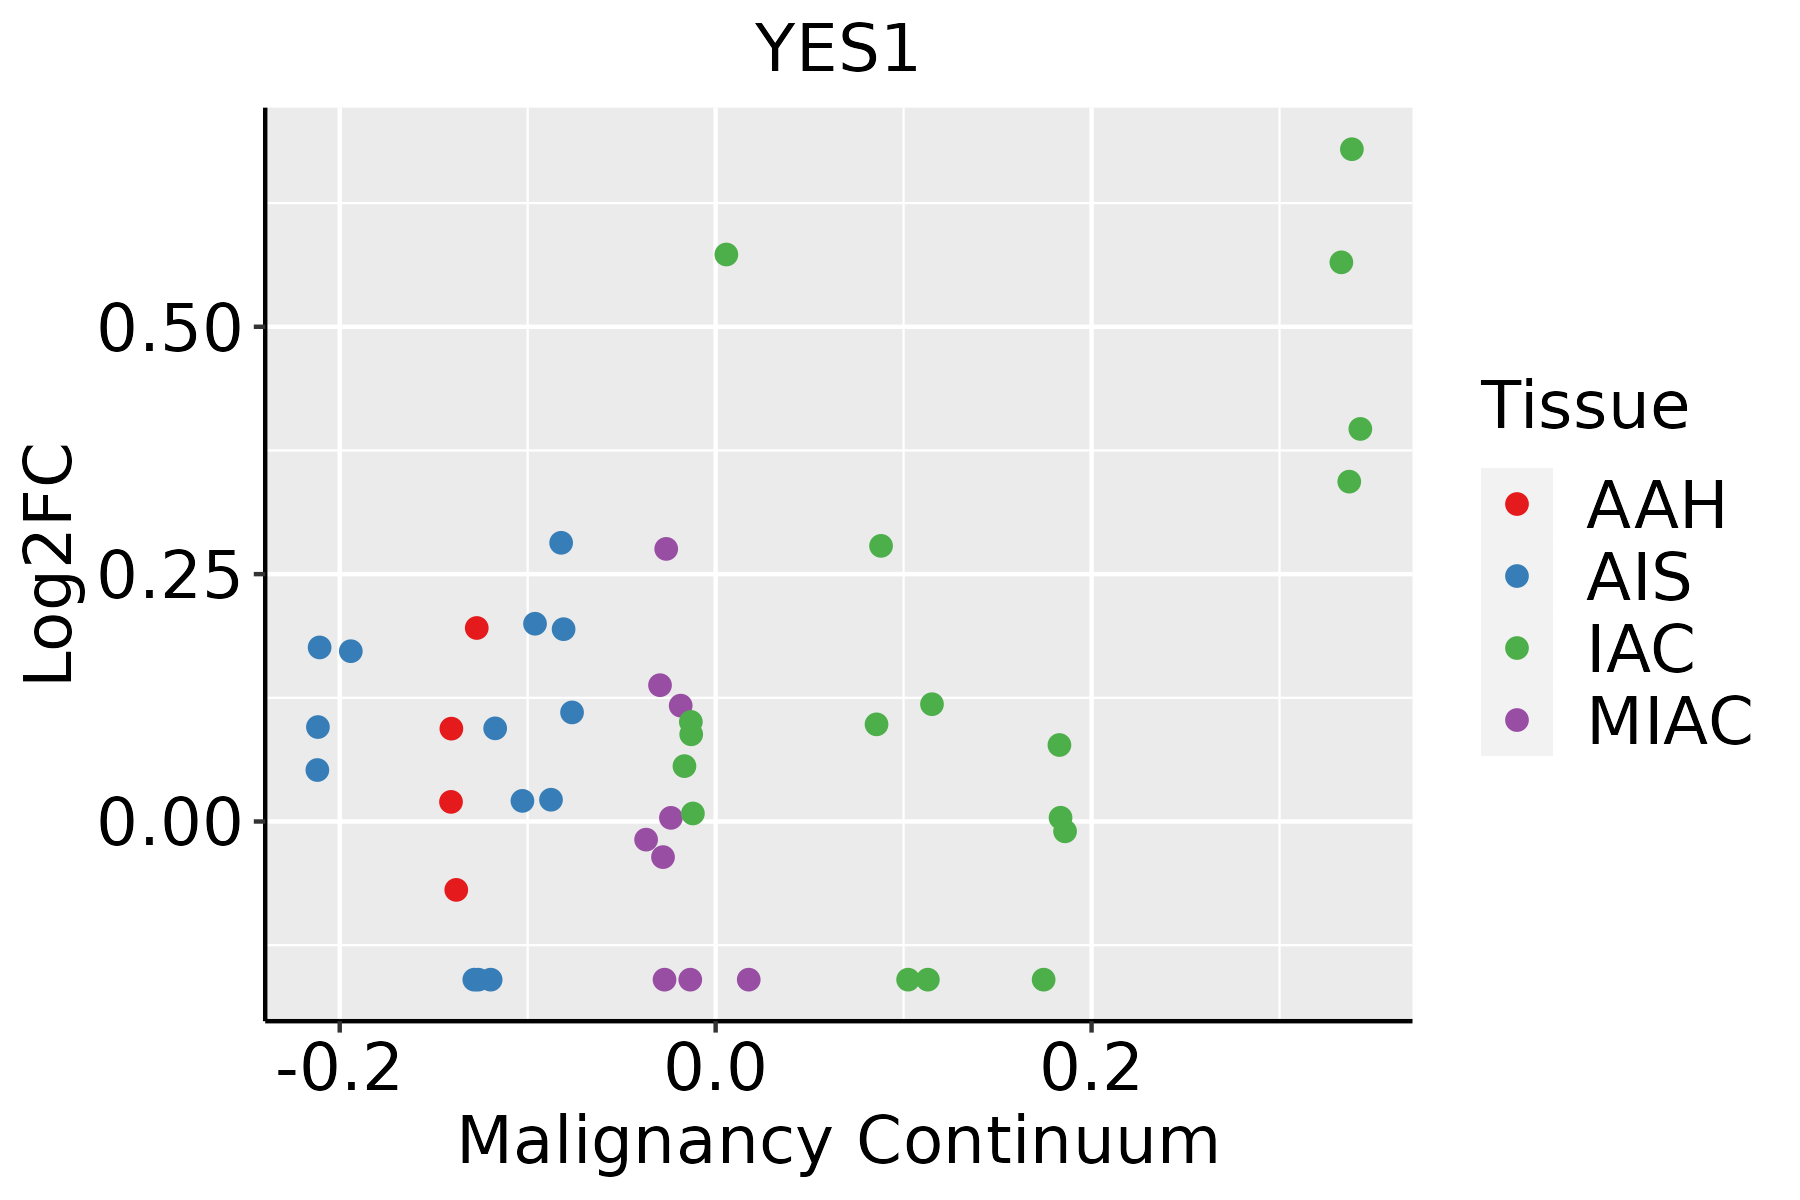 | AAH: Atypical adenomatous hyperplasia |
| AIS: Adenocarcinoma in situ | ||
| IAC: Invasive lung adenocarcinoma | ||
| MIA: Minimally invasive adenocarcinoma | ||
| Oral Cavity | 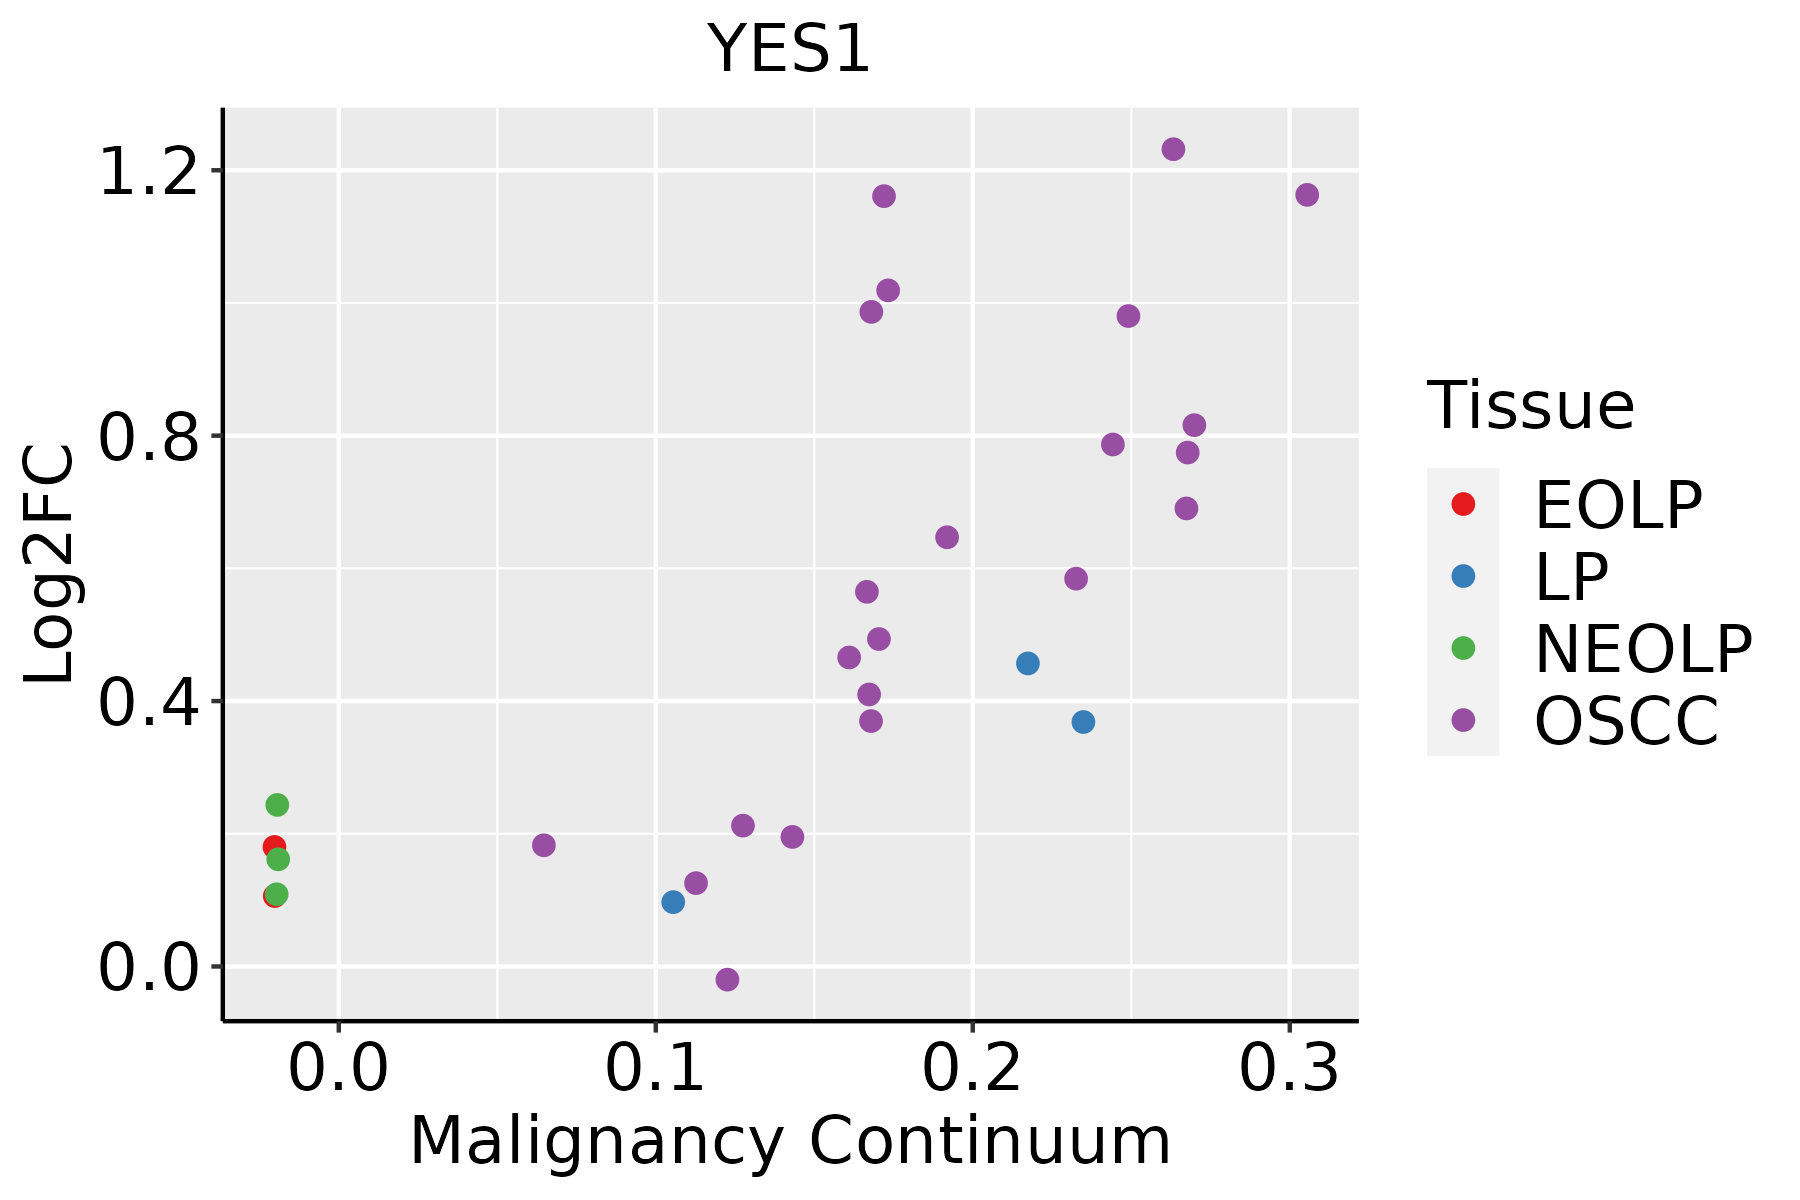 | EOLP: Erosive Oral lichen planus |
| LP: leukoplakia | ||
| NEOLP: Non-erosive oral lichen planus | ||
| OSCC: Oral squamous cell carcinoma | ||
| Prostate | 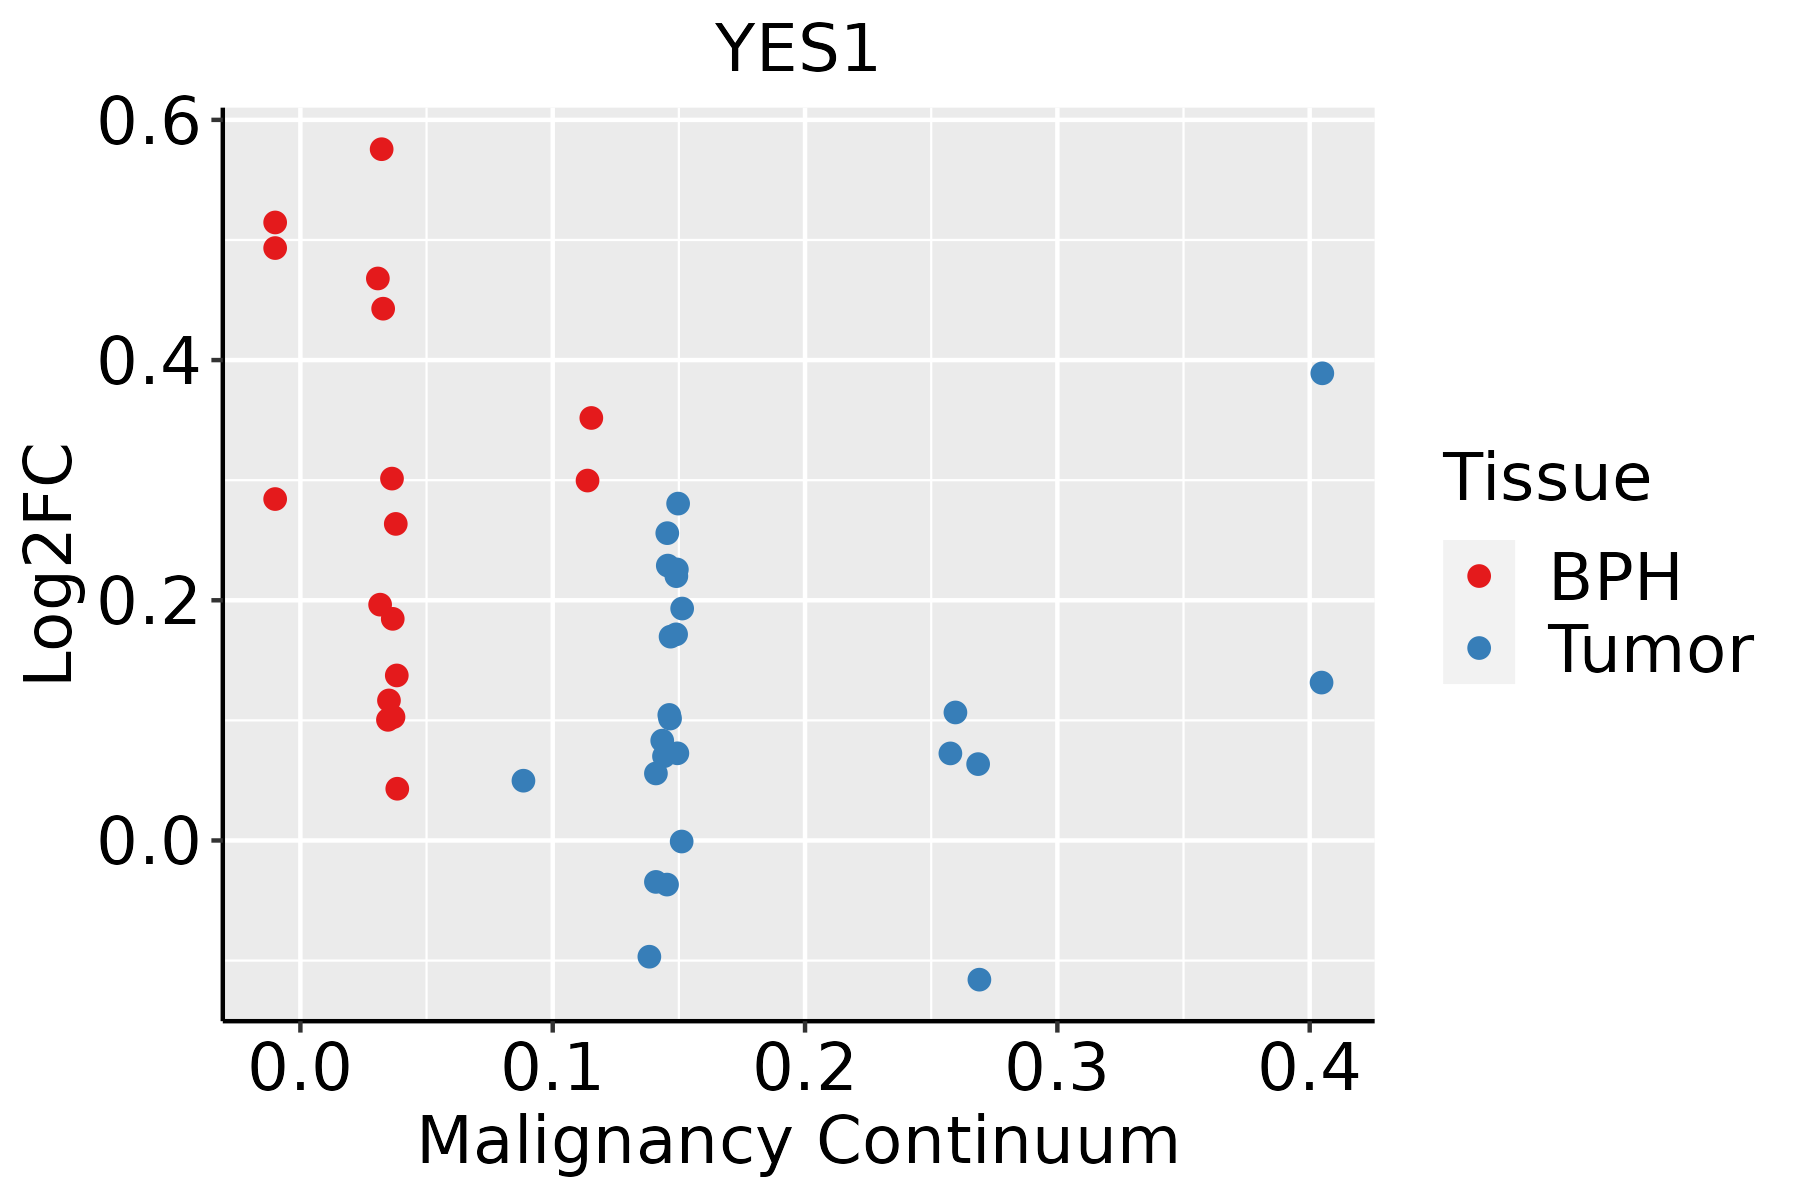 | BPH: Benign Prostatic Hyperplasia |
| Skin |  | AK: Actinic keratosis |
| cSCC: Cutaneous squamous cell carcinoma | ||
| SCCIS:squamous cell carcinoma in situ | ||
| Thyroid | 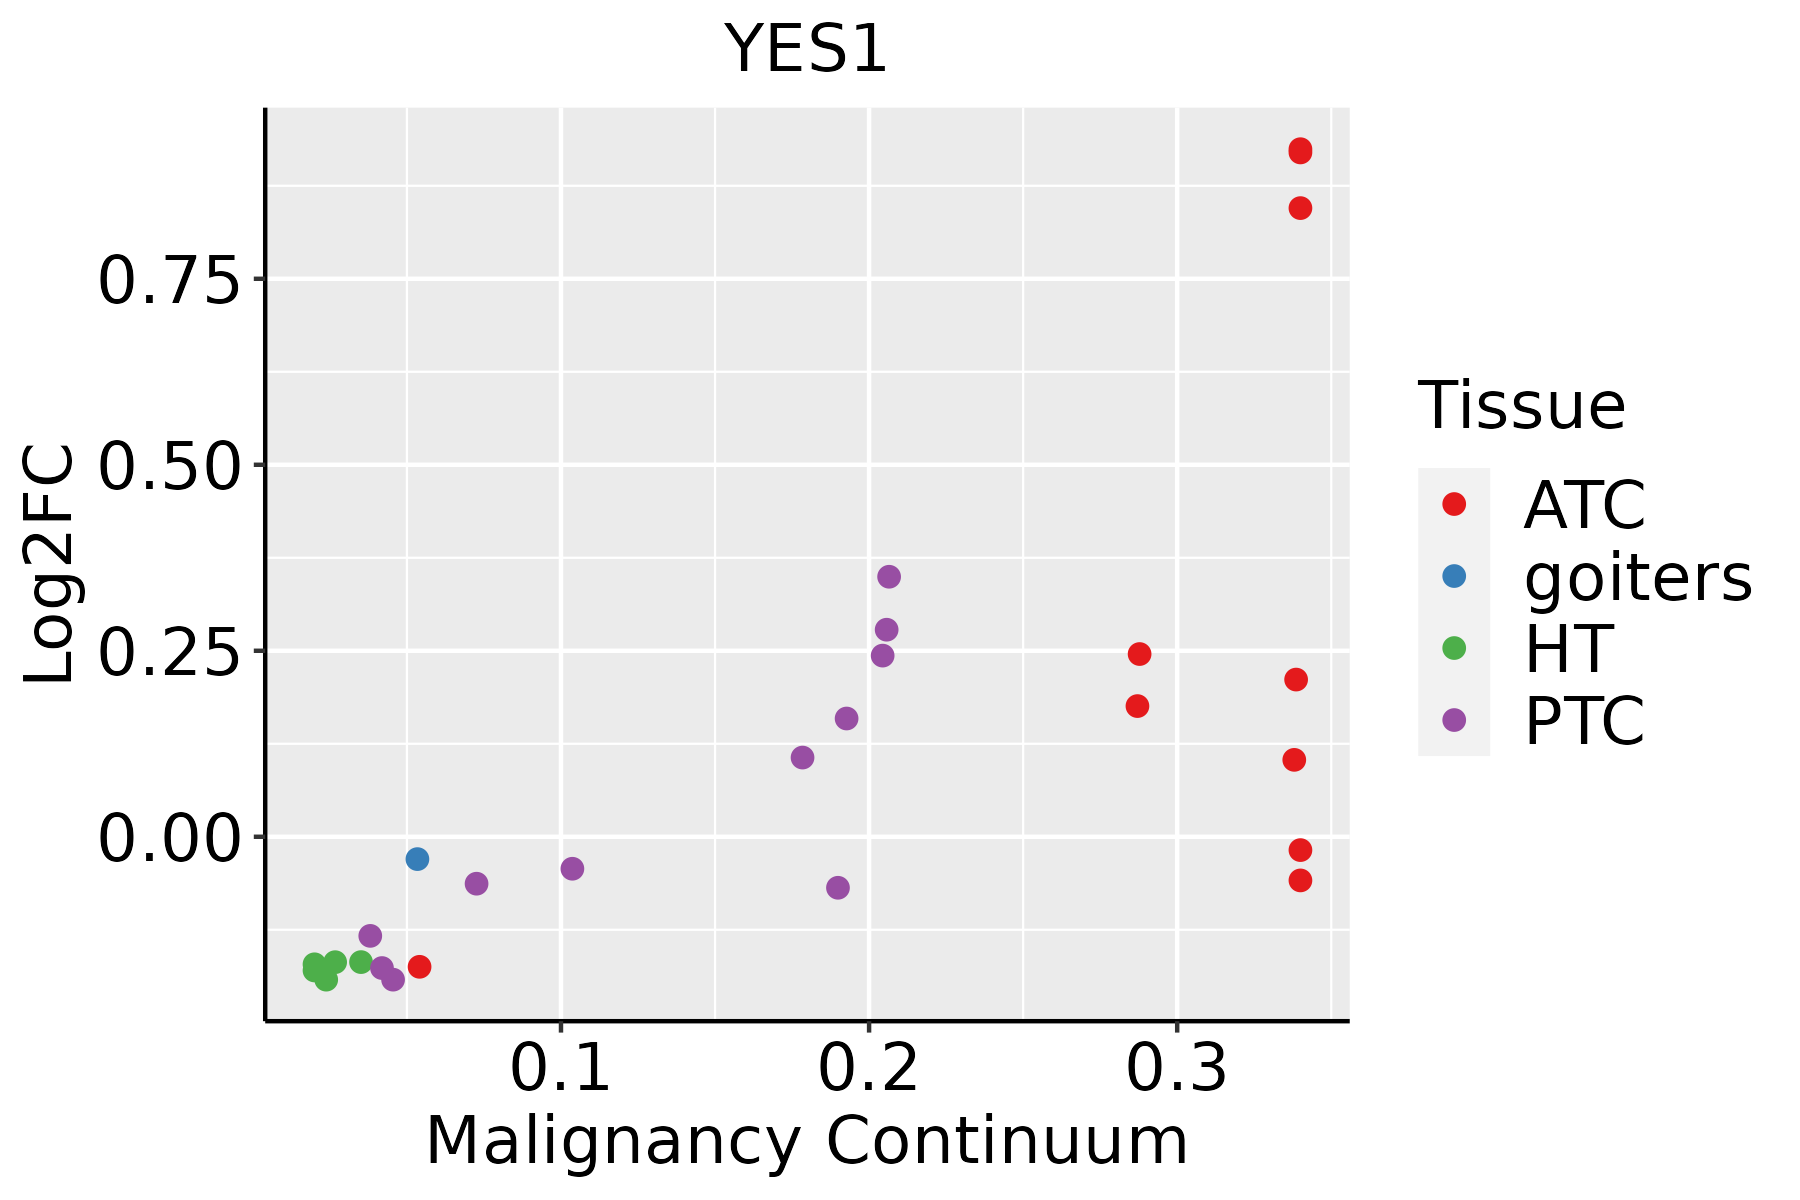 | ATC: Anaplastic thyroid cancer |
| HT: Hashimoto's thyroiditis | ||
| PTC: Papillary thyroid cancer |
| ∗log2FC in expression of this searched gene in stem-like cells from each diseased tissue sample relative to stem-like cells in normal samples in each tissue plotted against the malignancy continuum. Samples are colored based on if they are from different disease stage. |
Top |
Malignant transformation related pathway analysis |
| Find out the enriched GO biological processes and KEGG pathways involved in transition from healthy to precancer to cancer |
| Tissue | Disease Stage | Enriched GO biological Processes |
| Colorectum | AD |  |
| Colorectum | SER |  |
| Colorectum | MSS |  |
| Colorectum | MSI-H |  |
| Colorectum | FAP |  |
| ∗Top 15 enriched GO BP terms are showed in the bar plot of each disease state in each tissue. Each row represents a significant GO biological process which is colored according to the -log10(p.adjust). |
| Page: 1 2 3 4 5 6 7 8 9 |
| GO ID | Tissue | Disease Stage | Description | Gene Ratio | Bg Ratio | pvalue | p.adjust | Count |
| GO:00380963 | Oral cavity | OSCC | Fc-gamma receptor signaling pathway involved in phagocytosis | 18/7305 | 27/18723 | 3.34e-03 | 1.42e-02 | 18 |
| GO:00024312 | Oral cavity | OSCC | Fc receptor mediated stimulatory signaling pathway | 21/7305 | 33/18723 | 3.63e-03 | 1.51e-02 | 21 |
| GO:005087010 | Oral cavity | OSCC | positive regulation of T cell activation | 104/7305 | 216/18723 | 3.76e-03 | 1.55e-02 | 104 |
| GO:00380935 | Oral cavity | OSCC | Fc receptor signaling pathway | 29/7305 | 50/18723 | 5.01e-03 | 1.96e-02 | 29 |
| GO:00480132 | Oral cavity | OSCC | ephrin receptor signaling pathway | 29/7305 | 51/18723 | 7.33e-03 | 2.71e-02 | 29 |
| GO:0032526 | Oral cavity | OSCC | response to retinoic acid | 54/7305 | 107/18723 | 1.04e-02 | 3.54e-02 | 54 |
| GO:004578518 | Prostate | BPH | positive regulation of cell adhesion | 120/3107 | 437/18723 | 5.22e-09 | 1.90e-07 | 120 |
| GO:00715597 | Prostate | BPH | response to transforming growth factor beta | 76/3107 | 256/18723 | 1.14e-07 | 2.73e-06 | 76 |
| GO:00715607 | Prostate | BPH | cellular response to transforming growth factor beta stimulus | 72/3107 | 250/18723 | 8.71e-07 | 1.61e-05 | 72 |
| GO:002240716 | Prostate | BPH | regulation of cell-cell adhesion | 109/3107 | 448/18723 | 1.43e-05 | 1.85e-04 | 109 |
| GO:004211010 | Prostate | BPH | T cell activation | 111/3107 | 487/18723 | 2.11e-04 | 1.72e-03 | 111 |
| GO:00026839 | Prostate | BPH | negative regulation of immune system process | 100/3107 | 434/18723 | 2.83e-04 | 2.20e-03 | 100 |
| GO:000715910 | Prostate | BPH | leukocyte cell-cell adhesion | 86/3107 | 371/18723 | 5.95e-04 | 4.11e-03 | 86 |
| GO:190303710 | Prostate | BPH | regulation of leukocyte cell-cell adhesion | 78/3107 | 336/18723 | 9.95e-04 | 6.25e-03 | 78 |
| GO:005086310 | Prostate | BPH | regulation of T cell activation | 76/3107 | 329/18723 | 1.32e-03 | 7.95e-03 | 76 |
| GO:002240915 | Prostate | BPH | positive regulation of cell-cell adhesion | 67/3107 | 284/18723 | 1.41e-03 | 8.40e-03 | 67 |
| GO:00509009 | Prostate | BPH | leukocyte migration | 80/3107 | 369/18723 | 6.09e-03 | 2.80e-02 | 80 |
| GO:00467778 | Prostate | BPH | protein autophosphorylation | 52/3107 | 227/18723 | 8.26e-03 | 3.59e-02 | 52 |
| GO:19030399 | Prostate | BPH | positive regulation of leukocyte cell-cell adhesion | 54/3107 | 239/18723 | 9.57e-03 | 4.05e-02 | 54 |
| GO:004578519 | Prostate | Tumor | positive regulation of cell adhesion | 125/3246 | 437/18723 | 2.56e-09 | 1.08e-07 | 125 |
| Page: 1 2 3 4 5 6 7 8 9 |
| Pathway ID | Tissue | Disease Stage | Description | Gene Ratio | Bg Ratio | pvalue | p.adjust | qvalue | Count |
| hsa0452025 | Endometrium | AEH | Adherens junction | 36/1197 | 93/8465 | 3.49e-09 | 5.98e-08 | 4.37e-08 | 36 |
| hsa04520111 | Endometrium | AEH | Adherens junction | 36/1197 | 93/8465 | 3.49e-09 | 5.98e-08 | 4.37e-08 | 36 |
| hsa0452026 | Endometrium | EEC | Adherens junction | 36/1237 | 93/8465 | 8.57e-09 | 1.48e-07 | 1.11e-07 | 36 |
| hsa0452035 | Endometrium | EEC | Adherens junction | 36/1237 | 93/8465 | 8.57e-09 | 1.48e-07 | 1.11e-07 | 36 |
| hsa0452030 | Esophagus | ESCC | Adherens junction | 69/4205 | 93/8465 | 1.08e-06 | 6.83e-06 | 3.50e-06 | 69 |
| hsa04520114 | Esophagus | ESCC | Adherens junction | 69/4205 | 93/8465 | 1.08e-06 | 6.83e-06 | 3.50e-06 | 69 |
| hsa0452022 | Liver | Cirrhotic | Adherens junction | 52/2530 | 93/8465 | 1.36e-07 | 1.97e-06 | 1.21e-06 | 52 |
| hsa0452032 | Liver | Cirrhotic | Adherens junction | 52/2530 | 93/8465 | 1.36e-07 | 1.97e-06 | 1.21e-06 | 52 |
| hsa0452042 | Liver | HCC | Adherens junction | 68/4020 | 93/8465 | 3.99e-07 | 4.46e-06 | 2.48e-06 | 68 |
| hsa0452052 | Liver | HCC | Adherens junction | 68/4020 | 93/8465 | 3.99e-07 | 4.46e-06 | 2.48e-06 | 68 |
| hsa0452016 | Lung | IAC | Adherens junction | 37/1053 | 93/8465 | 1.99e-11 | 2.16e-09 | 1.43e-09 | 37 |
| hsa0452017 | Lung | IAC | Adherens junction | 37/1053 | 93/8465 | 1.99e-11 | 2.16e-09 | 1.43e-09 | 37 |
| hsa0452029 | Oral cavity | OSCC | Adherens junction | 62/3704 | 93/8465 | 6.34e-06 | 3.12e-05 | 1.59e-05 | 62 |
| hsa04520113 | Oral cavity | OSCC | Adherens junction | 62/3704 | 93/8465 | 6.34e-06 | 3.12e-05 | 1.59e-05 | 62 |
| hsa0452027 | Prostate | BPH | Adherens junction | 55/1718 | 93/8465 | 1.90e-16 | 4.18e-15 | 2.59e-15 | 55 |
| hsa04520112 | Prostate | BPH | Adherens junction | 55/1718 | 93/8465 | 1.90e-16 | 4.18e-15 | 2.59e-15 | 55 |
| hsa0452028 | Prostate | Tumor | Adherens junction | 53/1791 | 93/8465 | 3.68e-14 | 8.11e-13 | 5.03e-13 | 53 |
| hsa0452036 | Prostate | Tumor | Adherens junction | 53/1791 | 93/8465 | 3.68e-14 | 8.11e-13 | 5.03e-13 | 53 |
| Page: 1 |
Top |
Cell-cell communication analysis |
| Identification of potential cell-cell interactions between two cell types and their ligand-receptor pairs for different disease states |
| Ligand | Receptor | LRpair | Pathway | Tissue | Disease Stage |
| Page: 1 |
Top |
Single-cell gene regulatory network inference analysis |
| Find out the significant the regulons (TFs) and the target genes of each regulon across cell types for different disease states |
| TF | Cell Type | Tissue | Disease Stage | Target Gene | RSS | Regulon Activity |
| ∗The dot plots of a searched regulon are shown for all cell subpopulations in each disease state of each tissue based on the regulon specific score inferred using pySCENIC and by calculating the average expression. |
| Page: 1 |
Top |
Somatic mutation of malignant transformation related genes |
| Annotation of somatic variants for genes involved in malignant transformation |
| Hugo Symbol | Variant Class | Variant Classification | dbSNP RS | HGVSc | HGVSp | HGVSp Short | SWISSPROT | BIOTYPE | SIFT | PolyPhen | Tumor Sample Barcode | Tissue | Histology | Sex | Age | Stage | Therapy Types | Drugs | Outcome |
| YES1 | SNV | Missense_Mutation | rs763332220 | c.137N>T | p.Ser46Leu | p.S46L | P07947 | protein_coding | tolerated(0.07) | benign(0.027) | TCGA-A2-A04W-01 | Breast | breast invasive carcinoma | Female | <65 | I/II | Chemotherapy | cytoxan | SD |
| YES1 | SNV | Missense_Mutation | c.760G>C | p.Val254Leu | p.V254L | P07947 | protein_coding | deleterious(0.04) | benign(0.02) | TCGA-BH-A0DG-01 | Breast | breast invasive carcinoma | Female | <65 | I/II | Chemotherapy | taxotere | CR | |
| YES1 | insertion | In_Frame_Ins | novel | c.116_117insAGG | p.Val39_Ser40insGly | p.V39_S40insG | P07947 | protein_coding | TCGA-A8-A08H-01 | Breast | breast invasive carcinoma | Female | >=65 | I/II | Unknown | Unknown | SD | ||
| YES1 | insertion | Nonsense_Mutation | novel | c.115_116insGCCATTCTAATAACTGTAAAGATAAACTCTAA | p.Val39GlyfsTer11 | p.V39Gfs*11 | P07947 | protein_coding | TCGA-A8-A08H-01 | Breast | breast invasive carcinoma | Female | >=65 | I/II | Unknown | Unknown | SD | ||
| YES1 | insertion | Nonsense_Mutation | novel | c.57_58insGAGAGAAAATGAGCTCTTTTGTAAAGGGTCCCGTATCAGGATGCTT | p.Asn20GlufsTer4 | p.N20Efs*4 | P07947 | protein_coding | TCGA-BH-A0B4-01 | Breast | breast invasive carcinoma | Male | >=65 | III/IV | Hormone Therapy | tamoxiphen | SD | ||
| YES1 | deletion | Frame_Shift_Del | novel | c.846delN | p.Lys282AsnfsTer2 | p.K282Nfs*2 | P07947 | protein_coding | TCGA-EW-A2FV-01 | Breast | breast invasive carcinoma | Female | <65 | III/IV | Chemotherapy | docetaxel | SD | ||
| YES1 | SNV | Missense_Mutation | c.388N>A | p.Glu130Lys | p.E130K | P07947 | protein_coding | tolerated(0.35) | benign(0.062) | TCGA-DG-A2KM-01 | Cervix | cervical & endocervical cancer | Female | <65 | I/II | Chemotherapy | cisplatin | SD | |
| YES1 | SNV | Missense_Mutation | c.1034N>C | p.Tyr345Ser | p.Y345S | P07947 | protein_coding | deleterious(0) | probably_damaging(0.98) | TCGA-Q1-A5R1-01 | Cervix | cervical & endocervical cancer | Female | <65 | I/II | Unknown | Unknown | SD | |
| YES1 | SNV | Missense_Mutation | rs202083013 | c.403G>A | p.Ala135Thr | p.A135T | P07947 | protein_coding | tolerated(1) | benign(0) | TCGA-AA-3663-01 | Colorectum | colon adenocarcinoma | Male | <65 | I/II | Unknown | Unknown | SD |
| YES1 | SNV | Missense_Mutation | c.1153N>A | p.Ala385Thr | p.A385T | P07947 | protein_coding | deleterious(0.02) | possibly_damaging(0.748) | TCGA-AA-3715-01 | Colorectum | colon adenocarcinoma | Male | >=65 | I/II | Unknown | Unknown | PD |
| Page: 1 2 3 4 5 6 7 |
Top |
Related drugs of malignant transformation related genes |
| Identification of chemicals and drugs interact with genes involved in malignant transfromation |
| (DGIdb 4.0) |
| Entrez ID | Symbol | Category | Interaction Types | Drug Claim Name | Drug Name | PMIDs |
| 7525 | YES1 | DRUGGABLE GENOME, KINASE, TYROSINE KINASE, ENZYME, CLINICALLY ACTIONABLE | GSK-625137A | GSK-625137A | ||
| 7525 | YES1 | DRUGGABLE GENOME, KINASE, TYROSINE KINASE, ENZYME, CLINICALLY ACTIONABLE | GW831090X | GW831090X | ||
| 7525 | YES1 | DRUGGABLE GENOME, KINASE, TYROSINE KINASE, ENZYME, CLINICALLY ACTIONABLE | SB-221466 | CHEMBL95502 | ||
| 7525 | YES1 | DRUGGABLE GENOME, KINASE, TYROSINE KINASE, ENZYME, CLINICALLY ACTIONABLE | GW827102X | GW827102X | ||
| 7525 | YES1 | DRUGGABLE GENOME, KINASE, TYROSINE KINASE, ENZYME, CLINICALLY ACTIONABLE | SB-203580 | SB-203580 | ||
| 7525 | YES1 | DRUGGABLE GENOME, KINASE, TYROSINE KINASE, ENZYME, CLINICALLY ACTIONABLE | GW631581B | GW631581B | ||
| 7525 | YES1 | DRUGGABLE GENOME, KINASE, TYROSINE KINASE, ENZYME, CLINICALLY ACTIONABLE | CYC-116 | CYC-116 | ||
| 7525 | YES1 | DRUGGABLE GENOME, KINASE, TYROSINE KINASE, ENZYME, CLINICALLY ACTIONABLE | GW837331X | GW837331X | ||
| 7525 | YES1 | DRUGGABLE GENOME, KINASE, TYROSINE KINASE, ENZYME, CLINICALLY ACTIONABLE | SK&F-86002 | CHEMBL313417 | ||
| 7525 | YES1 | DRUGGABLE GENOME, KINASE, TYROSINE KINASE, ENZYME, CLINICALLY ACTIONABLE | REGORAFENIB | REGORAFENIB |
| Page: 1 2 3 4 5 6 7 8 9 10 11 12 13 14 15 16 17 18 19 20 21 22 |

Copyright 2023-Present -The University of Texas Health Science Center at Houston |