
|
|||||
|
 | |
| |
| |
| |
| |
| |
|
Gene: WNT7A |
Gene summary for WNT7A |
| Gene information | Species | Human | Gene symbol | WNT7A | Gene ID | 7476 |
| Gene name | Wnt family member 7A | |
| Gene Alias | Wnt-7a | |
| Cytomap | 3p25.1 | |
| Gene Type | protein-coding | GO ID | GO:0000003 | UniProtAcc | O00755 |
Top |
Malignant transformation analysis |
| Identification of the aberrant gene expression in precancerous and cancerous lesions by comparing the gene expression of stem-like cells in diseased tissues with normal stem cells |
| Entrez ID | Symbol | Replicates | Species | Organ | Tissue | Adj P-value | Log2FC | Malignancy |
| 7476 | WNT7A | P5T-E | Human | Esophagus | ESCC | 1.78e-03 | 1.00e-01 | 0.1327 |
| 7476 | WNT7A | P11T-E | Human | Esophagus | ESCC | 2.94e-14 | 6.63e-01 | 0.1426 |
| 7476 | WNT7A | P21T-E | Human | Esophagus | ESCC | 5.22e-43 | 9.03e-01 | 0.1617 |
| 7476 | WNT7A | P23T-E | Human | Esophagus | ESCC | 2.89e-02 | 1.19e-01 | 0.108 |
| 7476 | WNT7A | P37T-E | Human | Esophagus | ESCC | 5.50e-16 | 3.52e-01 | 0.1371 |
| 7476 | WNT7A | P40T-E | Human | Esophagus | ESCC | 1.70e-03 | 1.62e-01 | 0.109 |
| 7476 | WNT7A | P52T-E | Human | Esophagus | ESCC | 2.20e-17 | 4.14e-01 | 0.1555 |
| 7476 | WNT7A | P75T-E | Human | Esophagus | ESCC | 1.88e-04 | 1.62e-01 | 0.1125 |
| 7476 | WNT7A | P79T-E | Human | Esophagus | ESCC | 2.02e-06 | 1.77e-01 | 0.1154 |
| 7476 | WNT7A | P83T-E | Human | Esophagus | ESCC | 1.27e-09 | 2.89e-01 | 0.1738 |
| 7476 | WNT7A | P89T-E | Human | Esophagus | ESCC | 6.19e-09 | 5.44e-01 | 0.1752 |
| 7476 | WNT7A | P91T-E | Human | Esophagus | ESCC | 2.29e-12 | 1.12e+00 | 0.1828 |
| 7476 | WNT7A | P107T-E | Human | Esophagus | ESCC | 3.13e-05 | 1.76e-01 | 0.171 |
| 7476 | WNT7A | P130T-E | Human | Esophagus | ESCC | 3.60e-13 | 2.73e-01 | 0.1676 |
| 7476 | WNT7A | C04 | Human | Oral cavity | OSCC | 3.92e-12 | 5.15e-01 | 0.2633 |
| 7476 | WNT7A | C21 | Human | Oral cavity | OSCC | 2.12e-09 | 3.72e-01 | 0.2678 |
| 7476 | WNT7A | C30 | Human | Oral cavity | OSCC | 2.19e-41 | 1.47e+00 | 0.3055 |
| 7476 | WNT7A | C51 | Human | Oral cavity | OSCC | 5.33e-08 | 3.05e-01 | 0.2674 |
| 7476 | WNT7A | LP15 | Human | Oral cavity | LP | 4.58e-04 | 4.14e-01 | 0.2174 |
| 7476 | WNT7A | SYSMH3 | Human | Oral cavity | OSCC | 4.27e-09 | 2.76e-01 | 0.2442 |
| Page: 1 |
| Tissue | Expression Dynamics | Abbreviation |
| Esophagus | 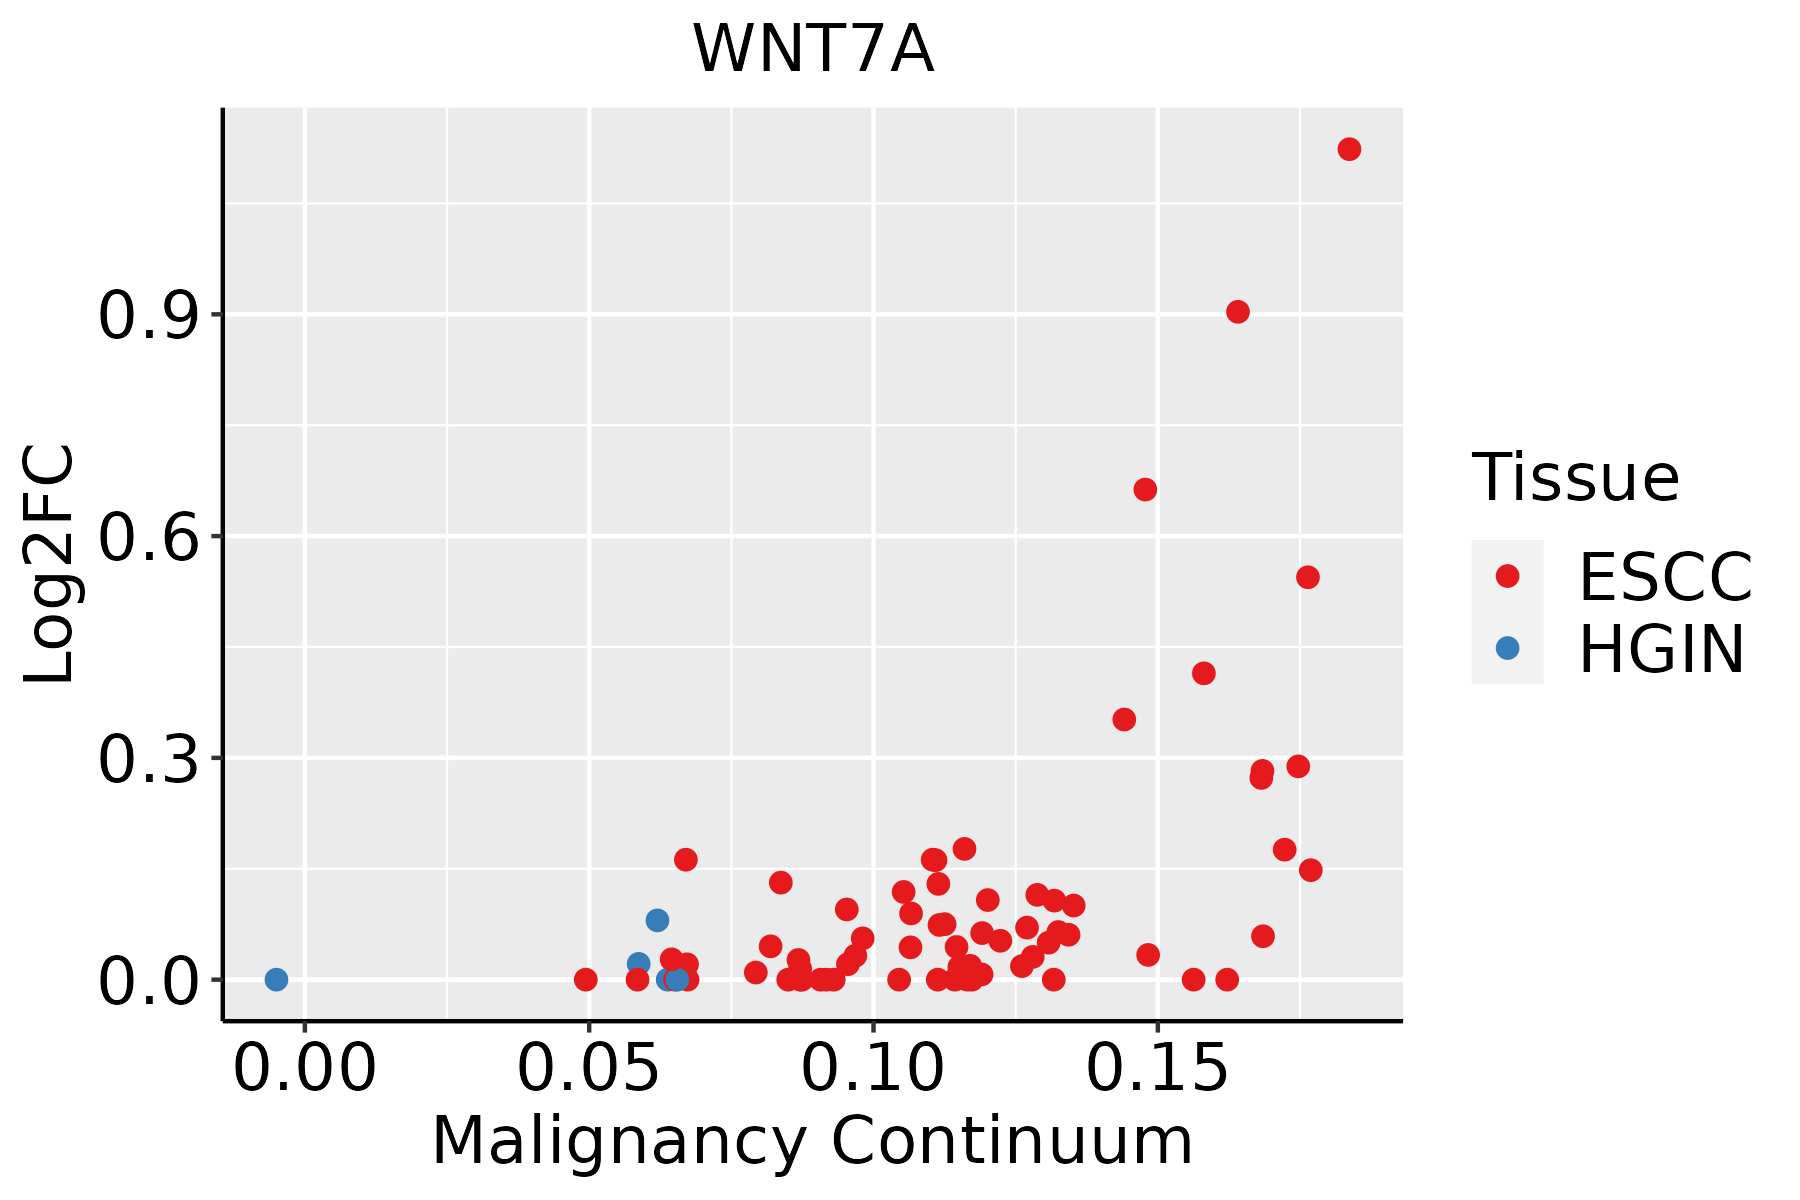 | ESCC: Esophageal squamous cell carcinoma |
| HGIN: High-grade intraepithelial neoplasias | ||
| LGIN: Low-grade intraepithelial neoplasias | ||
| Oral Cavity |  | EOLP: Erosive Oral lichen planus |
| LP: leukoplakia | ||
| NEOLP: Non-erosive oral lichen planus | ||
| OSCC: Oral squamous cell carcinoma |
| ∗log2FC in expression of this searched gene in stem-like cells from each diseased tissue sample relative to stem-like cells in normal samples in each tissue plotted against the malignancy continuum. Samples are colored based on if they are from different disease stage. |
Top |
Malignant transformation related pathway analysis |
| Find out the enriched GO biological processes and KEGG pathways involved in transition from healthy to precancer to cancer |
| Tissue | Disease Stage | Enriched GO biological Processes |
| Colorectum | AD |  |
| Colorectum | SER |  |
| Colorectum | MSS |  |
| Colorectum | MSI-H |  |
| Colorectum | FAP |  |
| ∗Top 15 enriched GO BP terms are showed in the bar plot of each disease state in each tissue. Each row represents a significant GO biological process which is colored according to the -log10(p.adjust). |
| Page: 1 2 3 4 5 6 7 8 9 |
| GO ID | Tissue | Disease Stage | Description | Gene Ratio | Bg Ratio | pvalue | p.adjust | Count |
| GO:001063218 | Oral cavity | OSCC | regulation of epithelial cell migration | 136/7305 | 292/18723 | 4.82e-03 | 1.92e-02 | 136 |
| GO:003432916 | Oral cavity | OSCC | cell junction assembly | 190/7305 | 420/18723 | 4.99e-03 | 1.96e-02 | 190 |
| GO:00171451 | Oral cavity | OSCC | stem cell division | 19/7305 | 30/18723 | 6.03e-03 | 2.28e-02 | 19 |
| GO:00434107 | Oral cavity | OSCC | positive regulation of MAPK cascade | 213/7305 | 480/18723 | 8.71e-03 | 3.16e-02 | 213 |
| GO:001635810 | Oral cavity | OSCC | dendrite development | 113/7305 | 243/18723 | 1.00e-02 | 3.49e-02 | 113 |
| GO:00463301 | Oral cavity | OSCC | positive regulation of JNK cascade | 46/7305 | 89/18723 | 1.01e-02 | 3.50e-02 | 46 |
| GO:006156410 | Oral cavity | OSCC | axon development | 207/7305 | 467/18723 | 1.01e-02 | 3.51e-02 | 207 |
| GO:00609967 | Oral cavity | OSCC | dendritic spine development | 50/7305 | 99/18723 | 1.31e-02 | 4.34e-02 | 50 |
| GO:00488637 | Oral cavity | OSCC | stem cell differentiation | 96/7305 | 206/18723 | 1.55e-02 | 4.99e-02 | 96 |
| GO:003109916 | Oral cavity | LP | regeneration | 76/4623 | 198/18723 | 1.25e-05 | 2.24e-04 | 76 |
| GO:0032535110 | Oral cavity | LP | regulation of cellular component size | 128/4623 | 383/18723 | 6.56e-05 | 8.80e-04 | 128 |
| GO:0042060110 | Oral cavity | LP | wound healing | 139/4623 | 422/18723 | 7.10e-05 | 9.48e-04 | 139 |
| GO:003109817 | Oral cavity | LP | stress-activated protein kinase signaling cascade | 88/4623 | 247/18723 | 7.39e-05 | 9.68e-04 | 88 |
| GO:000716319 | Oral cavity | LP | establishment or maintenance of cell polarity | 79/4623 | 218/18723 | 8.84e-05 | 1.11e-03 | 79 |
| GO:005140317 | Oral cavity | LP | stress-activated MAPK cascade | 84/4623 | 239/18723 | 1.79e-04 | 2.00e-03 | 84 |
| GO:001605515 | Oral cavity | LP | Wnt signaling pathway | 140/4623 | 444/18723 | 5.80e-04 | 5.35e-03 | 140 |
| GO:019873815 | Oral cavity | LP | cell-cell signaling by wnt | 140/4623 | 446/18723 | 7.12e-04 | 6.38e-03 | 140 |
| GO:003235516 | Oral cavity | LP | response to estradiol | 52/4623 | 141/18723 | 8.28e-04 | 7.24e-03 | 52 |
| GO:007030216 | Oral cavity | LP | regulation of stress-activated protein kinase signaling cascade | 68/4623 | 195/18723 | 8.92e-04 | 7.64e-03 | 68 |
| GO:00422461 | Oral cavity | LP | tissue regeneration | 30/4623 | 72/18723 | 1.13e-03 | 9.27e-03 | 30 |
| Page: 1 2 3 4 5 6 7 |
| Pathway ID | Tissue | Disease Stage | Description | Gene Ratio | Bg Ratio | pvalue | p.adjust | qvalue | Count |
| hsa05022210 | Esophagus | ESCC | Pathways of neurodegeneration - multiple diseases | 318/4205 | 476/8465 | 6.10e-15 | 2.04e-13 | 1.05e-13 | 318 |
| hsa05010210 | Esophagus | ESCC | Alzheimer disease | 263/4205 | 384/8465 | 1.80e-14 | 5.47e-13 | 2.80e-13 | 263 |
| hsa0516510 | Esophagus | ESCC | Human papillomavirus infection | 215/4205 | 331/8465 | 7.86e-09 | 7.12e-08 | 3.65e-08 | 215 |
| hsa0520529 | Esophagus | ESCC | Proteoglycans in cancer | 138/4205 | 205/8465 | 1.79e-07 | 1.40e-06 | 7.15e-07 | 138 |
| hsa041505 | Esophagus | ESCC | mTOR signaling pathway | 98/4205 | 156/8465 | 5.81e-04 | 1.95e-03 | 9.97e-04 | 98 |
| hsa0439018 | Esophagus | ESCC | Hippo signaling pathway | 92/4205 | 157/8465 | 1.46e-02 | 3.31e-02 | 1.69e-02 | 92 |
| hsa0502238 | Esophagus | ESCC | Pathways of neurodegeneration - multiple diseases | 318/4205 | 476/8465 | 6.10e-15 | 2.04e-13 | 1.05e-13 | 318 |
| hsa0501038 | Esophagus | ESCC | Alzheimer disease | 263/4205 | 384/8465 | 1.80e-14 | 5.47e-13 | 2.80e-13 | 263 |
| hsa0516515 | Esophagus | ESCC | Human papillomavirus infection | 215/4205 | 331/8465 | 7.86e-09 | 7.12e-08 | 3.65e-08 | 215 |
| hsa0520537 | Esophagus | ESCC | Proteoglycans in cancer | 138/4205 | 205/8465 | 1.79e-07 | 1.40e-06 | 7.15e-07 | 138 |
| hsa0415013 | Esophagus | ESCC | mTOR signaling pathway | 98/4205 | 156/8465 | 5.81e-04 | 1.95e-03 | 9.97e-04 | 98 |
| hsa0439019 | Esophagus | ESCC | Hippo signaling pathway | 92/4205 | 157/8465 | 1.46e-02 | 3.31e-02 | 1.69e-02 | 92 |
| hsa0501028 | Oral cavity | OSCC | Alzheimer disease | 244/3704 | 384/8465 | 1.18e-15 | 3.60e-14 | 1.83e-14 | 244 |
| hsa0502228 | Oral cavity | OSCC | Pathways of neurodegeneration - multiple diseases | 292/3704 | 476/8465 | 1.60e-15 | 4.47e-14 | 2.28e-14 | 292 |
| hsa051659 | Oral cavity | OSCC | Human papillomavirus infection | 200/3704 | 331/8465 | 3.83e-10 | 4.93e-09 | 2.51e-09 | 200 |
| hsa0520526 | Oral cavity | OSCC | Proteoglycans in cancer | 128/3704 | 205/8465 | 4.00e-08 | 3.12e-07 | 1.59e-07 | 128 |
| hsa0522516 | Oral cavity | OSCC | Hepatocellular carcinoma | 97/3704 | 168/8465 | 1.63e-04 | 5.52e-04 | 2.81e-04 | 97 |
| hsa041504 | Oral cavity | OSCC | mTOR signaling pathway | 90/3704 | 156/8465 | 2.87e-04 | 9.15e-04 | 4.66e-04 | 90 |
| hsa0439016 | Oral cavity | OSCC | Hippo signaling pathway | 86/3704 | 157/8465 | 3.30e-03 | 8.24e-03 | 4.20e-03 | 86 |
| hsa05010112 | Oral cavity | OSCC | Alzheimer disease | 244/3704 | 384/8465 | 1.18e-15 | 3.60e-14 | 1.83e-14 | 244 |
| Page: 1 2 |
Top |
Cell-cell communication analysis |
| Identification of potential cell-cell interactions between two cell types and their ligand-receptor pairs for different disease states |
| Ligand | Receptor | LRpair | Pathway | Tissue | Disease Stage |
| Page: 1 |
Top |
Single-cell gene regulatory network inference analysis |
| Find out the significant the regulons (TFs) and the target genes of each regulon across cell types for different disease states |
| TF | Cell Type | Tissue | Disease Stage | Target Gene | RSS | Regulon Activity |
| ∗The dot plots of a searched regulon are shown for all cell subpopulations in each disease state of each tissue based on the regulon specific score inferred using pySCENIC and by calculating the average expression. |
| Page: 1 |
Top |
Somatic mutation of malignant transformation related genes |
| Annotation of somatic variants for genes involved in malignant transformation |
| Hugo Symbol | Variant Class | Variant Classification | dbSNP RS | HGVSc | HGVSp | HGVSp Short | SWISSPROT | BIOTYPE | SIFT | PolyPhen | Tumor Sample Barcode | Tissue | Histology | Sex | Age | Stage | Therapy Types | Drugs | Outcome |
| WNT7A | SNV | Missense_Mutation | c.700N>A | p.Glu234Lys | p.E234K | O00755 | protein_coding | tolerated(0.87) | benign(0.001) | TCGA-A8-A093-01 | Breast | breast invasive carcinoma | Female | <65 | I/II | Hormone Therapy | tamoxiphen | SD | |
| WNT7A | SNV | Missense_Mutation | novel | c.921N>T | p.Met307Ile | p.M307I | O00755 | protein_coding | deleterious(0.01) | possibly_damaging(0.643) | TCGA-A8-A094-01 | Breast | breast invasive carcinoma | Female | >=65 | I/II | Unknown | Unknown | SD |
| WNT7A | SNV | Missense_Mutation | rs373515267 | c.706N>A | p.Val236Ile | p.V236I | O00755 | protein_coding | tolerated(0.11) | benign(0.015) | TCGA-E2-A15E-01 | Breast | breast invasive carcinoma | Female | <65 | I/II | Chemotherapy | doxorubicin | SD |
| WNT7A | SNV | Missense_Mutation | c.922N>A | p.Cys308Ser | p.C308S | O00755 | protein_coding | deleterious(0) | probably_damaging(1) | TCGA-E2-A15R-01 | Breast | breast invasive carcinoma | Female | <65 | I/II | Chemotherapy | cyclophosphamide | SD | |
| WNT7A | SNV | Missense_Mutation | rs761294840 | c.388N>A | p.Asp130Asn | p.D130N | O00755 | protein_coding | tolerated(0.66) | benign(0.005) | TCGA-E9-A1N5-01 | Breast | breast invasive carcinoma | Female | <65 | I/II | Chemotherapy | doxorubicin | SD |
| WNT7A | insertion | Frame_Shift_Ins | novel | c.255_256insCACCTAAAATATAGGAATTTCTGGTTTCTTTTGAAAAGTTG | p.Ala86HisfsTer57 | p.A86Hfs*57 | O00755 | protein_coding | TCGA-A8-A0A4-01 | Breast | breast invasive carcinoma | Female | >=65 | I/II | Hormone Therapy | tamoxiphen | CR | ||
| WNT7A | SNV | Missense_Mutation | c.1025G>A | p.Arg342His | p.R342H | O00755 | protein_coding | deleterious(0.01) | probably_damaging(0.967) | TCGA-2W-A8YY-01 | Cervix | cervical & endocervical cancer | Female | <65 | I/II | Chemotherapy | cisplatin | CR | |
| WNT7A | SNV | Missense_Mutation | c.241C>T | p.Arg81Cys | p.R81C | O00755 | protein_coding | deleterious(0) | probably_damaging(1) | TCGA-AA-3664-01 | Colorectum | colon adenocarcinoma | Female | >=65 | I/II | Unknown | Unknown | SD | |
| WNT7A | SNV | Missense_Mutation | rs774758917 | c.877G>A | p.Ala293Thr | p.A293T | O00755 | protein_coding | tolerated(0.4) | benign(0) | TCGA-AA-A01T-01 | Colorectum | colon adenocarcinoma | Female | <65 | III/IV | Chemotherapy | 5-fluorouracil | CR |
| WNT7A | SNV | Missense_Mutation | novel | c.179N>C | p.Ile60Thr | p.I60T | O00755 | protein_coding | deleterious(0.03) | benign(0.395) | TCGA-AD-5900-01 | Colorectum | colon adenocarcinoma | Male | >=65 | I/II | Unknown | Unknown | SD |
| Page: 1 2 3 4 5 6 |
Top |
Related drugs of malignant transformation related genes |
| Identification of chemicals and drugs interact with genes involved in malignant transfromation |
| (DGIdb 4.0) |
| Entrez ID | Symbol | Category | Interaction Types | Drug Claim Name | Drug Name | PMIDs |
| 7476 | WNT7A | DRUGGABLE GENOME, CELL SURFACE | DES | DIETHYLSTILBESTROL | 9806537 |
| Page: 1 |

Copyright 2023-Present -The University of Texas Health Science Center at Houston |