| Tissue | Expression Dynamics | Abbreviation |
| Cervix | 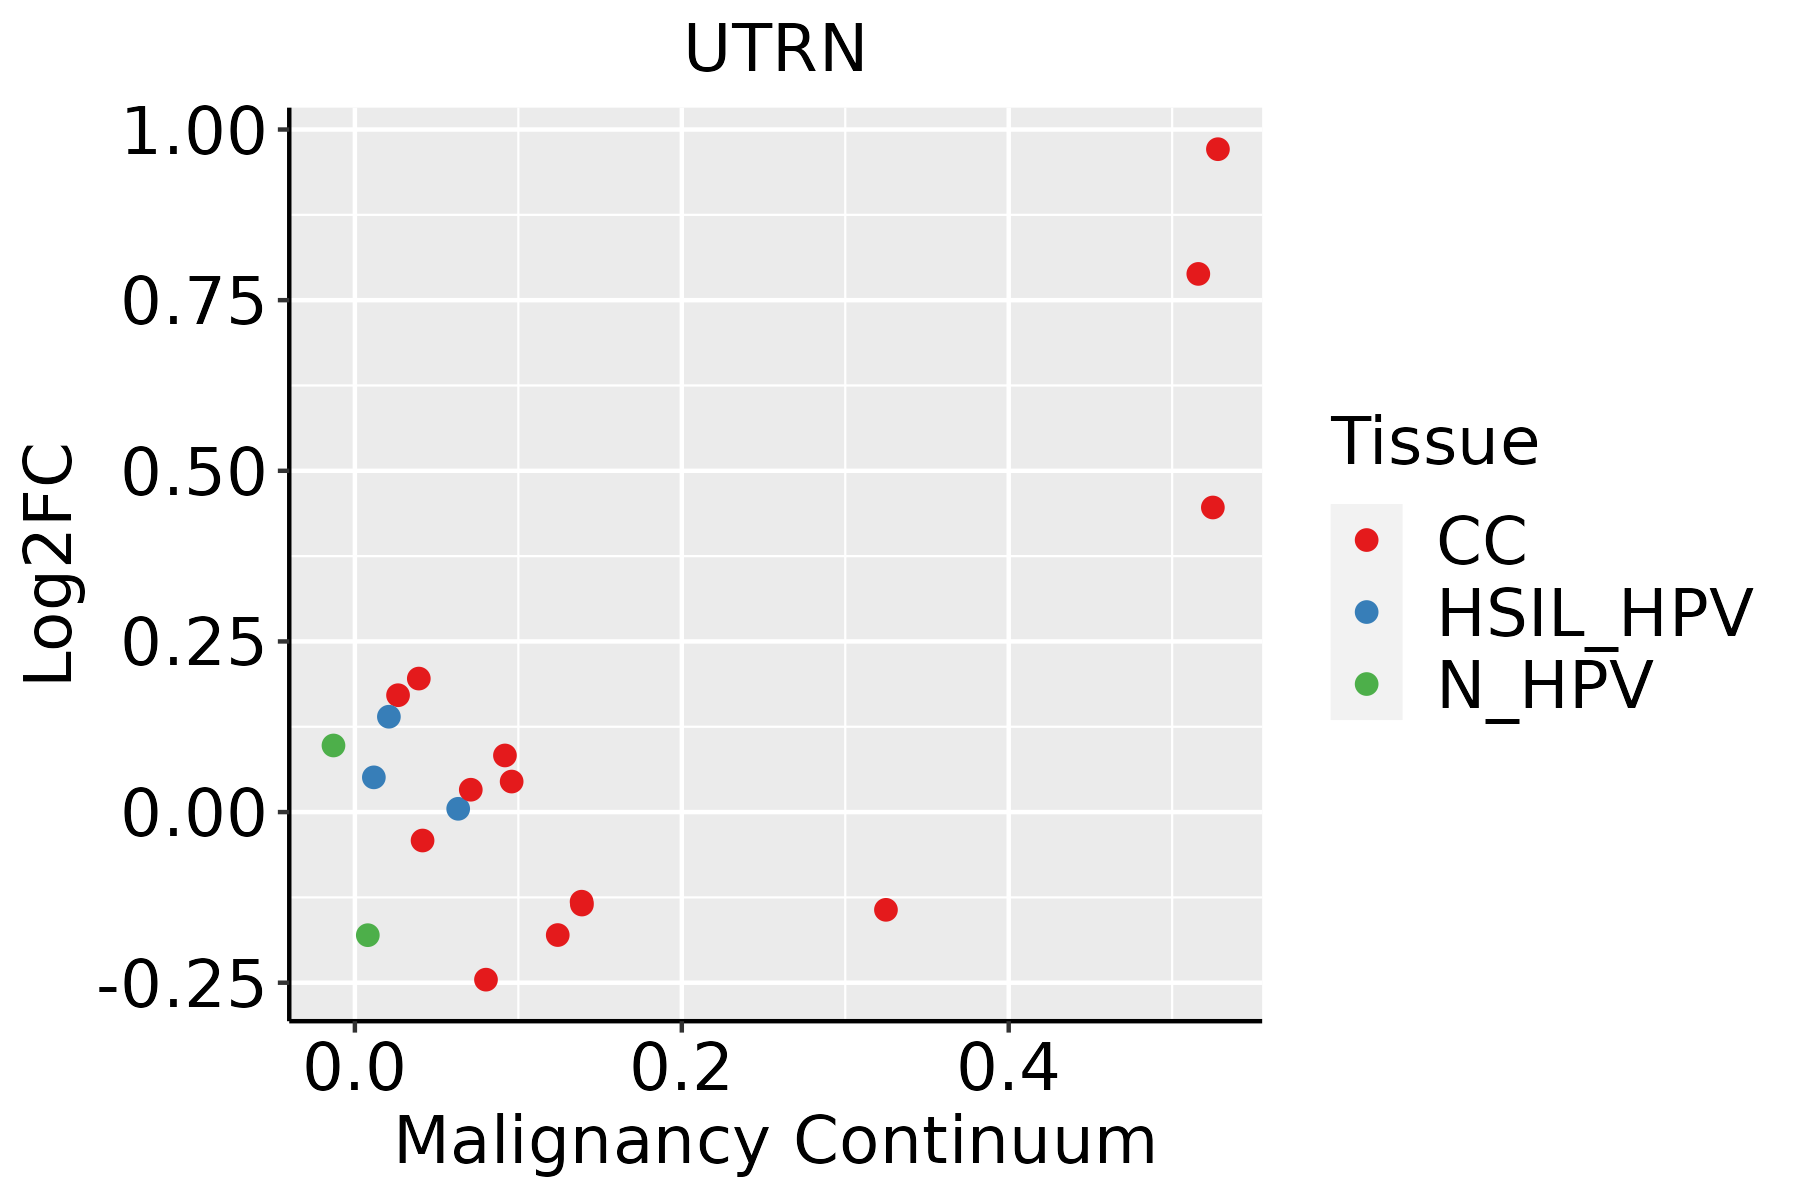 | CC: Cervix cancer |
| HSIL_HPV: HPV-infected high-grade squamous intraepithelial lesions |
| N_HPV: HPV-infected normal cervix |
| Colorectum (GSE201348) |  | FAP: Familial adenomatous polyposis |
| CRC: Colorectal cancer |
| Colorectum (HTA11) |  | AD: Adenomas |
| SER: Sessile serrated lesions |
| MSI-H: Microsatellite-high colorectal cancer |
| MSS: Microsatellite stable colorectal cancer |
| Endometrium | 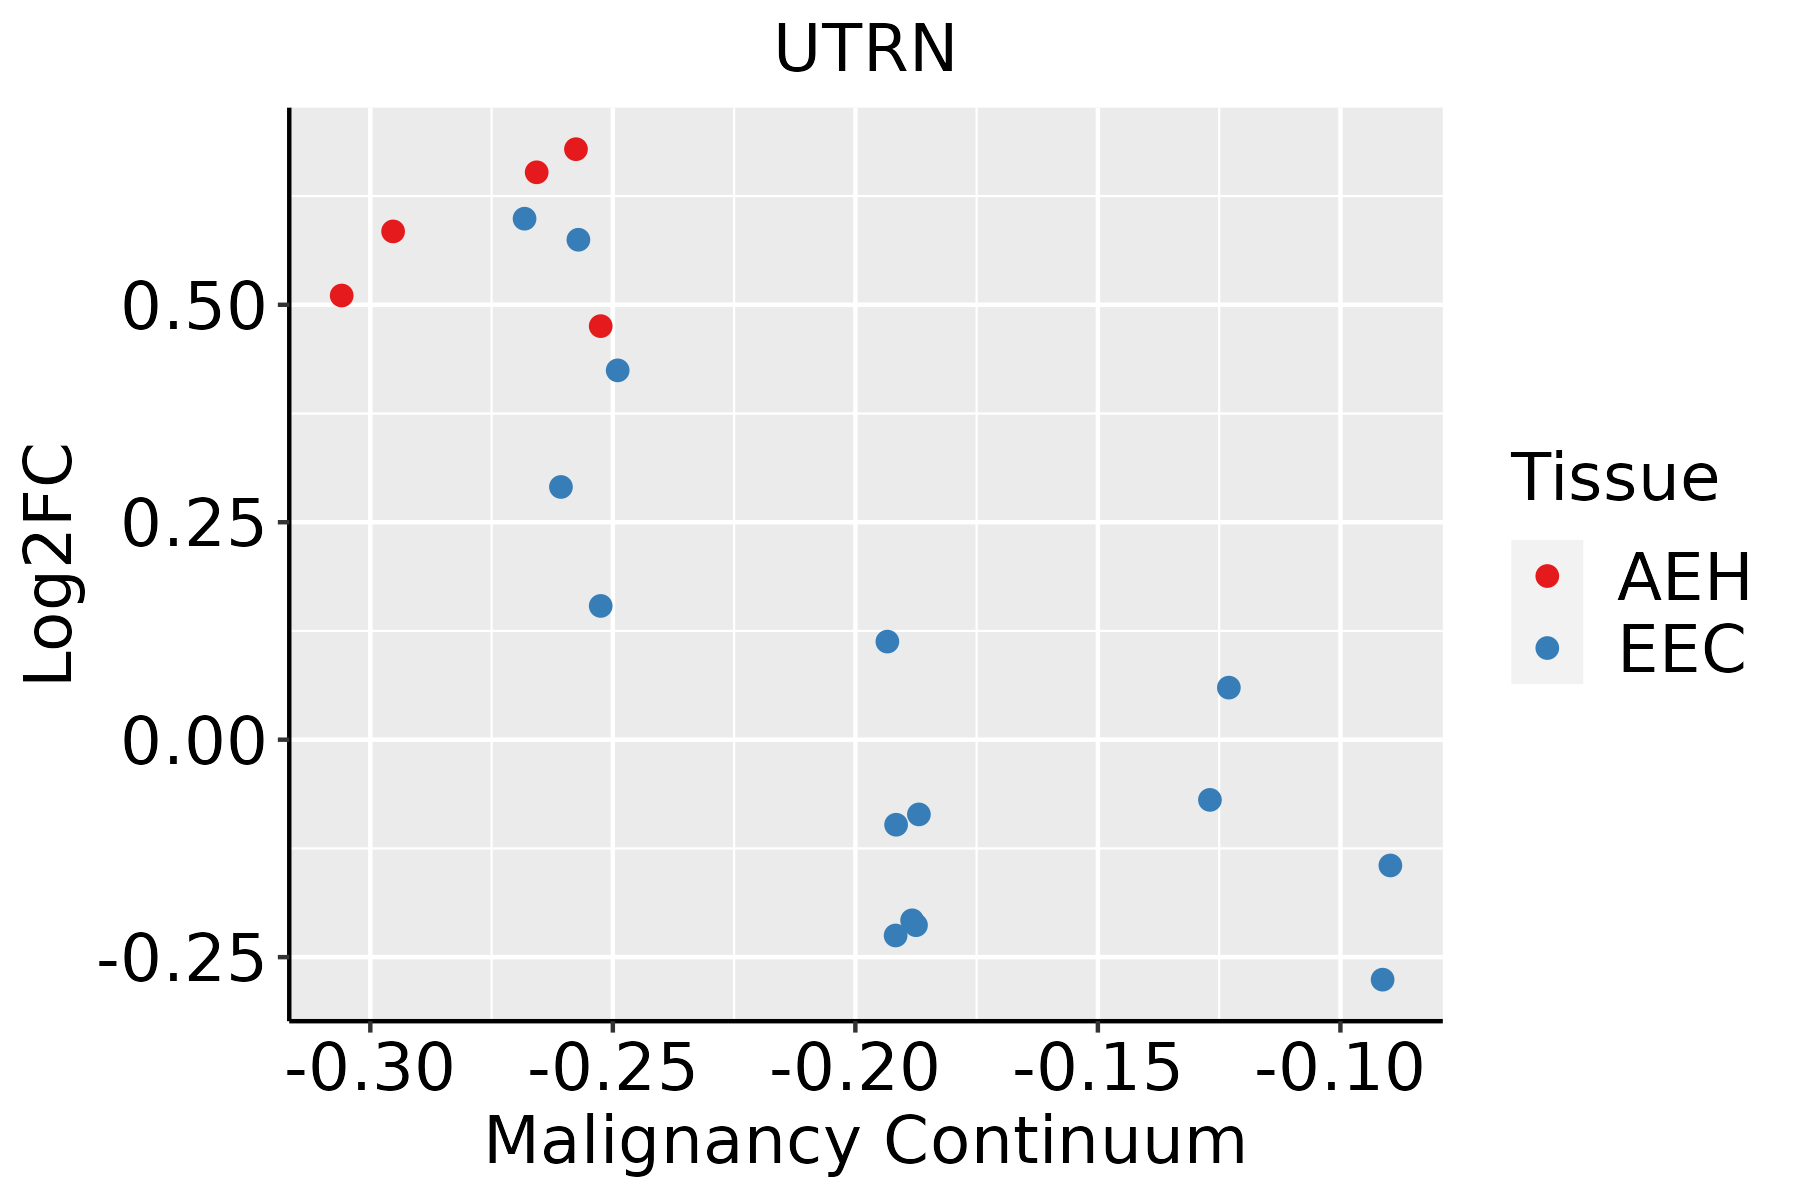 | AEH: Atypical endometrial hyperplasia |
| EEC: Endometrioid Cancer |
| Esophagus |  | ESCC: Esophageal squamous cell carcinoma |
| HGIN: High-grade intraepithelial neoplasias |
| LGIN: Low-grade intraepithelial neoplasias |
| Liver |  | HCC: Hepatocellular carcinoma |
| NAFLD: Non-alcoholic fatty liver disease |
| Lung |  | AAH: Atypical adenomatous hyperplasia |
| AIS: Adenocarcinoma in situ |
| IAC: Invasive lung adenocarcinoma |
| MIA: Minimally invasive adenocarcinoma |
| Oral Cavity | 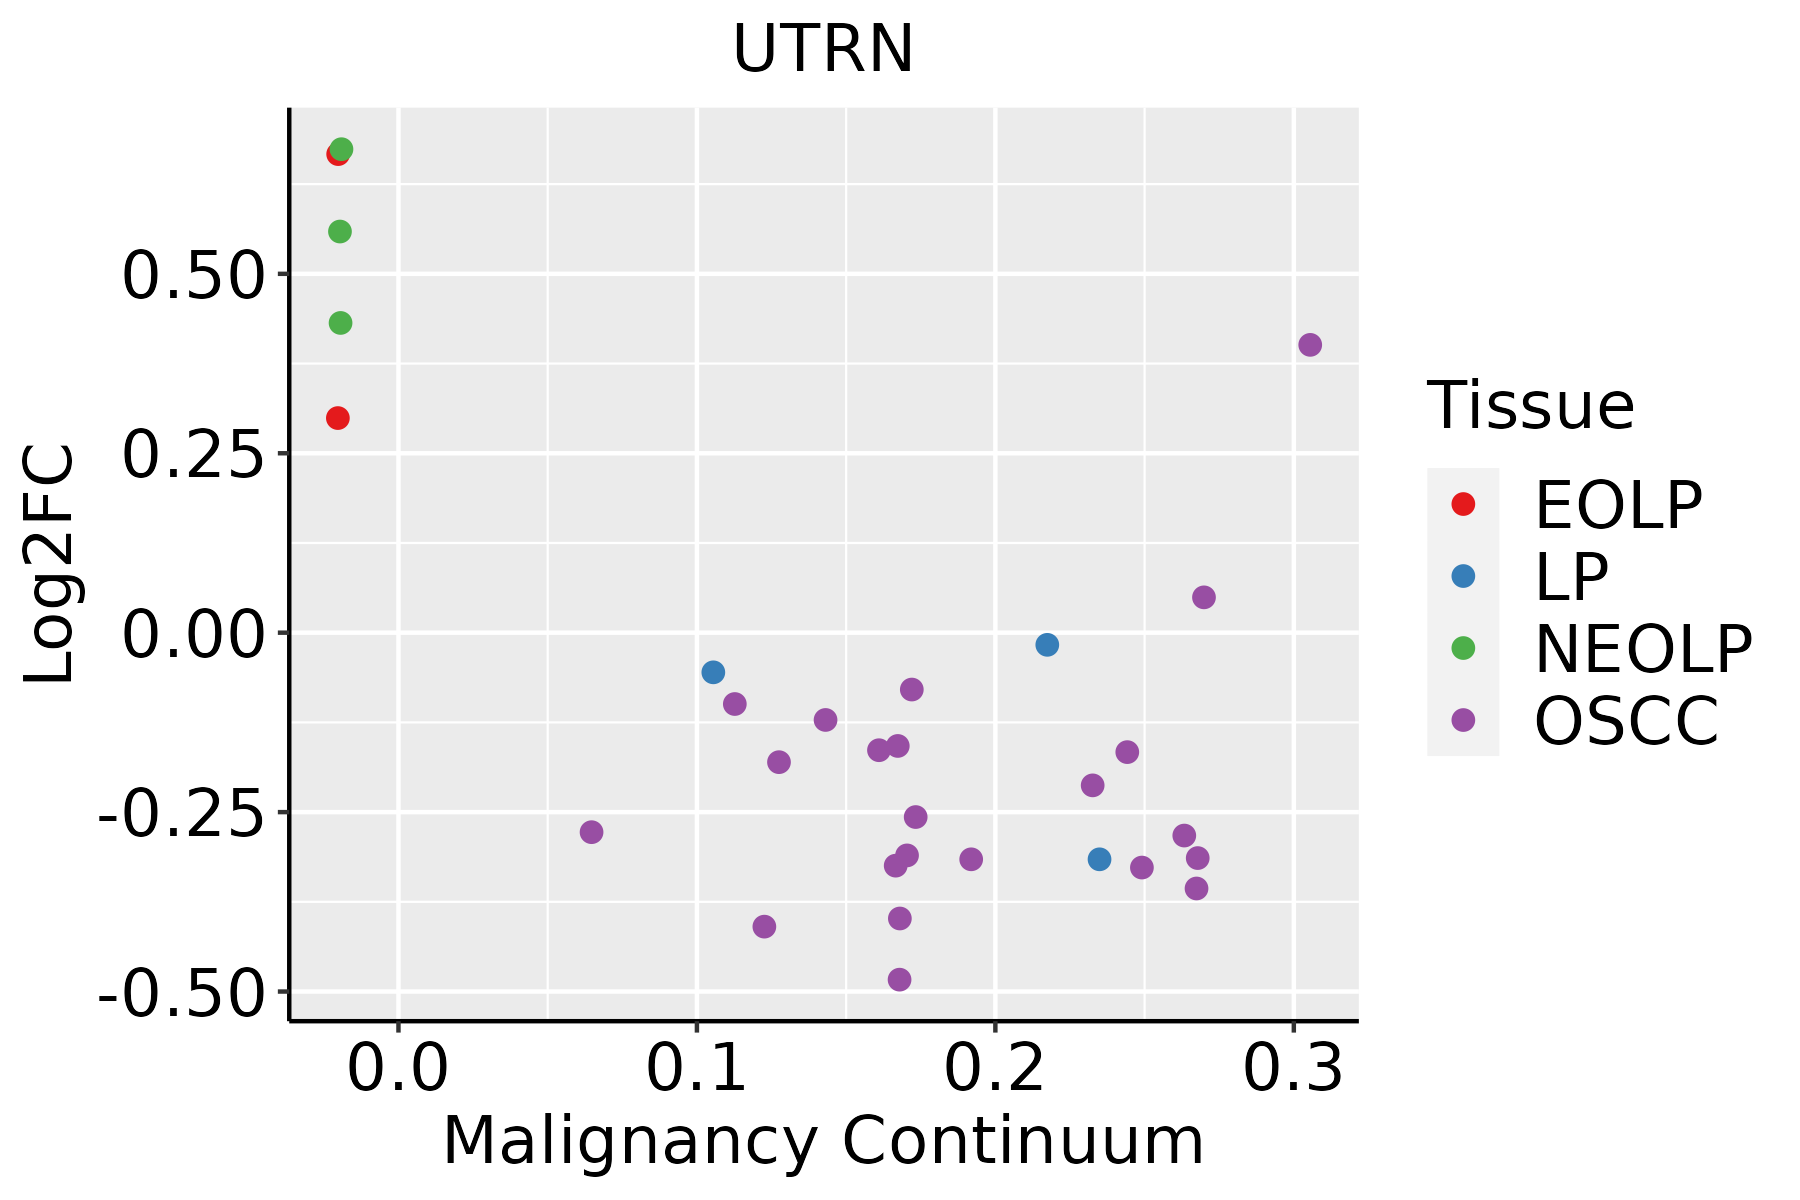 | EOLP: Erosive Oral lichen planus |
| LP: leukoplakia |
| NEOLP: Non-erosive oral lichen planus |
| OSCC: Oral squamous cell carcinoma |
| Prostate |  | BPH: Benign Prostatic Hyperplasia |
| Skin | 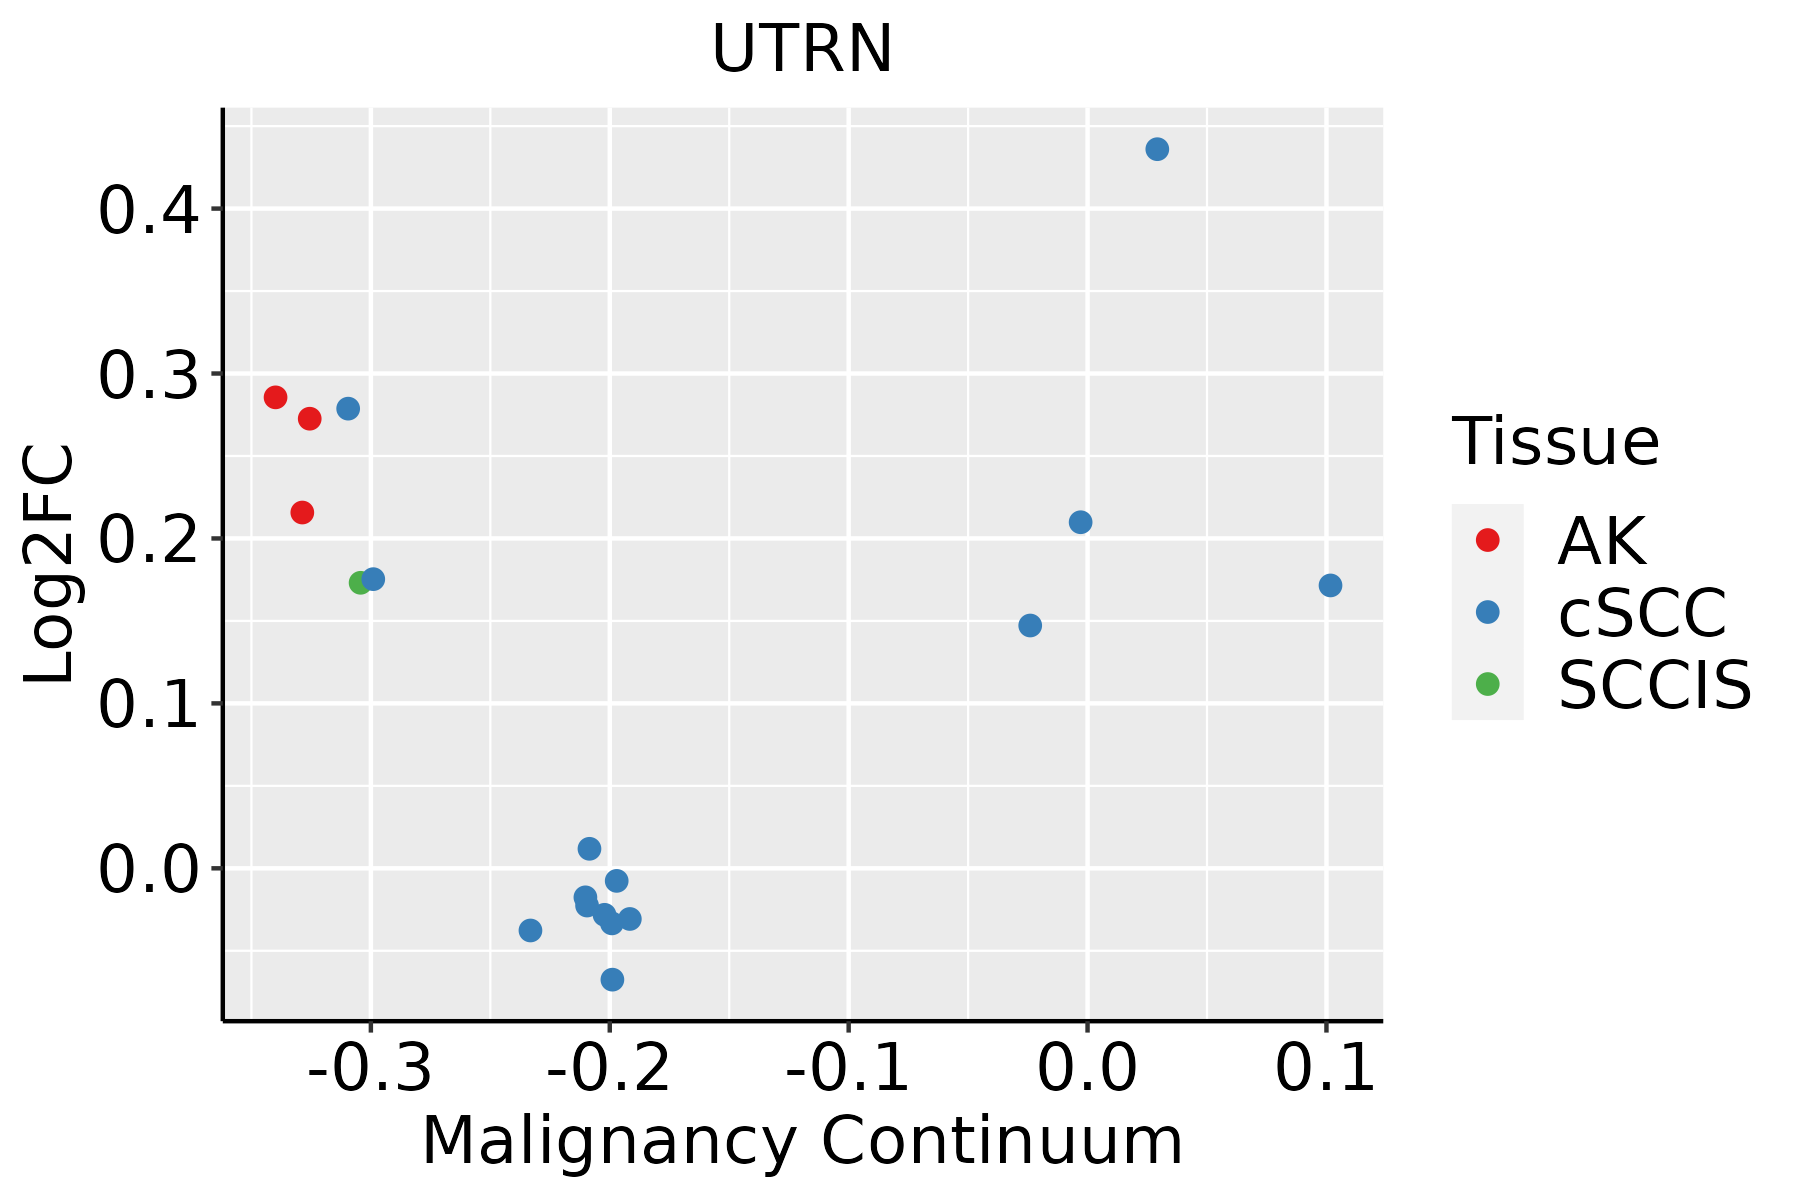 | AK: Actinic keratosis |
| cSCC: Cutaneous squamous cell carcinoma |
| SCCIS:squamous cell carcinoma in situ |
| Thyroid |  | ATC: Anaplastic thyroid cancer |
| HT: Hashimoto's thyroiditis |
| PTC: Papillary thyroid cancer |
| GO ID | Tissue | Disease Stage | Description | Gene Ratio | Bg Ratio | pvalue | p.adjust | Count |
| GO:190230510 | Endometrium | AEH | regulation of sodium ion transmembrane transport | 16/2100 | 68/18723 | 2.96e-03 | 2.11e-02 | 16 |
| GO:00228986 | Endometrium | AEH | regulation of transmembrane transporter activity | 45/2100 | 278/18723 | 7.34e-03 | 4.18e-02 | 45 |
| GO:19040623 | Endometrium | AEH | regulation of cation transmembrane transport | 55/2100 | 357/18723 | 9.18e-03 | 4.96e-02 | 55 |
| GO:001081016 | Endometrium | EEC | regulation of cell-substrate adhesion | 63/2168 | 221/18723 | 5.17e-12 | 8.85e-10 | 63 |
| GO:003158915 | Endometrium | EEC | cell-substrate adhesion | 87/2168 | 363/18723 | 1.95e-11 | 3.00e-09 | 87 |
| GO:004578517 | Endometrium | EEC | positive regulation of cell adhesion | 98/2168 | 437/18723 | 6.15e-11 | 8.38e-09 | 98 |
| GO:001081117 | Endometrium | EEC | positive regulation of cell-substrate adhesion | 37/2168 | 123/18723 | 2.59e-08 | 1.51e-06 | 37 |
| GO:000195213 | Endometrium | EEC | regulation of cell-matrix adhesion | 37/2168 | 128/18723 | 8.21e-08 | 4.23e-06 | 37 |
| GO:000716014 | Endometrium | EEC | cell-matrix adhesion | 54/2168 | 233/18723 | 3.98e-07 | 1.56e-05 | 54 |
| GO:000195414 | Endometrium | EEC | positive regulation of cell-matrix adhesion | 18/2168 | 58/18723 | 6.08e-05 | 9.21e-04 | 18 |
| GO:000301213 | Endometrium | EEC | muscle system process | 79/2168 | 452/18723 | 1.16e-04 | 1.55e-03 | 79 |
| GO:000751712 | Endometrium | EEC | muscle organ development | 59/2168 | 327/18723 | 3.49e-04 | 3.85e-03 | 59 |
| GO:001095914 | Endometrium | EEC | regulation of metal ion transport | 70/2168 | 406/18723 | 4.12e-04 | 4.35e-03 | 70 |
| GO:00069361 | Endometrium | EEC | muscle contraction | 59/2168 | 347/18723 | 1.57e-03 | 1.26e-02 | 59 |
| GO:00020289 | Endometrium | EEC | regulation of sodium ion transport | 20/2168 | 90/18723 | 2.92e-03 | 2.06e-02 | 20 |
| GO:190230513 | Endometrium | EEC | regulation of sodium ion transmembrane transport | 16/2168 | 68/18723 | 4.08e-03 | 2.68e-02 | 16 |
| GO:003158919 | Esophagus | ESCC | cell-substrate adhesion | 221/8552 | 363/18723 | 3.06e-09 | 6.62e-08 | 221 |
| GO:001081020 | Esophagus | ESCC | regulation of cell-substrate adhesion | 144/8552 | 221/18723 | 3.55e-09 | 7.45e-08 | 144 |
| GO:004578527 | Esophagus | ESCC | positive regulation of cell adhesion | 255/8552 | 437/18723 | 5.07e-08 | 9.11e-07 | 255 |
| GO:001081126 | Esophagus | ESCC | positive regulation of cell-substrate adhesion | 84/8552 | 123/18723 | 3.18e-07 | 4.50e-06 | 84 |
| Hugo Symbol | Variant Class | Variant Classification | dbSNP RS | HGVSc | HGVSp | HGVSp Short | SWISSPROT | BIOTYPE | SIFT | PolyPhen | Tumor Sample Barcode | Tissue | Histology | Sex | Age | Stage | Therapy Types | Drugs | Outcome |
| UTRN | SNV | Missense_Mutation | novel | c.8216G>C | p.Arg2739Thr | p.R2739T | P46939 | protein_coding | deleterious(0) | benign(0.153) | TCGA-3C-AALI-01 | Breast | breast invasive carcinoma | Female | <65 | I/II | Unspecific | Poly E | Complete Response |
| UTRN | SNV | Missense_Mutation | | c.4951N>G | p.Gln1651Glu | p.Q1651E | P46939 | protein_coding | deleterious(0.01) | probably_damaging(0.965) | TCGA-5L-AAT1-01 | Breast | breast invasive carcinoma | Female | <65 | III/IV | Hormone Therapy | letrozol | SD |
| UTRN | SNV | Missense_Mutation | novel | c.2422G>C | p.Asp808His | p.D808H | P46939 | protein_coding | tolerated(0.06) | benign(0.352) | TCGA-A2-A0YK-01 | Breast | breast invasive carcinoma | Female | <65 | I/II | Chemotherapy | cytoxan | SD |
| UTRN | SNV | Missense_Mutation | | c.8662G>A | p.Glu2888Lys | p.E2888K | P46939 | protein_coding | deleterious(0.02) | benign(0.087) | TCGA-A2-A0YK-01 | Breast | breast invasive carcinoma | Female | <65 | I/II | Chemotherapy | cytoxan | SD |
| UTRN | SNV | Missense_Mutation | | c.2248N>G | p.Gln750Glu | p.Q750E | P46939 | protein_coding | tolerated(0.09) | benign(0.034) | TCGA-A8-A07U-01 | Breast | breast invasive carcinoma | Female | >=65 | III/IV | Chemotherapy | 5-fluorouracil | SD |
| UTRN | SNV | Missense_Mutation | | c.5062N>C | p.Glu1688Gln | p.E1688Q | P46939 | protein_coding | deleterious(0.04) | benign(0.246) | TCGA-A8-A094-01 | Breast | breast invasive carcinoma | Female | >=65 | I/II | Unknown | Unknown | SD |
| UTRN | SNV | Missense_Mutation | | c.9578G>C | p.Arg3193Thr | p.R3193T | P46939 | protein_coding | deleterious(0) | probably_damaging(0.955) | TCGA-AC-A23H-01 | Breast | breast invasive carcinoma | Female | >=65 | I/II | Unknown | Unknown | PD |
| UTRN | SNV | Missense_Mutation | | c.2587N>C | p.Ser863Pro | p.S863P | P46939 | protein_coding | tolerated(0.26) | benign(0.037) | TCGA-AN-A0AK-01 | Breast | breast invasive carcinoma | Female | >=65 | I/II | Unknown | Unknown | SD |
| UTRN | SNV | Missense_Mutation | novel | c.8603N>C | p.Lys2868Thr | p.K2868T | P46939 | protein_coding | deleterious(0) | probably_damaging(0.999) | TCGA-AO-A0J3-01 | Breast | breast invasive carcinoma | Female | >=65 | I/II | Chemotherapy | cyclophosphamide | SD |
| UTRN | SNV | Missense_Mutation | | c.9787N>G | p.Leu3263Val | p.L3263V | P46939 | protein_coding | deleterious(0) | probably_damaging(0.977) | TCGA-AR-A251-01 | Breast | breast invasive carcinoma | Female | <65 | III/IV | Chemotherapy | doxorubicin | SD |


