
|
|||||
|
 | |
| |
| |
| |
| |
| |
|
Gene: USP8 |
Gene summary for USP8 |
| Gene information | Species | Human | Gene symbol | USP8 | Gene ID | 9101 |
| Gene name | ubiquitin specific peptidase 8 | |
| Gene Alias | HumORF8 | |
| Cytomap | 15q21.2 | |
| Gene Type | protein-coding | GO ID | GO:0000278 | UniProtAcc | A0A024R5S4 |
Top |
Malignant transformation analysis |
| Identification of the aberrant gene expression in precancerous and cancerous lesions by comparing the gene expression of stem-like cells in diseased tissues with normal stem cells |
| Entrez ID | Symbol | Replicates | Species | Organ | Tissue | Adj P-value | Log2FC | Malignancy |
| 9101 | USP8 | HTA11_3410_2000001011 | Human | Colorectum | AD | 3.50e-08 | -4.45e-01 | 0.0155 |
| 9101 | USP8 | HTA11_866_3004761011 | Human | Colorectum | AD | 1.15e-04 | -4.18e-01 | 0.096 |
| 9101 | USP8 | HTA11_7696_3000711011 | Human | Colorectum | AD | 1.49e-08 | -4.02e-01 | 0.0674 |
| 9101 | USP8 | HTA11_6818_2000001021 | Human | Colorectum | AD | 1.14e-02 | -4.12e-01 | 0.0588 |
| 9101 | USP8 | HTA11_99999970781_79442 | Human | Colorectum | MSS | 6.72e-07 | -4.70e-01 | 0.294 |
| 9101 | USP8 | HTA11_99999971662_82457 | Human | Colorectum | MSS | 1.53e-08 | -4.19e-01 | 0.3859 |
| 9101 | USP8 | HTA11_99999973899_84307 | Human | Colorectum | MSS | 7.07e-04 | -5.60e-01 | 0.2585 |
| 9101 | USP8 | HTA11_99999974143_84620 | Human | Colorectum | MSS | 9.94e-06 | -4.04e-01 | 0.3005 |
| 9101 | USP8 | A015-C-203 | Human | Colorectum | FAP | 1.18e-22 | -1.37e-02 | -0.1294 |
| 9101 | USP8 | A015-C-204 | Human | Colorectum | FAP | 2.24e-02 | -7.37e-02 | -0.0228 |
| 9101 | USP8 | A002-C-201 | Human | Colorectum | FAP | 8.61e-07 | -9.31e-02 | 0.0324 |
| 9101 | USP8 | A002-C-203 | Human | Colorectum | FAP | 3.03e-04 | -1.48e-01 | 0.2786 |
| 9101 | USP8 | A001-C-119 | Human | Colorectum | FAP | 9.80e-11 | 4.37e-01 | -0.1557 |
| 9101 | USP8 | A001-C-108 | Human | Colorectum | FAP | 3.33e-13 | 5.48e-02 | -0.0272 |
| 9101 | USP8 | A002-C-205 | Human | Colorectum | FAP | 2.03e-17 | 4.10e-02 | -0.1236 |
| 9101 | USP8 | A001-C-104 | Human | Colorectum | FAP | 1.72e-02 | 7.18e-02 | 0.0184 |
| 9101 | USP8 | A015-C-005 | Human | Colorectum | FAP | 9.54e-03 | -2.15e-01 | -0.0336 |
| 9101 | USP8 | A015-C-006 | Human | Colorectum | FAP | 4.14e-11 | -1.20e-01 | -0.0994 |
| 9101 | USP8 | A015-C-106 | Human | Colorectum | FAP | 1.00e-08 | 4.77e-02 | -0.0511 |
| 9101 | USP8 | A002-C-114 | Human | Colorectum | FAP | 1.08e-12 | -2.42e-02 | -0.1561 |
| Page: 1 2 3 4 5 6 7 8 |
| Tissue | Expression Dynamics | Abbreviation |
| Colorectum (GSE201348) |  | FAP: Familial adenomatous polyposis |
| CRC: Colorectal cancer | ||
| Colorectum (HTA11) | 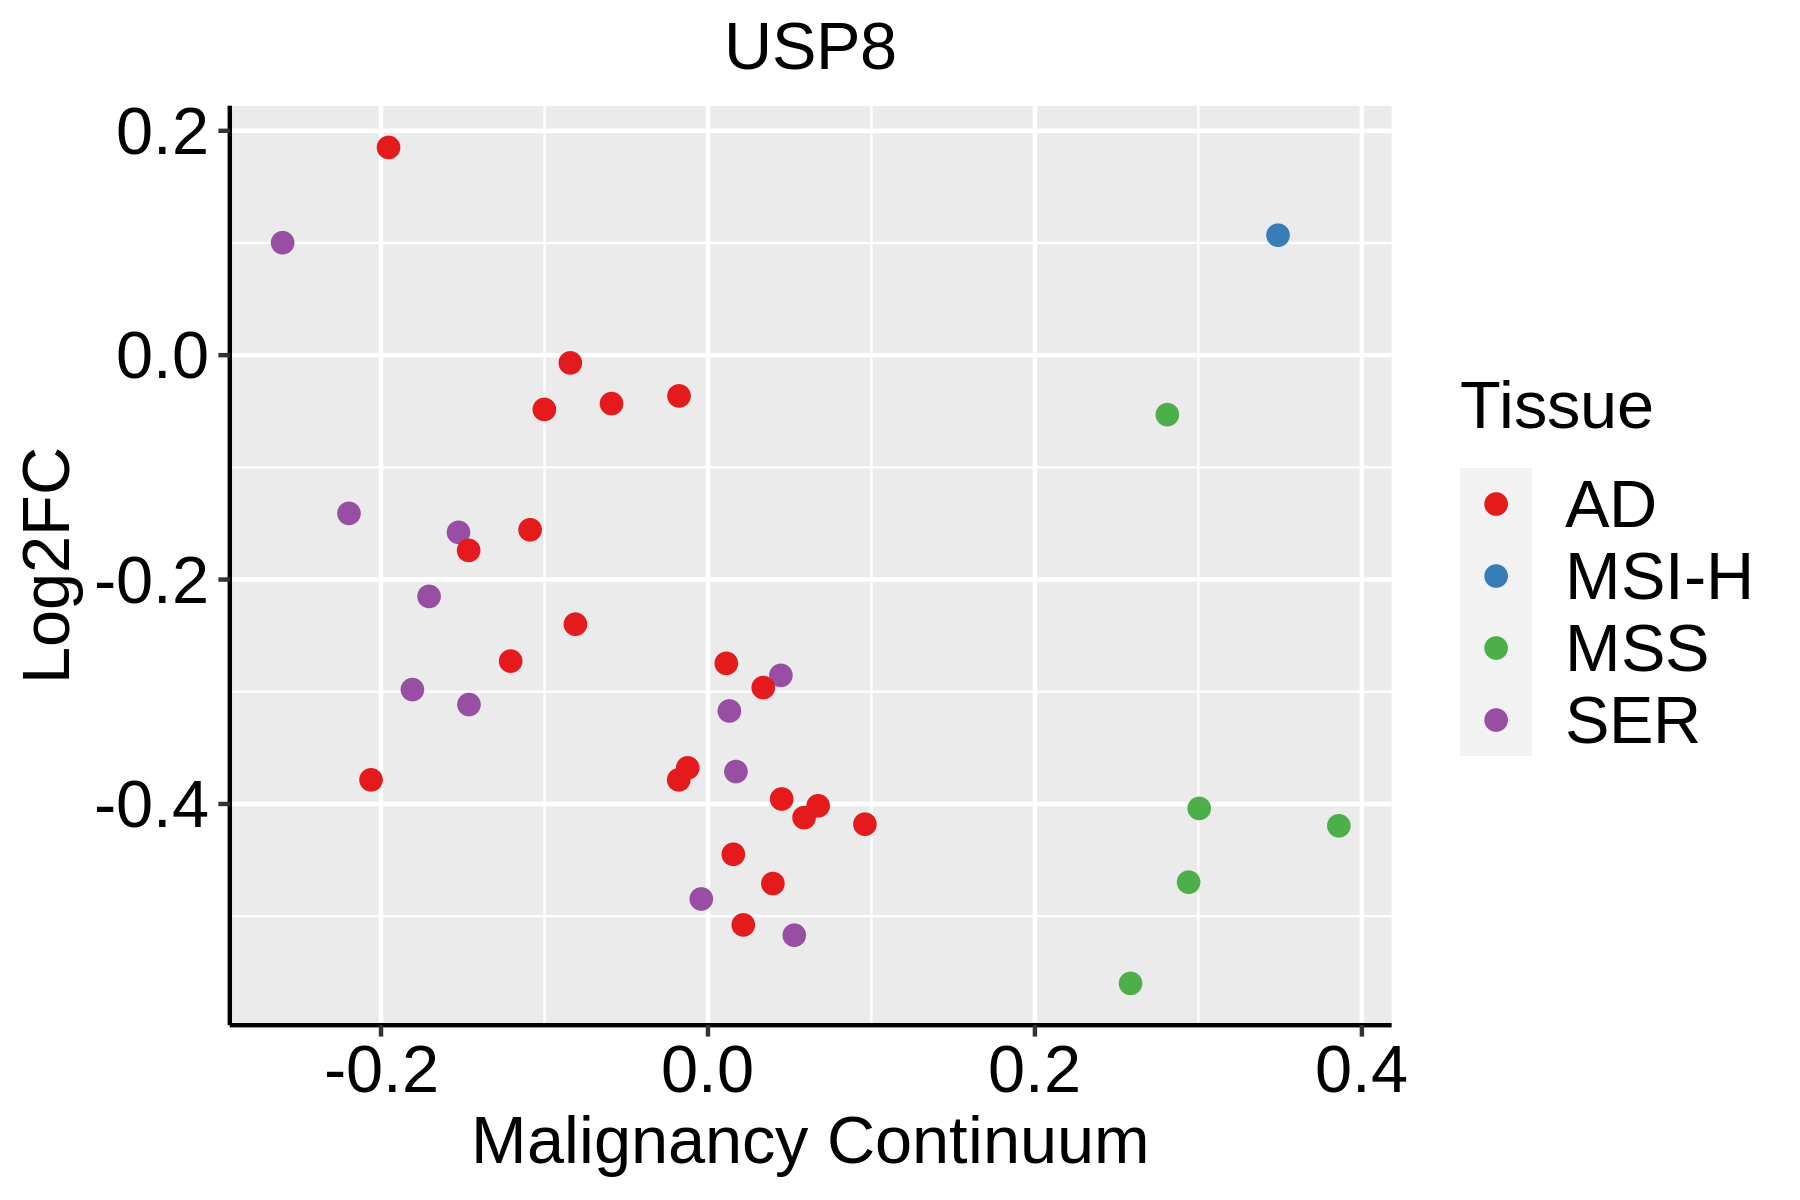 | AD: Adenomas |
| SER: Sessile serrated lesions | ||
| MSI-H: Microsatellite-high colorectal cancer | ||
| MSS: Microsatellite stable colorectal cancer | ||
| Esophagus | 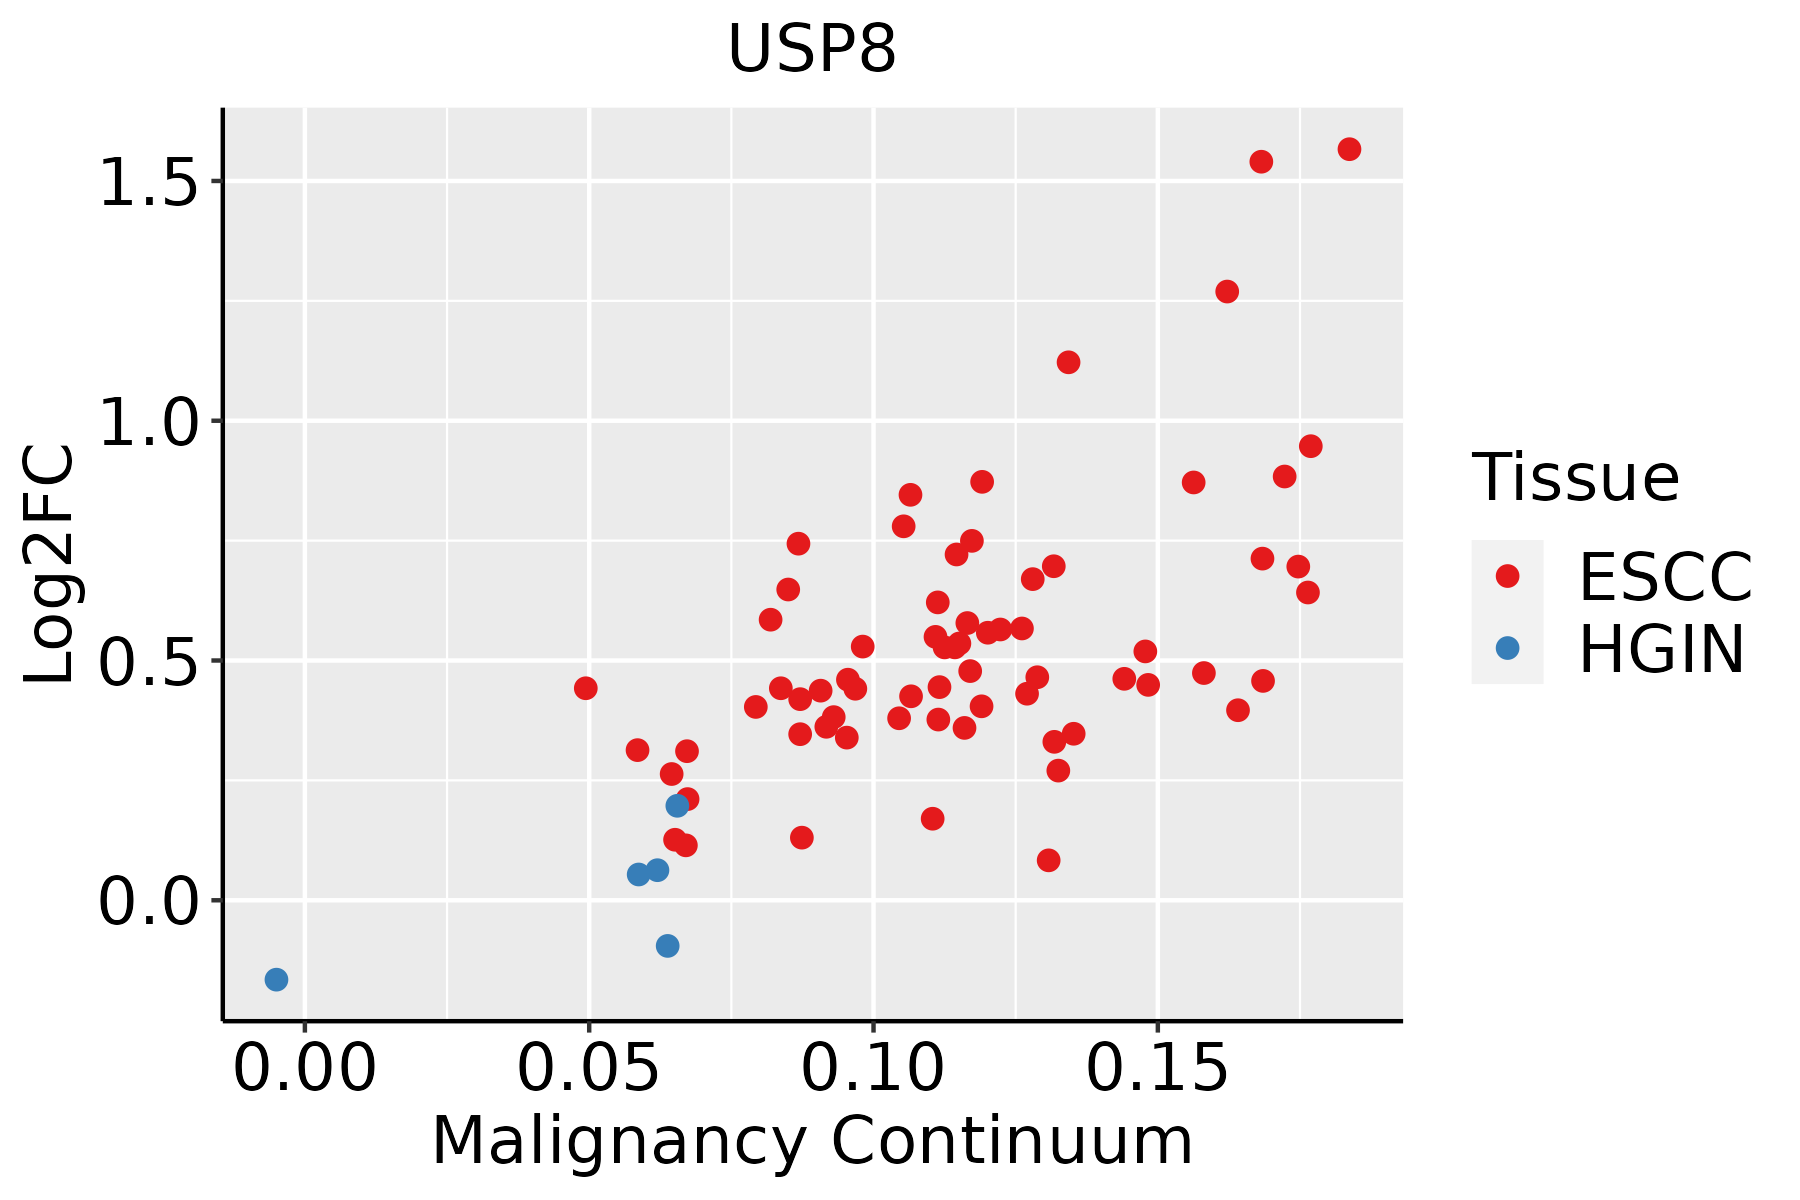 | ESCC: Esophageal squamous cell carcinoma |
| HGIN: High-grade intraepithelial neoplasias | ||
| LGIN: Low-grade intraepithelial neoplasias | ||
| Liver |  | HCC: Hepatocellular carcinoma |
| NAFLD: Non-alcoholic fatty liver disease | ||
| Oral Cavity | 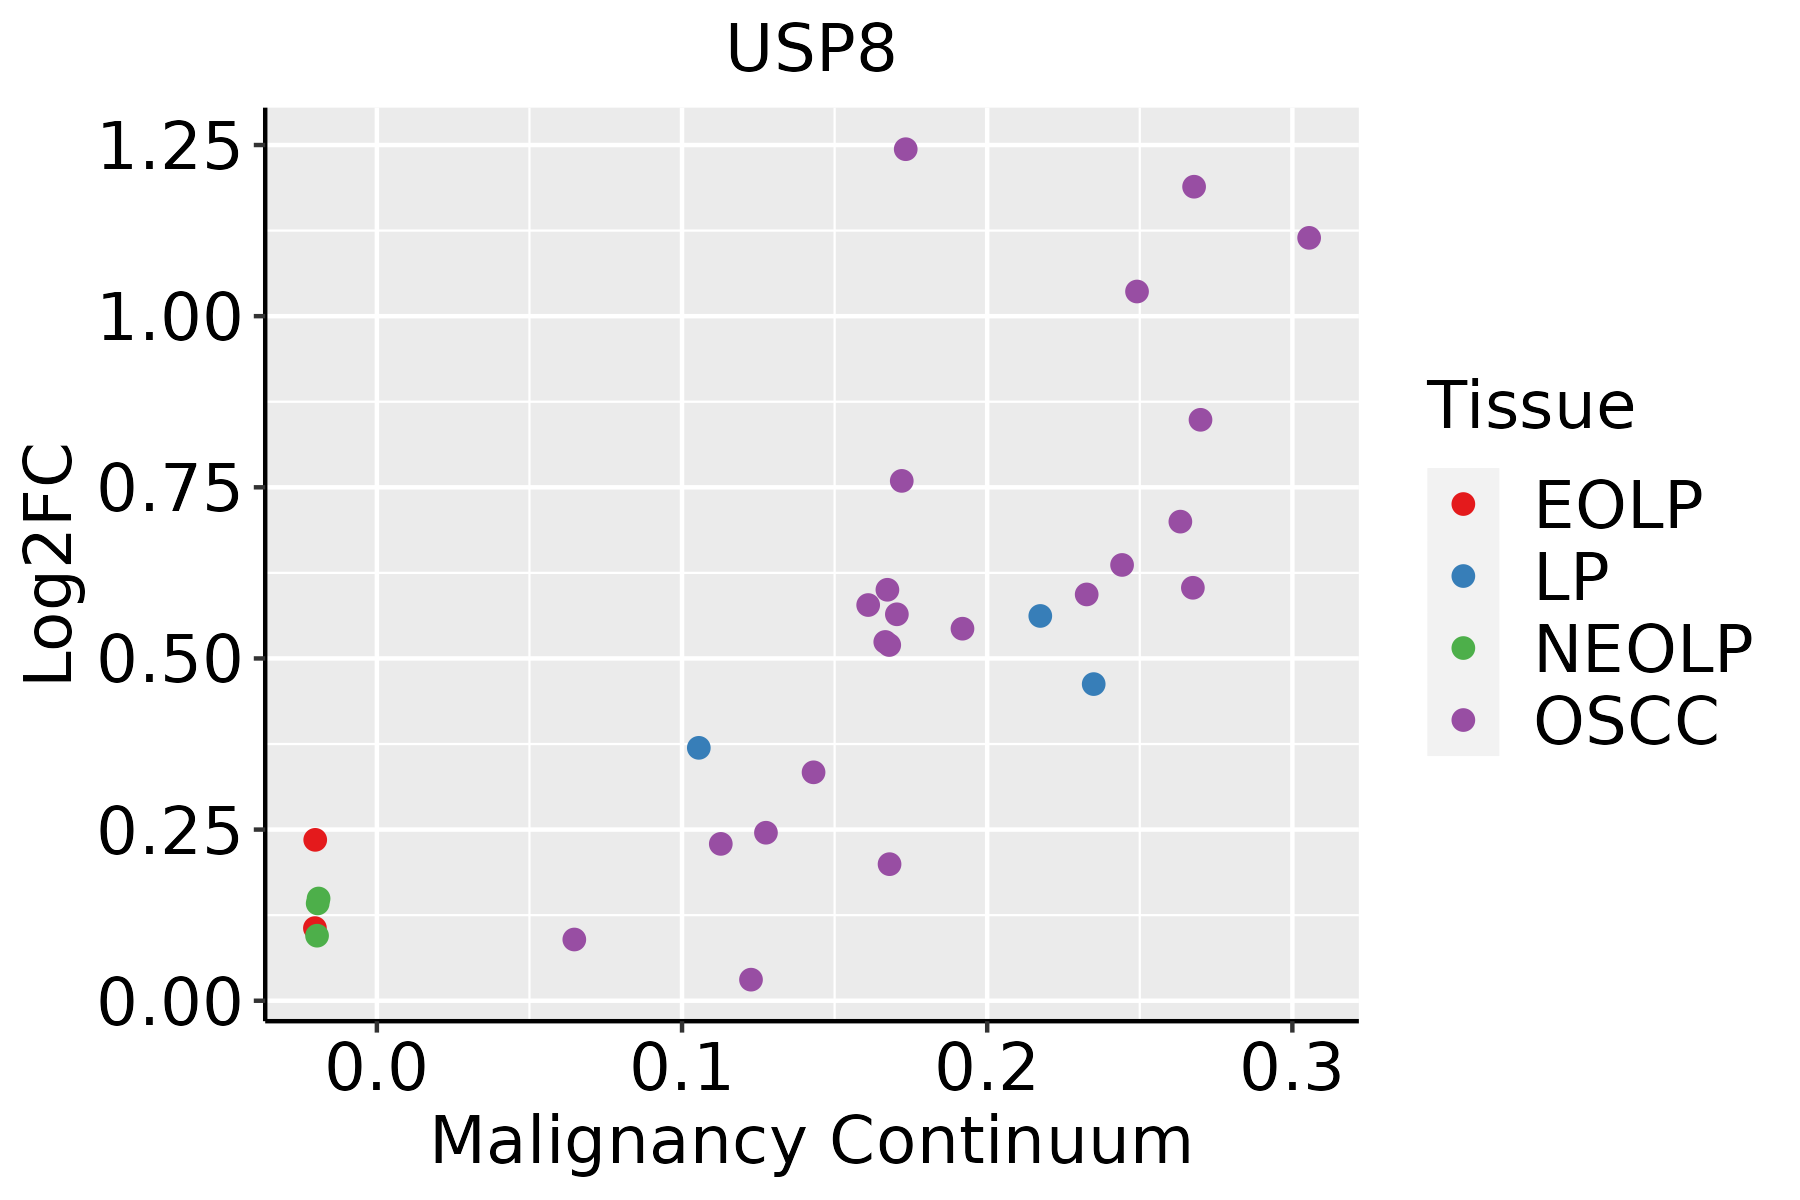 | EOLP: Erosive Oral lichen planus |
| LP: leukoplakia | ||
| NEOLP: Non-erosive oral lichen planus | ||
| OSCC: Oral squamous cell carcinoma | ||
| Skin | 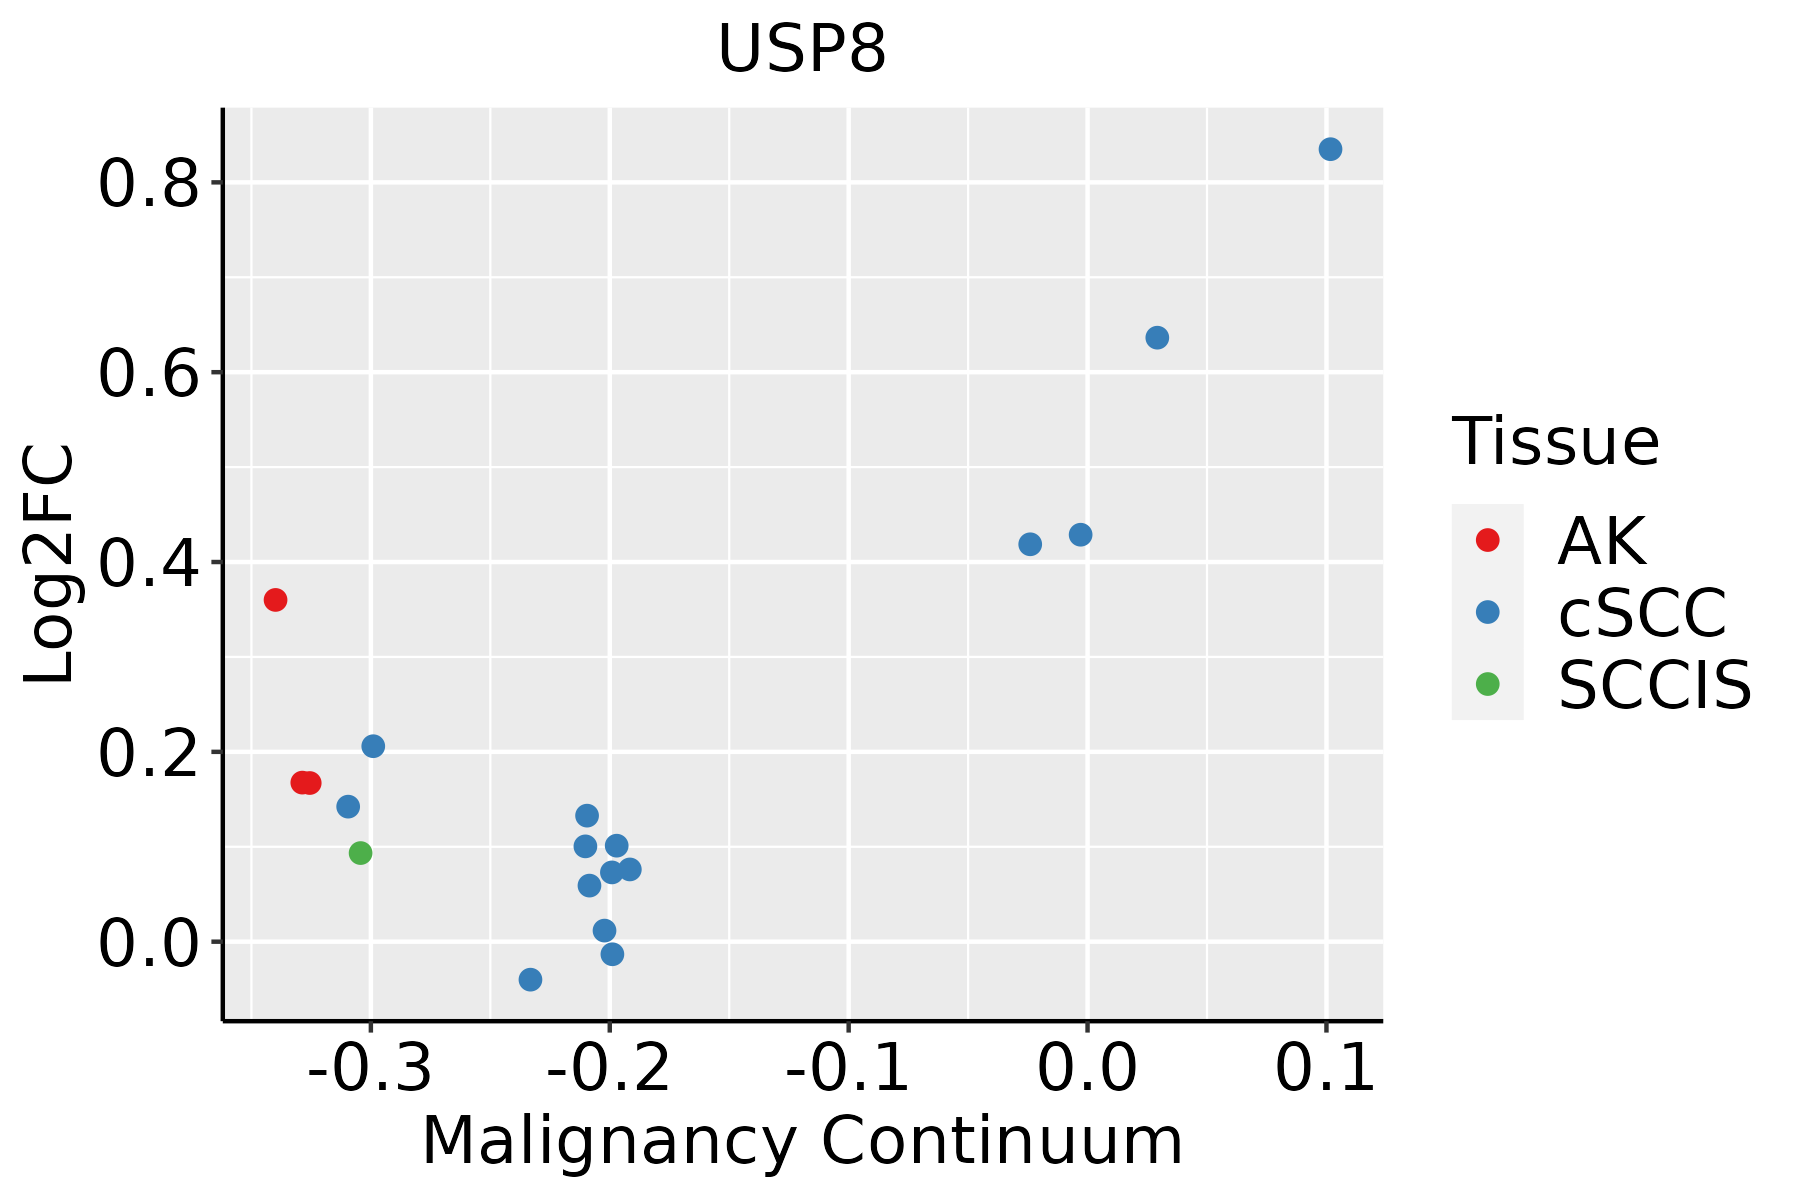 | AK: Actinic keratosis |
| cSCC: Cutaneous squamous cell carcinoma | ||
| SCCIS:squamous cell carcinoma in situ | ||
| Thyroid | 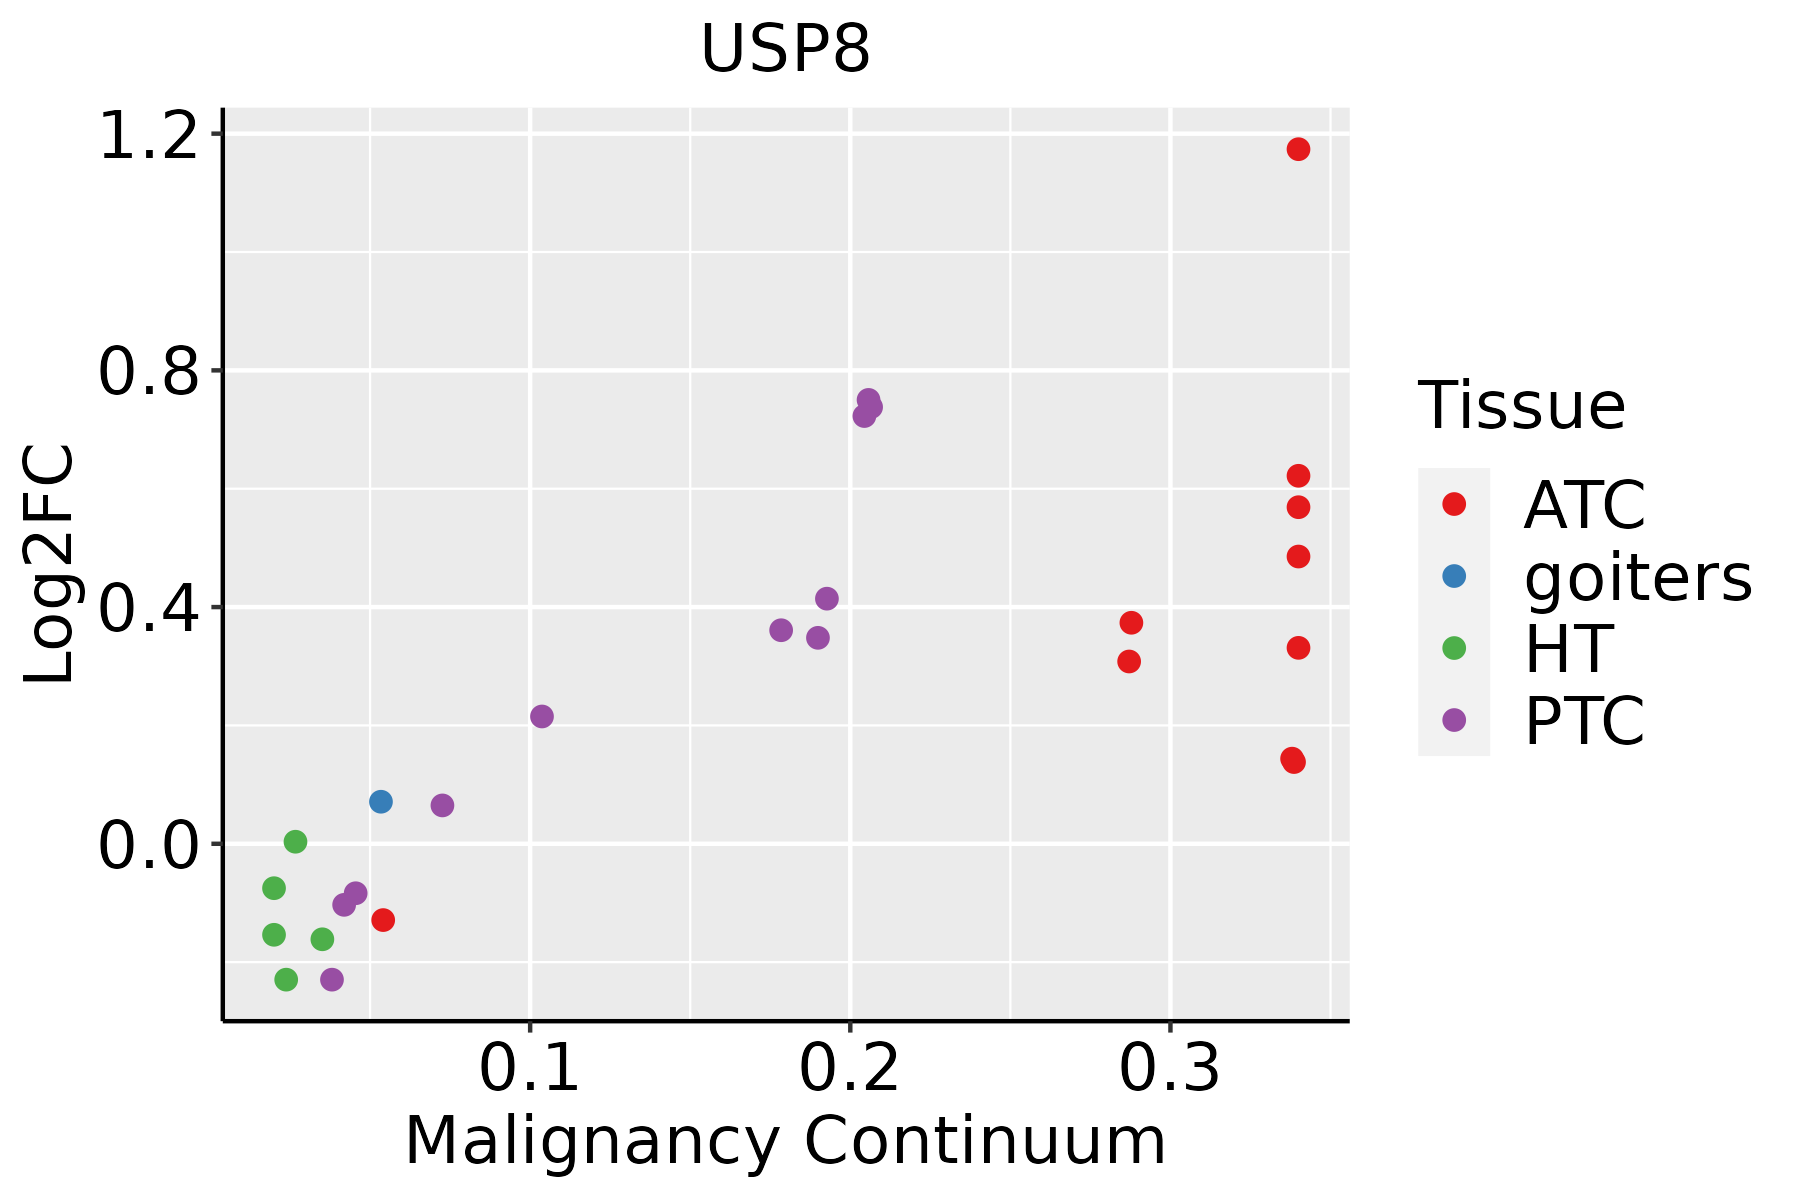 | ATC: Anaplastic thyroid cancer |
| HT: Hashimoto's thyroiditis | ||
| PTC: Papillary thyroid cancer |
| ∗log2FC in expression of this searched gene in stem-like cells from each diseased tissue sample relative to stem-like cells in normal samples in each tissue plotted against the malignancy continuum. Samples are colored based on if they are from different disease stage. |
Top |
Malignant transformation related pathway analysis |
| Find out the enriched GO biological processes and KEGG pathways involved in transition from healthy to precancer to cancer |
| Tissue | Disease Stage | Enriched GO biological Processes |
| Colorectum | AD |  |
| Colorectum | SER |  |
| Colorectum | MSS |  |
| Colorectum | MSI-H |  |
| Colorectum | FAP |  |
| ∗Top 15 enriched GO BP terms are showed in the bar plot of each disease state in each tissue. Each row represents a significant GO biological process which is colored according to the -log10(p.adjust). |
| Page: 1 2 3 4 5 6 7 8 9 |
| GO ID | Tissue | Disease Stage | Description | Gene Ratio | Bg Ratio | pvalue | p.adjust | Count |
| GO:000028115 | Esophagus | ESCC | mitotic cytokinesis | 58/8552 | 71/18723 | 4.34e-10 | 1.15e-08 | 58 |
| GO:000091016 | Esophagus | ESCC | cytokinesis | 115/8552 | 173/18723 | 2.48e-08 | 4.68e-07 | 115 |
| GO:0048545111 | Esophagus | ESCC | response to steroid hormone | 204/8552 | 339/18723 | 4.47e-08 | 8.11e-07 | 204 |
| GO:006164015 | Esophagus | ESCC | cytoskeleton-dependent cytokinesis | 72/8552 | 100/18723 | 8.10e-08 | 1.39e-06 | 72 |
| GO:000703214 | Esophagus | ESCC | endosome organization | 61/8552 | 82/18723 | 1.13e-07 | 1.85e-06 | 61 |
| GO:000726510 | Esophagus | ESCC | Ras protein signal transduction | 201/8552 | 337/18723 | 1.44e-07 | 2.30e-06 | 201 |
| GO:003011117 | Esophagus | ESCC | regulation of Wnt signaling pathway | 194/8552 | 328/18723 | 5.39e-07 | 7.14e-06 | 194 |
| GO:006007016 | Esophagus | ESCC | canonical Wnt signaling pathway | 180/8552 | 303/18723 | 9.15e-07 | 1.17e-05 | 180 |
| GO:0071383110 | Esophagus | ESCC | cellular response to steroid hormone stimulus | 127/8552 | 204/18723 | 1.26e-06 | 1.55e-05 | 127 |
| GO:006082817 | Esophagus | ESCC | regulation of canonical Wnt signaling pathway | 153/8552 | 253/18723 | 1.38e-06 | 1.67e-05 | 153 |
| GO:1901654111 | Esophagus | ESCC | response to ketone | 118/8552 | 194/18723 | 1.45e-05 | 1.31e-04 | 118 |
| GO:009026316 | Esophagus | ESCC | positive regulation of canonical Wnt signaling pathway | 69/8552 | 106/18723 | 4.22e-05 | 3.39e-04 | 69 |
| GO:003017716 | Esophagus | ESCC | positive regulation of Wnt signaling pathway | 87/8552 | 140/18723 | 6.18e-05 | 4.73e-04 | 87 |
| GO:199009017 | Esophagus | ESCC | cellular response to nerve growth factor stimulus | 38/8552 | 53/18723 | 1.10e-04 | 7.69e-04 | 38 |
| GO:007064612 | Esophagus | ESCC | protein modification by small protein removal | 95/8552 | 157/18723 | 1.25e-04 | 8.56e-04 | 95 |
| GO:199008916 | Esophagus | ESCC | response to nerve growth factor | 39/8552 | 56/18723 | 2.44e-04 | 1.51e-03 | 39 |
| GO:19016556 | Esophagus | ESCC | cellular response to ketone | 59/8552 | 96/18723 | 1.32e-03 | 6.30e-03 | 59 |
| GO:003196020 | Esophagus | ESCC | response to corticosteroid | 95/8552 | 167/18723 | 2.27e-03 | 9.99e-03 | 95 |
| GO:005138420 | Esophagus | ESCC | response to glucocorticoid | 85/8552 | 148/18723 | 2.60e-03 | 1.11e-02 | 85 |
| GO:00165793 | Esophagus | ESCC | protein deubiquitination | 79/8552 | 139/18723 | 5.23e-03 | 1.97e-02 | 79 |
| Page: 1 2 3 4 5 6 7 8 9 10 11 12 13 14 15 16 17 18 19 |
| Pathway ID | Tissue | Disease Stage | Description | Gene Ratio | Bg Ratio | pvalue | p.adjust | qvalue | Count |
| hsa04144 | Colorectum | AD | Endocytosis | 111/2092 | 251/8465 | 5.95e-12 | 1.42e-10 | 9.08e-11 | 111 |
| hsa04137 | Colorectum | AD | Mitophagy - animal | 29/2092 | 72/8465 | 2.49e-03 | 1.35e-02 | 8.59e-03 | 29 |
| hsa041441 | Colorectum | AD | Endocytosis | 111/2092 | 251/8465 | 5.95e-12 | 1.42e-10 | 9.08e-11 | 111 |
| hsa041371 | Colorectum | AD | Mitophagy - animal | 29/2092 | 72/8465 | 2.49e-03 | 1.35e-02 | 8.59e-03 | 29 |
| hsa041444 | Colorectum | MSS | Endocytosis | 102/1875 | 251/8465 | 1.85e-11 | 4.43e-10 | 2.71e-10 | 102 |
| hsa041374 | Colorectum | MSS | Mitophagy - animal | 27/1875 | 72/8465 | 2.17e-03 | 1.10e-02 | 6.76e-03 | 27 |
| hsa041445 | Colorectum | MSS | Endocytosis | 102/1875 | 251/8465 | 1.85e-11 | 4.43e-10 | 2.71e-10 | 102 |
| hsa041375 | Colorectum | MSS | Mitophagy - animal | 27/1875 | 72/8465 | 2.17e-03 | 1.10e-02 | 6.76e-03 | 27 |
| hsa041446 | Colorectum | FAP | Endocytosis | 78/1404 | 251/8465 | 6.20e-09 | 2.96e-07 | 1.80e-07 | 78 |
| hsa041378 | Colorectum | FAP | Mitophagy - animal | 20/1404 | 72/8465 | 1.14e-02 | 3.92e-02 | 2.38e-02 | 20 |
| hsa041447 | Colorectum | FAP | Endocytosis | 78/1404 | 251/8465 | 6.20e-09 | 2.96e-07 | 1.80e-07 | 78 |
| hsa041379 | Colorectum | FAP | Mitophagy - animal | 20/1404 | 72/8465 | 1.14e-02 | 3.92e-02 | 2.38e-02 | 20 |
| hsa041448 | Colorectum | CRC | Endocytosis | 65/1091 | 251/8465 | 1.27e-08 | 1.06e-06 | 7.19e-07 | 65 |
| hsa0413710 | Colorectum | CRC | Mitophagy - animal | 17/1091 | 72/8465 | 8.74e-03 | 4.00e-02 | 2.71e-02 | 17 |
| hsa041449 | Colorectum | CRC | Endocytosis | 65/1091 | 251/8465 | 1.27e-08 | 1.06e-06 | 7.19e-07 | 65 |
| hsa0413711 | Colorectum | CRC | Mitophagy - animal | 17/1091 | 72/8465 | 8.74e-03 | 4.00e-02 | 2.71e-02 | 17 |
| hsa0414429 | Esophagus | HGIN | Endocytosis | 76/1383 | 251/8465 | 1.74e-08 | 3.34e-07 | 2.65e-07 | 76 |
| hsa0413730 | Esophagus | HGIN | Mitophagy - animal | 23/1383 | 72/8465 | 7.69e-04 | 7.59e-03 | 6.03e-03 | 23 |
| hsa04144113 | Esophagus | HGIN | Endocytosis | 76/1383 | 251/8465 | 1.74e-08 | 3.34e-07 | 2.65e-07 | 76 |
| hsa04137113 | Esophagus | HGIN | Mitophagy - animal | 23/1383 | 72/8465 | 7.69e-04 | 7.59e-03 | 6.03e-03 | 23 |
| Page: 1 2 |
Top |
Cell-cell communication analysis |
| Identification of potential cell-cell interactions between two cell types and their ligand-receptor pairs for different disease states |
| Ligand | Receptor | LRpair | Pathway | Tissue | Disease Stage |
| Page: 1 |
Top |
Single-cell gene regulatory network inference analysis |
| Find out the significant the regulons (TFs) and the target genes of each regulon across cell types for different disease states |
| TF | Cell Type | Tissue | Disease Stage | Target Gene | RSS | Regulon Activity |
| ∗The dot plots of a searched regulon are shown for all cell subpopulations in each disease state of each tissue based on the regulon specific score inferred using pySCENIC and by calculating the average expression. |
| Page: 1 |
Top |
Somatic mutation of malignant transformation related genes |
| Annotation of somatic variants for genes involved in malignant transformation |
| Hugo Symbol | Variant Class | Variant Classification | dbSNP RS | HGVSc | HGVSp | HGVSp Short | SWISSPROT | BIOTYPE | SIFT | PolyPhen | Tumor Sample Barcode | Tissue | Histology | Sex | Age | Stage | Therapy Types | Drugs | Outcome |
| USP8 | SNV | Missense_Mutation | novel | c.1933G>T | p.Gly645Trp | p.G645W | P40818 | protein_coding | deleterious(0) | probably_damaging(0.999) | TCGA-A7-A0DB-01 | Breast | breast invasive carcinoma | Female | <65 | I/II | Hormone Therapy | arimidex | SD |
| USP8 | SNV | Missense_Mutation | novel | c.1993N>C | p.Thr665Pro | p.T665P | P40818 | protein_coding | deleterious(0.01) | probably_damaging(0.966) | TCGA-A7-A3J1-01 | Breast | breast invasive carcinoma | Female | <65 | I/II | Hormone Therapy | anastrazole | SD |
| USP8 | SNV | Missense_Mutation | c.3257N>T | p.His1086Leu | p.H1086L | P40818 | protein_coding | deleterious(0) | benign(0.087) | TCGA-B6-A0RV-01 | Breast | breast invasive carcinoma | Female | <65 | III/IV | Unknown | Unknown | SD | |
| USP8 | SNV | Missense_Mutation | novel | c.424G>A | p.Gly142Arg | p.G142R | P40818 | protein_coding | tolerated(0.15) | benign(0.023) | TCGA-C8-A26Y-01 | Breast | breast invasive carcinoma | Female | >=65 | I/II | Unknown | Unknown | SD |
| USP8 | SNV | Missense_Mutation | c.2611G>C | p.Glu871Gln | p.E871Q | P40818 | protein_coding | deleterious(0) | probably_damaging(0.999) | TCGA-GM-A2D9-01 | Breast | breast invasive carcinoma | Female | >=65 | I/II | Hormone Therapy | arimidex | SD | |
| USP8 | insertion | Frame_Shift_Ins | novel | c.810_811insCTTTTAATCA | p.Gly271LeufsTer20 | p.G271Lfs*20 | P40818 | protein_coding | TCGA-BH-A0B4-01 | Breast | breast invasive carcinoma | Male | >=65 | III/IV | Hormone Therapy | tamoxiphen | SD | ||
| USP8 | insertion | Nonsense_Mutation | novel | c.811_812insAATAAGCATCAGGTTTTATACAATGA | p.Gly271GlufsTer2 | p.G271Efs*2 | P40818 | protein_coding | TCGA-BH-A0B4-01 | Breast | breast invasive carcinoma | Male | >=65 | III/IV | Hormone Therapy | tamoxiphen | SD | ||
| USP8 | SNV | Missense_Mutation | c.2159N>A | p.Pro720Gln | p.P720Q | P40818 | protein_coding | deleterious(0) | probably_damaging(0.994) | TCGA-C5-A1BI-01 | Cervix | cervical & endocervical cancer | Female | <65 | III/IV | Chemotherapy | cisplatin | SD | |
| USP8 | SNV | Missense_Mutation | c.2502G>T | p.Met834Ile | p.M834I | P40818 | protein_coding | tolerated(0.27) | benign(0.086) | TCGA-EK-A3GJ-01 | Cervix | cervical & endocervical cancer | Female | <65 | I/II | Unknown | Unknown | SD | |
| USP8 | SNV | Missense_Mutation | c.475G>C | p.Asp159His | p.D159H | P40818 | protein_coding | deleterious(0.04) | possibly_damaging(0.819) | TCGA-EK-A3GK-01 | Cervix | cervical & endocervical cancer | Female | <65 | I/II | Unknown | Unknown | SD |
| Page: 1 2 3 4 5 6 7 8 9 10 11 |
Top |
Related drugs of malignant transformation related genes |
| Identification of chemicals and drugs interact with genes involved in malignant transfromation |
| (DGIdb 4.0) |
| Entrez ID | Symbol | Category | Interaction Types | Drug Claim Name | Drug Name | PMIDs |
| Page: 1 |

Copyright 2023-Present -The University of Texas Health Science Center at Houston |