Schematic overview of the cellular and molecular mechanisms involved in the cancer progression, including the proposed cellular and molecular mechanisms in cancer cells trajectory. AT1: alveolar type 1 cells; AT2: alveolar type 2 cells; AAH: atypical adenomatous hyperplasia; AIS: adenocarcinoma in situ; MIA: minimally invasive adenocarcinoma; IA: invasive adenocarcinoma; EMT: epithelial-mesenchymal transition

Home

Download

Statistics

Help

Contact

Center for Computational Systems Medicine
leaf

Gene summary

leaf

Malignant transformation analysis

leaf

Malignant transformation related pathway analysis

leaf

Cell-cell communication analysis

leaf

Single-cell gene regulatory network inference analysis

leaf

Somatic mutation of malignant transformation related genes

leaf

Related drugs of malignant transformation related genes

Gene: TRIM33

Gene summary for TRIM33

check button Gene summary.

Gene informationSpeciesHuman
Gene symbol

TRIM33

Gene ID

51592

Gene nametripartite motif containing 33
Gene AliasECTO
Cytomap1p13.2
Gene Typeprotein-coding
GO ID

GO:0000122

UniProtAcc

B3KN30


Top

Malignant transformation analysis

check button Identification of the aberrant gene expression in precancerous and cancerous lesions by comparing the gene expression of stem-like cells in diseased tissues with normal stem cells
check button Malignant transformation involving gene list.
Entrez IDSymbolReplicatesSpeciesOrganTissueAdj P-valueLog2FCMalignancy
51592TRIM33HTA11_3410_2000001011HumanColorectumAD2.76e-09-4.08e-010.0155
51592TRIM33HTA11_866_3004761011HumanColorectumAD1.57e-02-3.47e-010.096
51592TRIM33HTA11_7696_3000711011HumanColorectumAD1.90e-05-2.68e-010.0674
51592TRIM33HTA11_99999974143_84620HumanColorectumMSS2.87e-05-2.99e-010.3005
51592TRIM33A001-C-207HumanColorectumFAP1.95e-05-2.68e-010.1278
51592TRIM33A015-C-203HumanColorectumFAP4.38e-30-3.16e-01-0.1294
51592TRIM33A015-C-204HumanColorectumFAP6.80e-12-3.84e-01-0.0228
51592TRIM33A014-C-040HumanColorectumFAP2.62e-07-4.83e-01-0.1184
51592TRIM33A002-C-201HumanColorectumFAP2.25e-17-3.29e-010.0324
51592TRIM33A002-C-203HumanColorectumFAP2.07e-06-2.61e-010.2786
51592TRIM33A001-C-119HumanColorectumFAP1.23e-12-5.37e-01-0.1557
51592TRIM33A001-C-108HumanColorectumFAP1.01e-18-2.56e-01-0.0272
51592TRIM33A002-C-205HumanColorectumFAP1.16e-24-3.32e-01-0.1236
51592TRIM33A001-C-104HumanColorectumFAP1.42e-06-2.88e-010.0184
51592TRIM33A015-C-005HumanColorectumFAP4.05e-05-2.23e-01-0.0336
51592TRIM33A015-C-006HumanColorectumFAP4.37e-16-3.54e-01-0.0994
51592TRIM33A015-C-106HumanColorectumFAP2.03e-15-1.88e-01-0.0511
51592TRIM33A002-C-114HumanColorectumFAP3.15e-21-3.97e-01-0.1561
51592TRIM33A015-C-104HumanColorectumFAP1.17e-32-4.17e-01-0.1899
51592TRIM33A001-C-014HumanColorectumFAP1.59e-14-3.21e-010.0135
Page: 1 2 3 4 5 6 7 8 

check button Transcriptomic changes along malignancy continuum.
TissueExpression DynamicsAbbreviation
Colorectum (GSE201348)The image shows the transcriptomic changes along malignancy continuum.log2FC in expression of this searched gene in stem-like cells from each diseased tissue sample relative to stem-like cells in normal samples in each tissue plotted against the malignancy continuum. Samples are colored based on if they are from different disease stage.FAP: Familial adenomatous polyposis
CRC: Colorectal cancer
Colorectum (HTA11)The image shows the transcriptomic changes along malignancy continuum.log2FC in expression of this searched gene in stem-like cells from each diseased tissue sample relative to stem-like cells in normal samples in each tissue plotted against the malignancy continuum. Samples are colored based on if they are from different disease stage.AD: Adenomas
SER: Sessile serrated lesions
MSI-H: Microsatellite-high colorectal cancer
MSS: Microsatellite stable colorectal cancer
EsophagusThe image shows the transcriptomic changes along malignancy continuum.log2FC in expression of this searched gene in stem-like cells from each diseased tissue sample relative to stem-like cells in normal samples in each tissue plotted against the malignancy continuum. Samples are colored based on if they are from different disease stage.
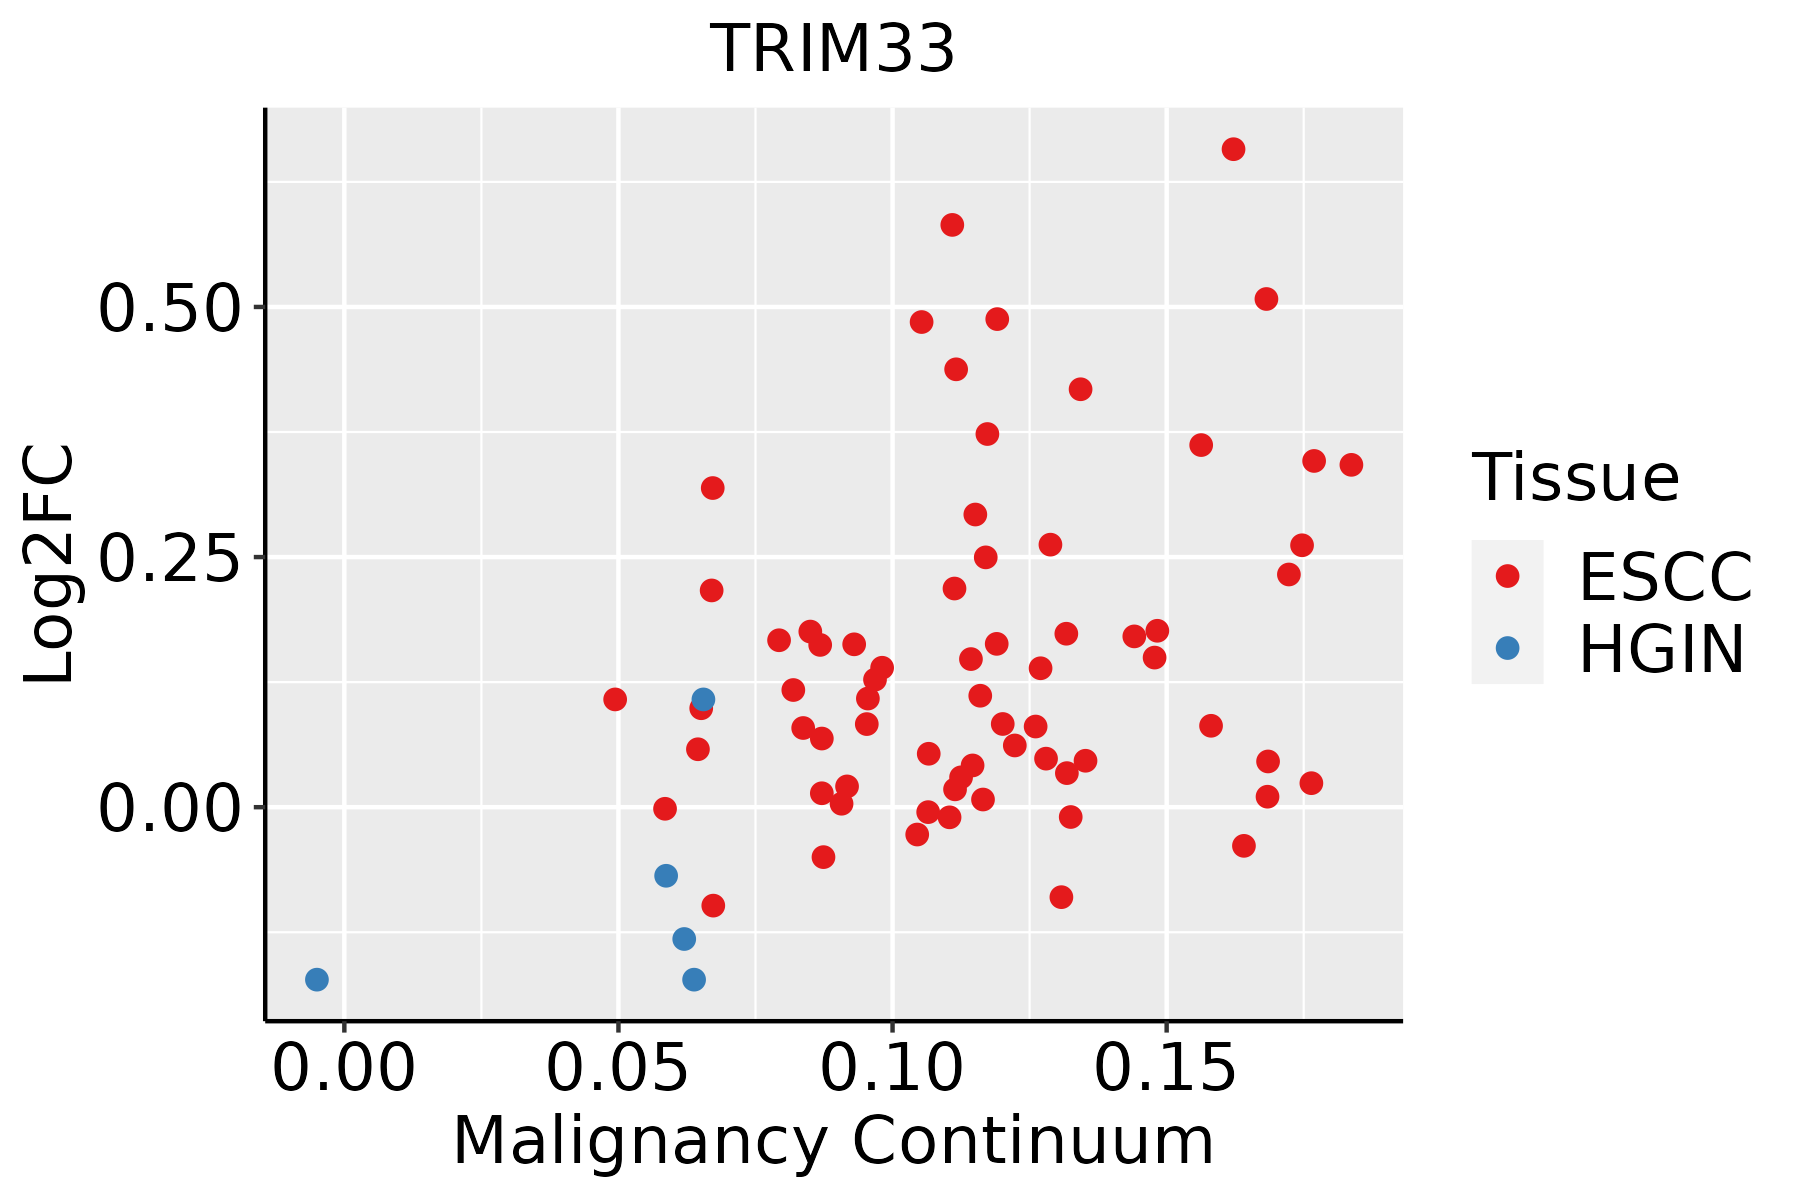
ESCC: Esophageal squamous cell carcinoma
HGIN: High-grade intraepithelial neoplasias
LGIN: Low-grade intraepithelial neoplasias
LiverThe image shows the transcriptomic changes along malignancy continuum.log2FC in expression of this searched gene in stem-like cells from each diseased tissue sample relative to stem-like cells in normal samples in each tissue plotted against the malignancy continuum. Samples are colored based on if they are from different disease stage.HCC: Hepatocellular carcinoma
NAFLD: Non-alcoholic fatty liver disease
LungThe image shows the transcriptomic changes along malignancy continuum.log2FC in expression of this searched gene in stem-like cells from each diseased tissue sample relative to stem-like cells in normal samples in each tissue plotted against the malignancy continuum. Samples are colored based on if they are from different disease stage.
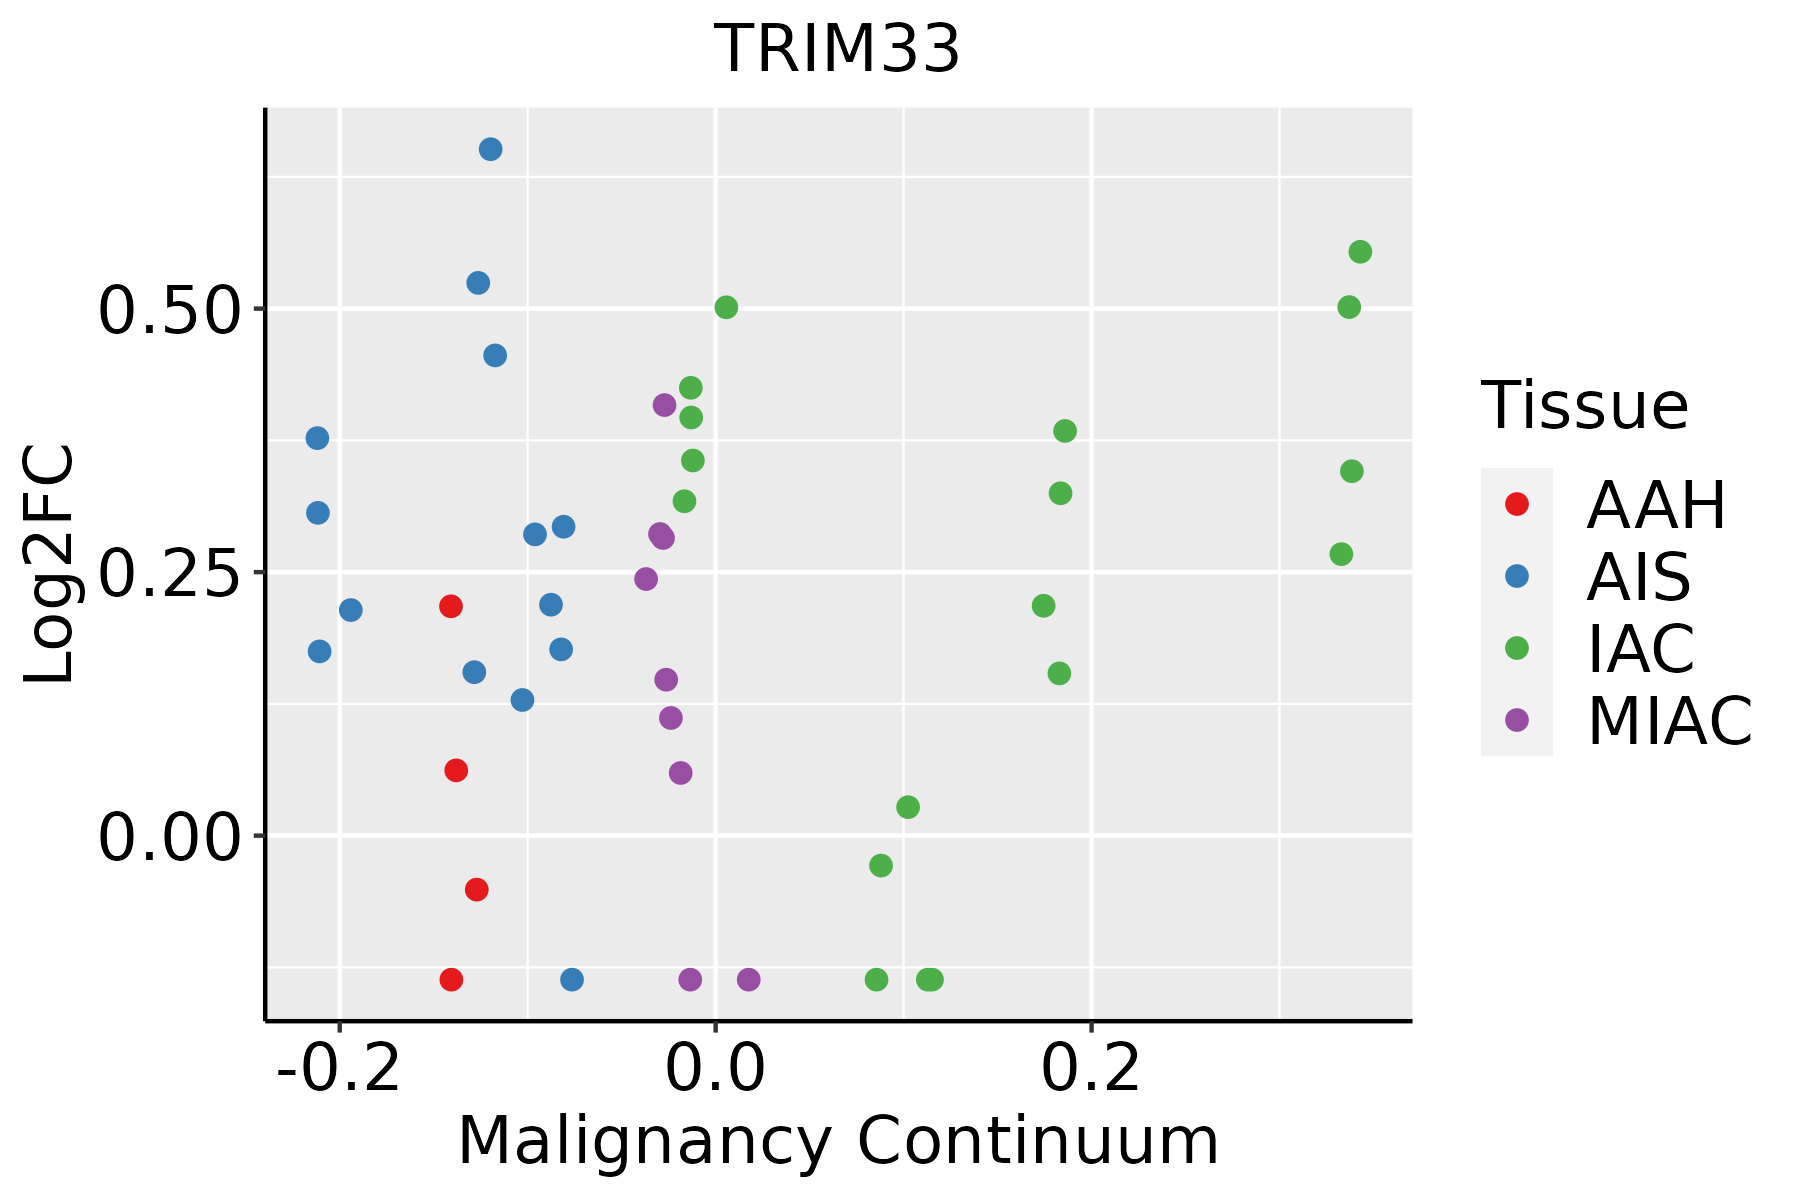
AAH: Atypical adenomatous hyperplasia
AIS: Adenocarcinoma in situ
IAC: Invasive lung adenocarcinoma
MIA: Minimally invasive adenocarcinoma
Oral CavityThe image shows the transcriptomic changes along malignancy continuum.log2FC in expression of this searched gene in stem-like cells from each diseased tissue sample relative to stem-like cells in normal samples in each tissue plotted against the malignancy continuum. Samples are colored based on if they are from different disease stage.
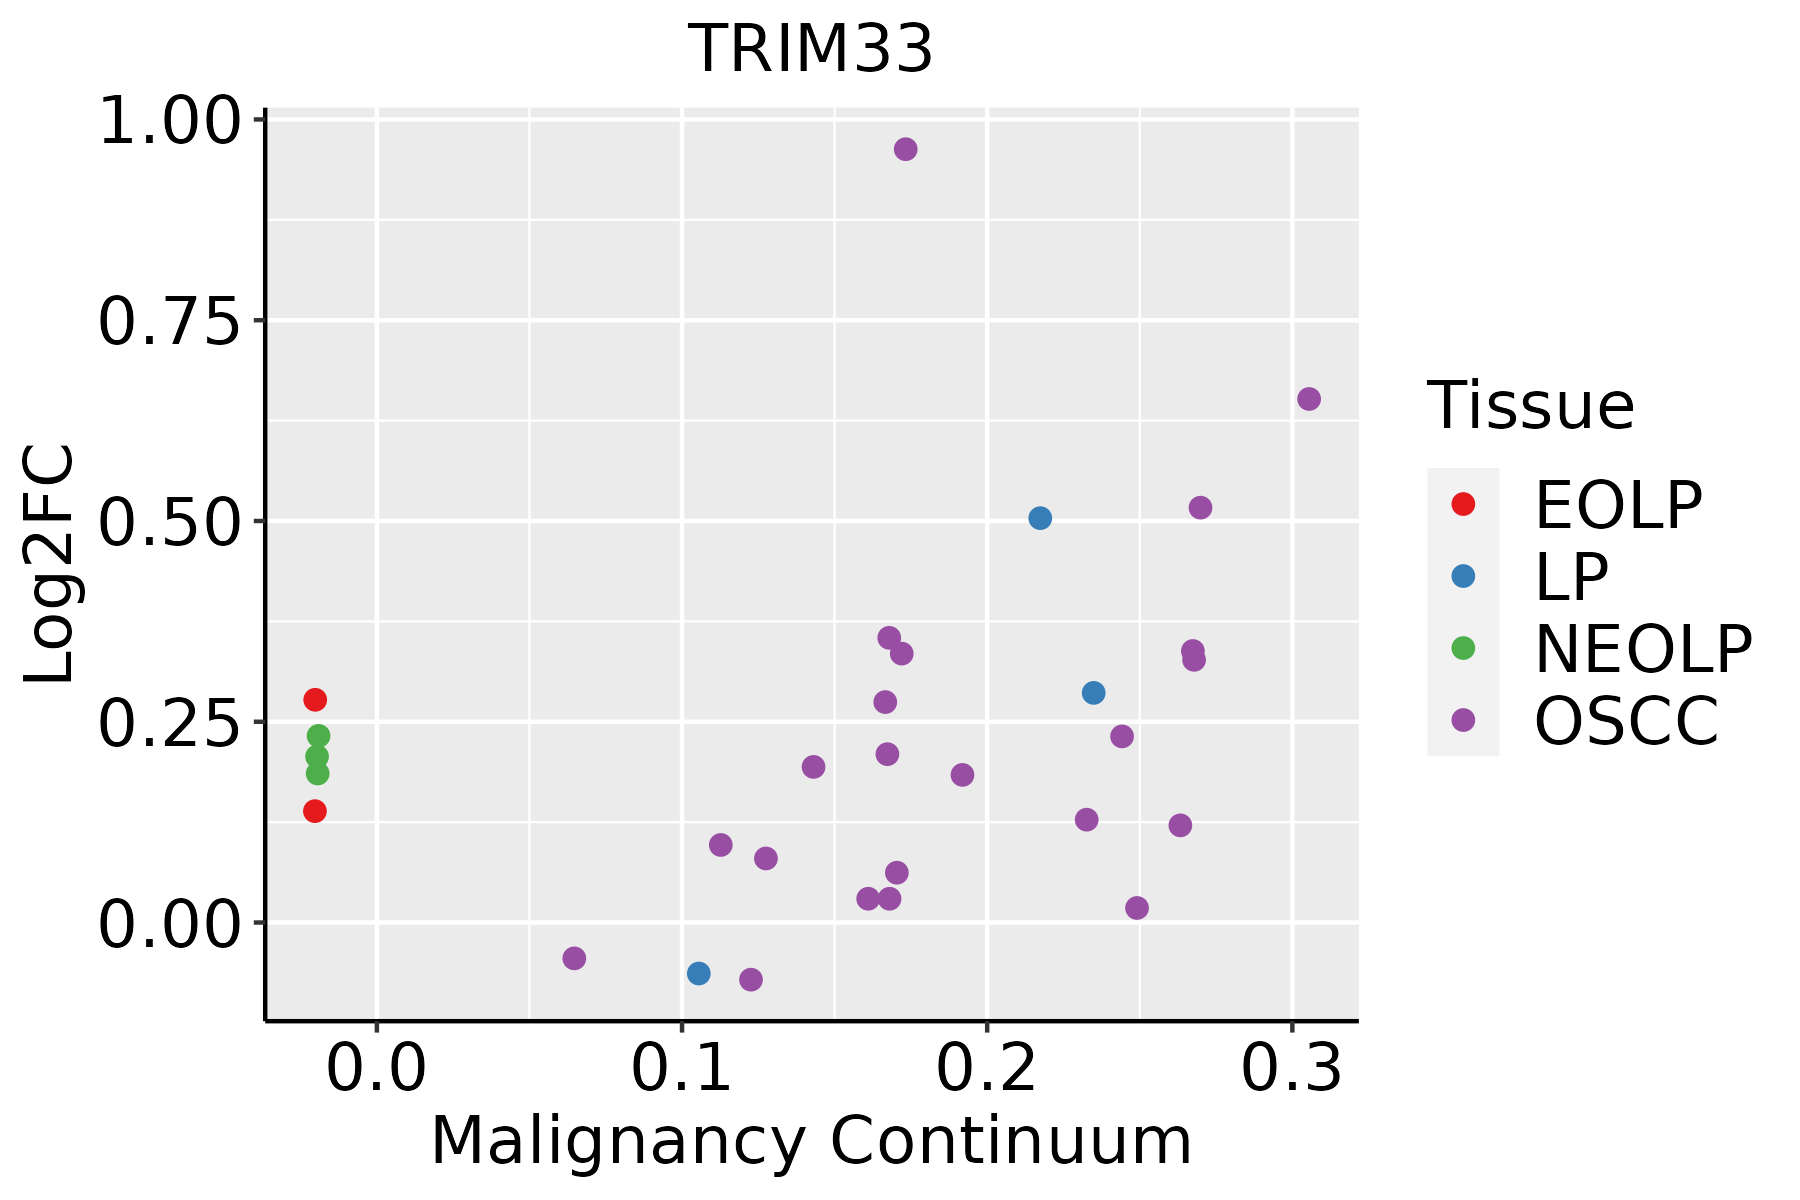
EOLP: Erosive Oral lichen planus
LP: leukoplakia
NEOLP: Non-erosive oral lichen planus
OSCC: Oral squamous cell carcinoma
ProstateThe image shows the transcriptomic changes along malignancy continuum.log2FC in expression of this searched gene in stem-like cells from each diseased tissue sample relative to stem-like cells in normal samples in each tissue plotted against the malignancy continuum. Samples are colored based on if they are from different disease stage.BPH: Benign Prostatic Hyperplasia
SkinThe image shows the transcriptomic changes along malignancy continuum.log2FC in expression of this searched gene in stem-like cells from each diseased tissue sample relative to stem-like cells in normal samples in each tissue plotted against the malignancy continuum. Samples are colored based on if they are from different disease stage.
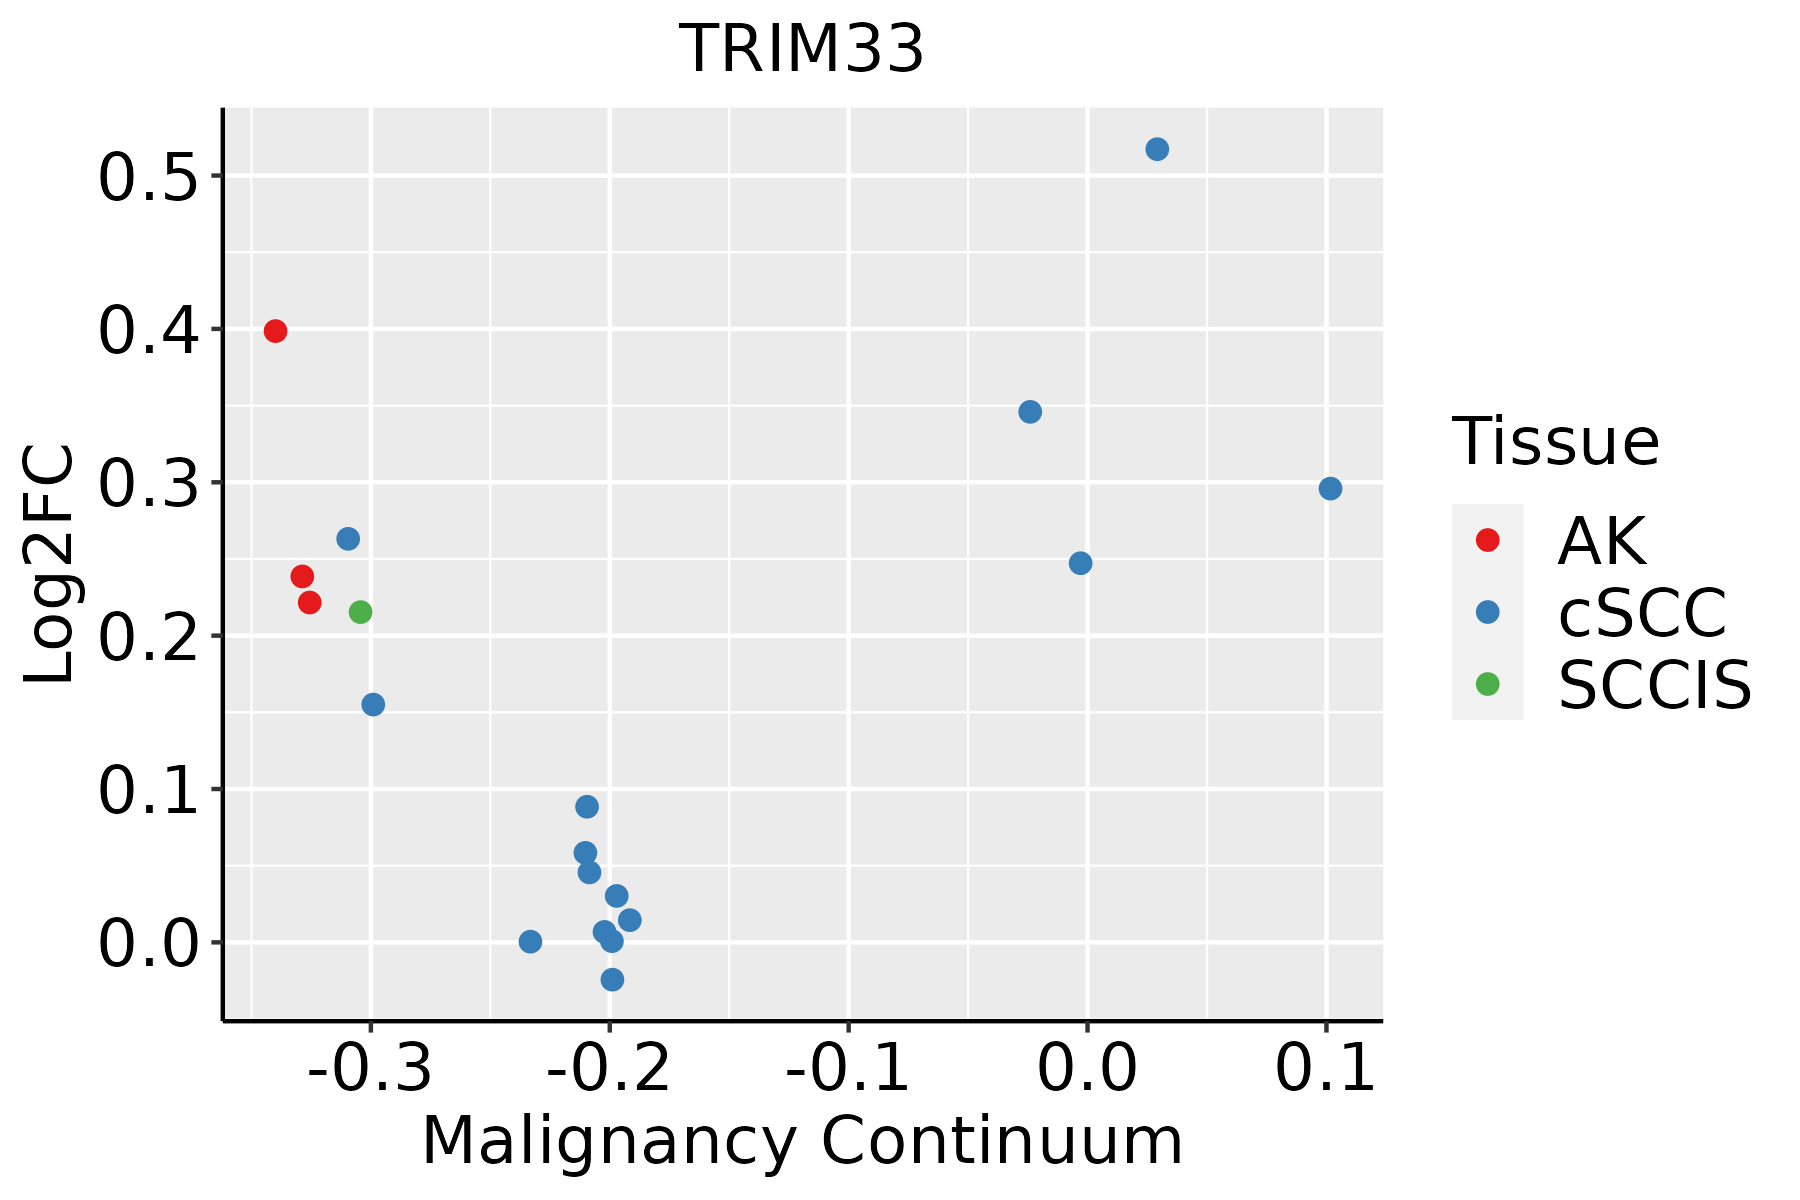
AK: Actinic keratosis
cSCC: Cutaneous squamous cell carcinoma
SCCIS:squamous cell carcinoma in situ
ThyroidThe image shows the transcriptomic changes along malignancy continuum.log2FC in expression of this searched gene in stem-like cells from each diseased tissue sample relative to stem-like cells in normal samples in each tissue plotted against the malignancy continuum. Samples are colored based on if they are from different disease stage.
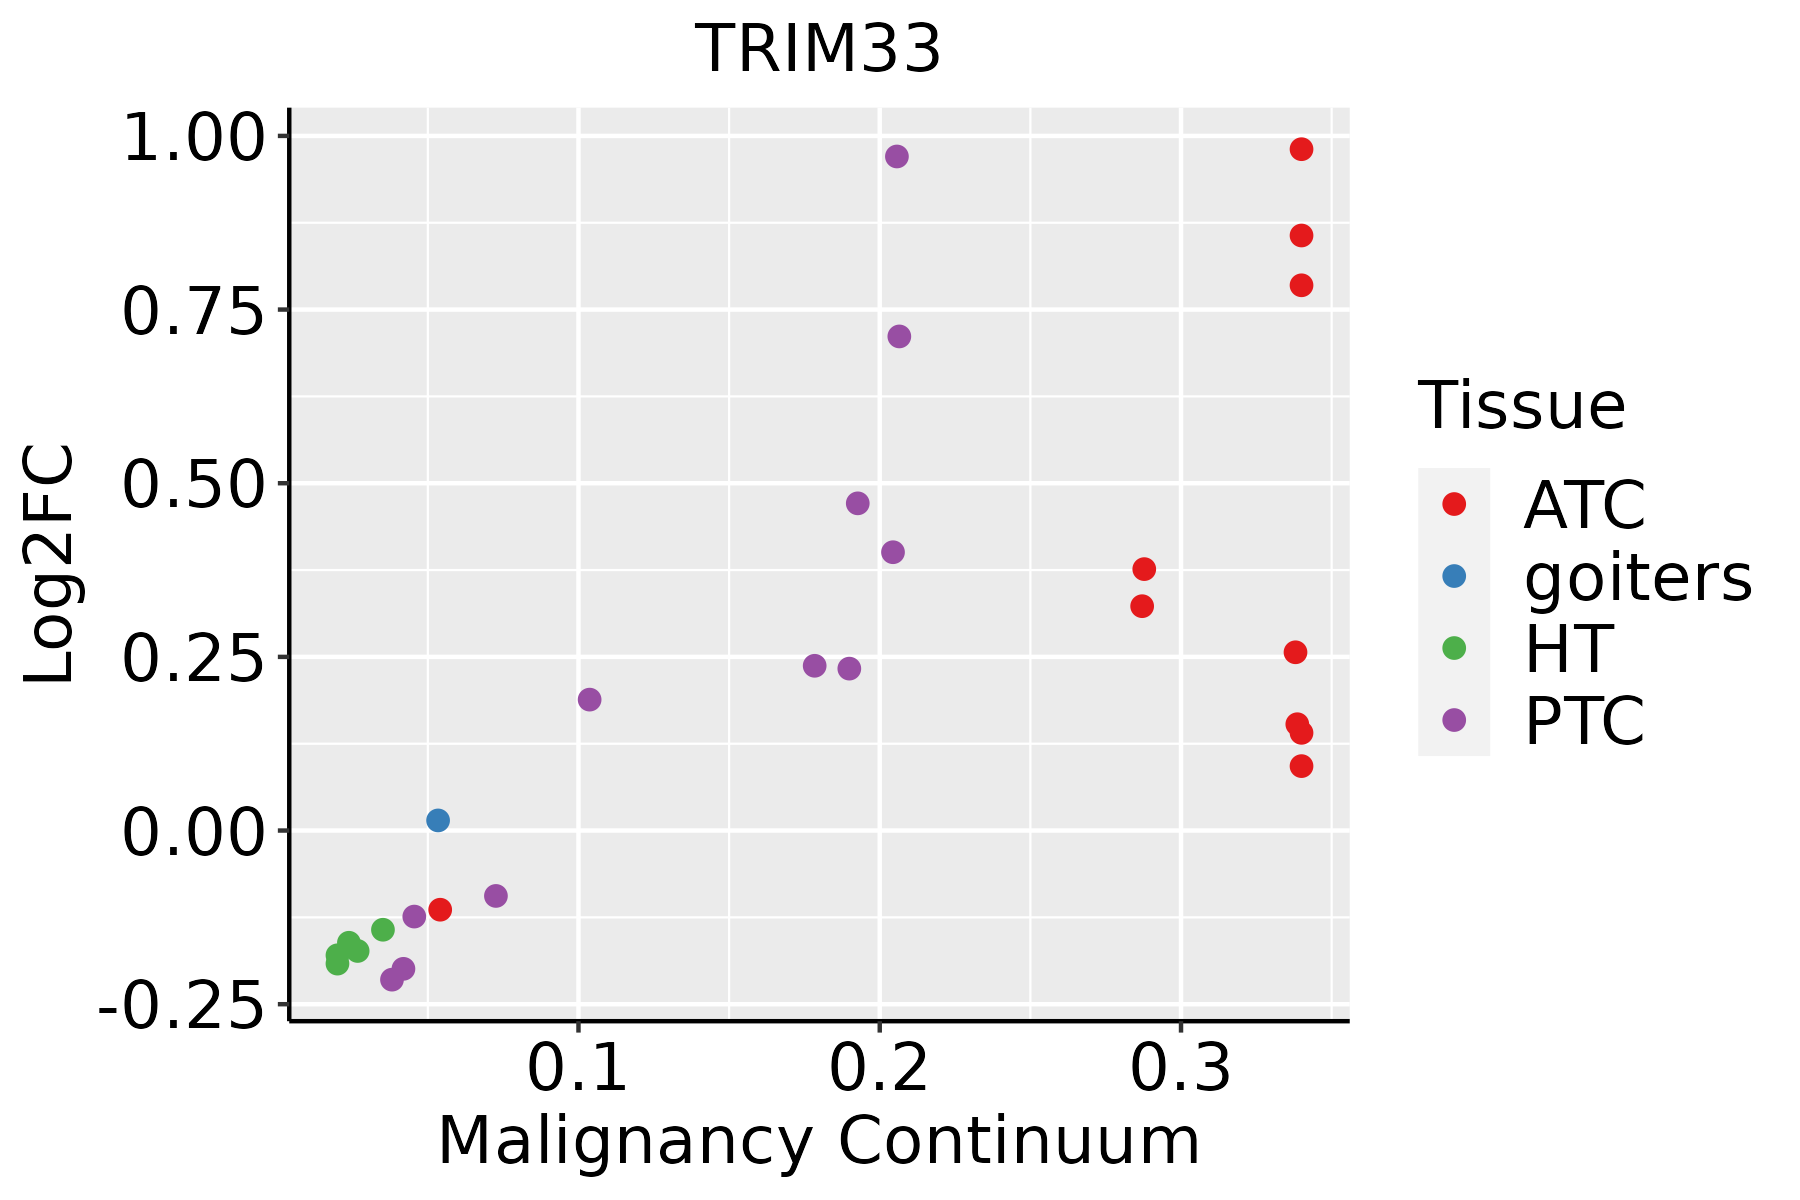
ATC: Anaplastic thyroid cancer
HT: Hashimoto's thyroiditis
PTC: Papillary thyroid cancer
∗log2FC in expression of this searched gene in stem-like cells from each diseased tissue sample relative to stem-like cells in normal samples in each tissue plotted against the malignancy continuum. Samples are colored based on if they are from different disease stage.

Top

Malignant transformation related pathway analysis

check buttonFind out the enriched GO biological processes and KEGG pathways involved in transition from healthy to precancer to cancer
check button Figure of enriched GO biological processes.
TissueDisease StageEnriched GO biological Processes
ColorectumADGO analysis - Figure of enriched GO biological processes: Top 15 enriched GO BP terms are showed in the bar plot of each disease state in each tissue. Each row represents a significant GO biological process which is colored according to the -log10(p.adjust).
ColorectumSERGO analysis - Figure of enriched GO biological processes: Top 15 enriched GO BP terms are showed in the bar plot of each disease state in each tissue. Each row represents a significant GO biological process which is colored according to the -log10(p.adjust).
ColorectumMSSGO analysis - Figure of enriched GO biological processes: Top 15 enriched GO BP terms are showed in the bar plot of each disease state in each tissue. Each row represents a significant GO biological process which is colored according to the -log10(p.adjust).
ColorectumMSI-HGO analysis - Figure of enriched GO biological processes: Top 15 enriched GO BP terms are showed in the bar plot of each disease state in each tissue. Each row represents a significant GO biological process which is colored according to the -log10(p.adjust).
ColorectumFAPGO analysis - Figure of enriched GO biological processes: Top 15 enriched GO BP terms are showed in the bar plot of each disease state in each tissue. Each row represents a significant GO biological process which is colored according to the -log10(p.adjust).
∗Top 15 enriched GO BP terms are showed in the bar plot of each disease state in each tissue. Each row represents a significant GO biological process which is colored according to the -log10(p.adjust).
Page: 1 2 3 4 5 6 7 8 9 

check button Enriched GO biological processes.
GO IDTissueDisease StageDescriptionGene RatioBg Ratiopvaluep.adjustCount
GO:00902873SkinAKregulation of cellular response to growth factor stimulus53/1910304/187237.10e-051.02e-0353
GO:000717817SkinAKtransmembrane receptor protein serine/threonine kinase signaling pathway57/1910355/187233.69e-043.61e-0357
GO:000717910SkinAKtransforming growth factor beta receptor signaling pathway35/1910198/187238.69e-047.17e-0335
GO:00717725SkinAKresponse to BMP30/1910165/187231.24e-039.40e-0330
GO:00717735SkinAKcellular response to BMP stimulus30/1910165/187231.24e-039.40e-0330
GO:00305102SkinAKregulation of BMP signaling pathway20/191096/187231.46e-031.06e-0220
GO:00305094SkinAKBMP signaling pathway27/1910152/187232.97e-031.87e-0227
GO:00170157SkinAKregulation of transforming growth factor beta receptor signaling pathway23/1910128/187235.03e-032.83e-0223
GO:19038448SkinAKregulation of cellular response to transforming growth factor beta stimulus23/1910131/187236.70e-033.54e-0223
GO:007155917SkincSCCresponse to transforming growth factor beta95/4864256/187235.21e-055.31e-0495
GO:007156025SkincSCCcellular response to transforming growth factor beta stimulus92/4864250/187239.65e-058.99e-0492
GO:000717917SkincSCCtransforming growth factor beta receptor signaling pathway69/4864198/187233.39e-031.84e-0269
GO:007155919ThyroidPTCresponse to transforming growth factor beta131/5968256/187239.20e-113.17e-09131
GO:007156019ThyroidPTCcellular response to transforming growth factor beta stimulus126/5968250/187237.34e-102.19e-08126
GO:000717919ThyroidPTCtransforming growth factor beta receptor signaling pathway104/5968198/187231.20e-093.47e-08104
GO:001701515ThyroidPTCregulation of transforming growth factor beta receptor signaling pathway69/5968128/187231.92e-073.51e-0669
GO:190384415ThyroidPTCregulation of cellular response to transforming growth factor beta stimulus70/5968131/187232.47e-074.31e-0670
GO:000717819ThyroidPTCtransmembrane receptor protein serine/threonine kinase signaling pathway156/5968355/187231.02e-061.51e-05156
GO:00900925ThyroidPTCregulation of transmembrane receptor protein serine/threonine kinase signaling pathway108/5968256/187233.07e-042.14e-03108
GO:009028712ThyroidPTCregulation of cellular response to growth factor stimulus120/5968304/187232.87e-031.42e-02120
Page: 1 2 3 4 5 6 7 

check button Enriched KEGG pathways.
Pathway IDTissueDisease StageDescriptionGene RatioBg Ratiopvaluep.adjustqvalueCount
Page: 1 

Top

Cell-cell communication analysis

check buttonIdentification of potential cell-cell interactions between two cell types and their ligand-receptor pairs for different disease states
LigandReceptorLRpairPathwayTissueDisease Stage
Page: 1 

Top

Single-cell gene regulatory network inference analysis

check buttonFind out the significant the regulons (TFs) and the target genes of each regulon across cell types for different disease states
TFCell TypeTissueDisease StageTarget GeneRSSRegulon Activity
∗The dot plots of a searched regulon are shown for all cell subpopulations in each disease state of each tissue based on the regulon specific score inferred using pySCENIC and by calculating the average expression.
Page: 1 

Top

Somatic mutation of malignant transformation related genes

check buttonAnnotation of somatic variants for genes involved in malignant transformation
Hugo SymbolVariant ClassVariant ClassificationdbSNP RSHGVScHGVSpHGVSp ShortSWISSPROTBIOTYPESIFTPolyPhenTumor Sample BarcodeTissueHistologySexAgeStageTherapy TypesDrugsOutcome
TRIM33SNVMissense_Mutationnovelc.2950N>Ap.Glu984Lysp.E984KQ9UPN9protein_codingtolerated(0.19)benign(0.049)TCGA-5L-AAT1-01Breastbreast invasive carcinomaFemale<65III/IVHormone TherapyletrozolSD
TRIM33SNVMissense_Mutationnovelc.2134N>Ap.Gln712Lysp.Q712KQ9UPN9protein_codingtolerated(1)benign(0.191)TCGA-AN-A03Y-01Breastbreast invasive carcinomaFemale>=65I/IIUnknownUnknownSD
TRIM33SNVMissense_Mutationc.2923N>Cp.Cys975Argp.C975RQ9UPN9protein_codingdeleterious(0)probably_damaging(0.999)TCGA-AR-A255-01Breastbreast invasive carcinomaFemale<65I/IITargeted Molecular therapytrastuzumabSD
TRIM33SNVMissense_Mutationnovelc.3162N>Gp.Ile1054Metp.I1054MQ9UPN9protein_codingtolerated(0.05)possibly_damaging(0.674)TCGA-BH-A0DI-01Breastbreast invasive carcinomaFemale<65I/IIChemotherapyadriamycinCR
TRIM33insertionNonsense_Mutationnovelc.1321_1322insCAGAAAGAGCTTTTTAAAATAp.His441delinsProGluArgAlaPheTerAsnAsnp.H441delinsPERAF*NNQ9UPN9protein_codingTCGA-A8-A0A4-01Breastbreast invasive carcinomaFemale>=65I/IIHormone TherapytamoxiphenCR
TRIM33SNVMissense_Mutationnovelc.3079N>Ap.Asp1027Asnp.D1027NQ9UPN9protein_codingdeleterious(0.02)probably_damaging(0.998)TCGA-C5-A7X5-01Cervixcervical & endocervical cancerFemale>=65I/IIChemotherapycarboplatinPD
TRIM33SNVMissense_Mutationc.3363G>Cp.Glu1121Aspp.E1121DQ9UPN9protein_codingtolerated(0.31)benign(0.007)TCGA-EK-A2PG-01Cervixcervical & endocervical cancerFemale>=65I/IIUnknownUnknownSD
TRIM33SNVMissense_Mutationnovelc.3301N>Ap.Val1101Ilep.V1101IQ9UPN9protein_codingtolerated(0.45)benign(0)TCGA-5M-AAT6-01Colorectumcolon adenocarcinomaFemale<65III/IVUnknownUnknownPD
TRIM33SNVMissense_Mutationc.1154A>Tp.Glu385Valp.E385VQ9UPN9protein_codingdeleterious(0)possibly_damaging(0.874)TCGA-A6-2686-01Colorectumcolon adenocarcinomaFemale>=65I/IIUnknownUnknownSD
TRIM33SNVMissense_Mutationnovelc.2045N>Cp.Asp682Alap.D682AQ9UPN9protein_codingdeleterious(0)possibly_damaging(0.837)TCGA-A6-6141-01Colorectumcolon adenocarcinomaMale<65I/IIChemotherapy5-fuSD
Page: 1 2 3 4 5 6 7 8 9 10 

Top

Related drugs of malignant transformation related genes

check buttonIdentification of chemicals and drugs interact with genes involved in malignant transfromation
(DGIdb 4.0)
Entrez IDSymbolCategoryInteraction TypesDrug Claim NameDrug NamePMIDs
Page: 1