
|
|||||
|
 | |
| |
| |
| |
| |
| |
|
Gene: TRADD |
Gene summary for TRADD |
| Gene information | Species | Human | Gene symbol | TRADD | Gene ID | 8717 |
| Gene name | TNFRSF1A associated via death domain | |
| Gene Alias | Hs.89862 | |
| Cytomap | 16q22.1 | |
| Gene Type | protein-coding | GO ID | GO:0001942 | UniProtAcc | Q15628 |
Top |
Malignant transformation analysis |
| Identification of the aberrant gene expression in precancerous and cancerous lesions by comparing the gene expression of stem-like cells in diseased tissues with normal stem cells |
| Entrez ID | Symbol | Replicates | Species | Organ | Tissue | Adj P-value | Log2FC | Malignancy |
| 8717 | TRADD | LZE4T | Human | Esophagus | ESCC | 1.88e-12 | 2.83e-01 | 0.0811 |
| 8717 | TRADD | LZE20T | Human | Esophagus | ESCC | 1.66e-02 | 1.36e-01 | 0.0662 |
| 8717 | TRADD | LZE22D1 | Human | Esophagus | HGIN | 4.22e-08 | 3.96e-01 | 0.0595 |
| 8717 | TRADD | LZE22T | Human | Esophagus | ESCC | 5.25e-04 | 4.53e-01 | 0.068 |
| 8717 | TRADD | LZE24T | Human | Esophagus | ESCC | 4.64e-22 | 8.11e-01 | 0.0596 |
| 8717 | TRADD | LZE21T | Human | Esophagus | ESCC | 2.89e-03 | 4.67e-01 | 0.0655 |
| 8717 | TRADD | P1T-E | Human | Esophagus | ESCC | 1.74e-19 | 7.77e-01 | 0.0875 |
| 8717 | TRADD | P2T-E | Human | Esophagus | ESCC | 8.39e-10 | 2.17e-01 | 0.1177 |
| 8717 | TRADD | P4T-E | Human | Esophagus | ESCC | 3.74e-21 | 4.98e-01 | 0.1323 |
| 8717 | TRADD | P5T-E | Human | Esophagus | ESCC | 1.97e-17 | 3.15e-01 | 0.1327 |
| 8717 | TRADD | P8T-E | Human | Esophagus | ESCC | 1.97e-30 | 4.48e-01 | 0.0889 |
| 8717 | TRADD | P9T-E | Human | Esophagus | ESCC | 1.14e-14 | 4.01e-01 | 0.1131 |
| 8717 | TRADD | P10T-E | Human | Esophagus | ESCC | 4.41e-17 | 2.18e-01 | 0.116 |
| 8717 | TRADD | P11T-E | Human | Esophagus | ESCC | 7.63e-22 | 7.75e-01 | 0.1426 |
| 8717 | TRADD | P12T-E | Human | Esophagus | ESCC | 4.17e-17 | 1.96e-01 | 0.1122 |
| 8717 | TRADD | P15T-E | Human | Esophagus | ESCC | 1.31e-15 | 3.54e-01 | 0.1149 |
| 8717 | TRADD | P16T-E | Human | Esophagus | ESCC | 3.77e-18 | 6.48e-02 | 0.1153 |
| 8717 | TRADD | P17T-E | Human | Esophagus | ESCC | 2.44e-15 | 7.19e-01 | 0.1278 |
| 8717 | TRADD | P19T-E | Human | Esophagus | ESCC | 6.31e-07 | 9.19e-01 | 0.1662 |
| 8717 | TRADD | P20T-E | Human | Esophagus | ESCC | 1.93e-34 | 6.74e-01 | 0.1124 |
| Page: 1 2 3 4 5 6 7 |
| Tissue | Expression Dynamics | Abbreviation |
| Esophagus | 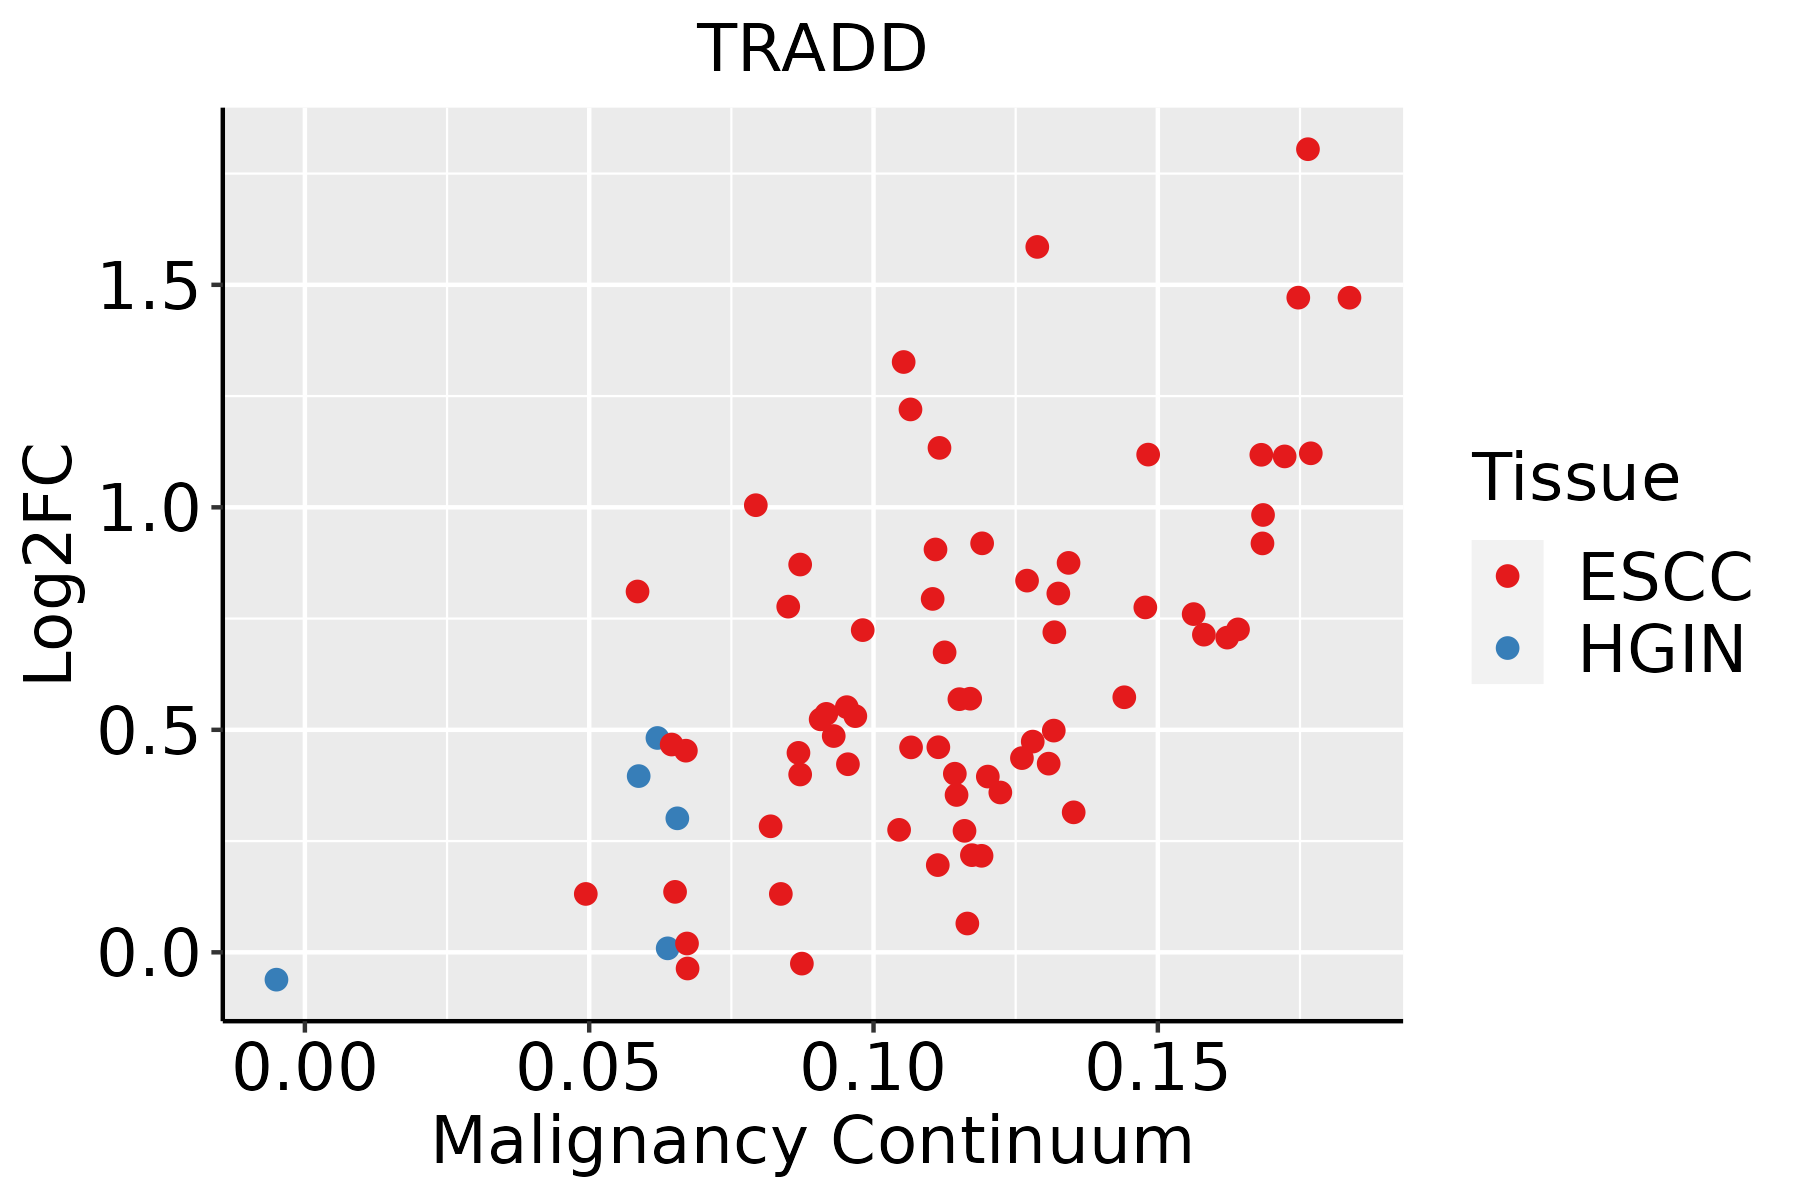 | ESCC: Esophageal squamous cell carcinoma |
| HGIN: High-grade intraepithelial neoplasias | ||
| LGIN: Low-grade intraepithelial neoplasias | ||
| Liver | 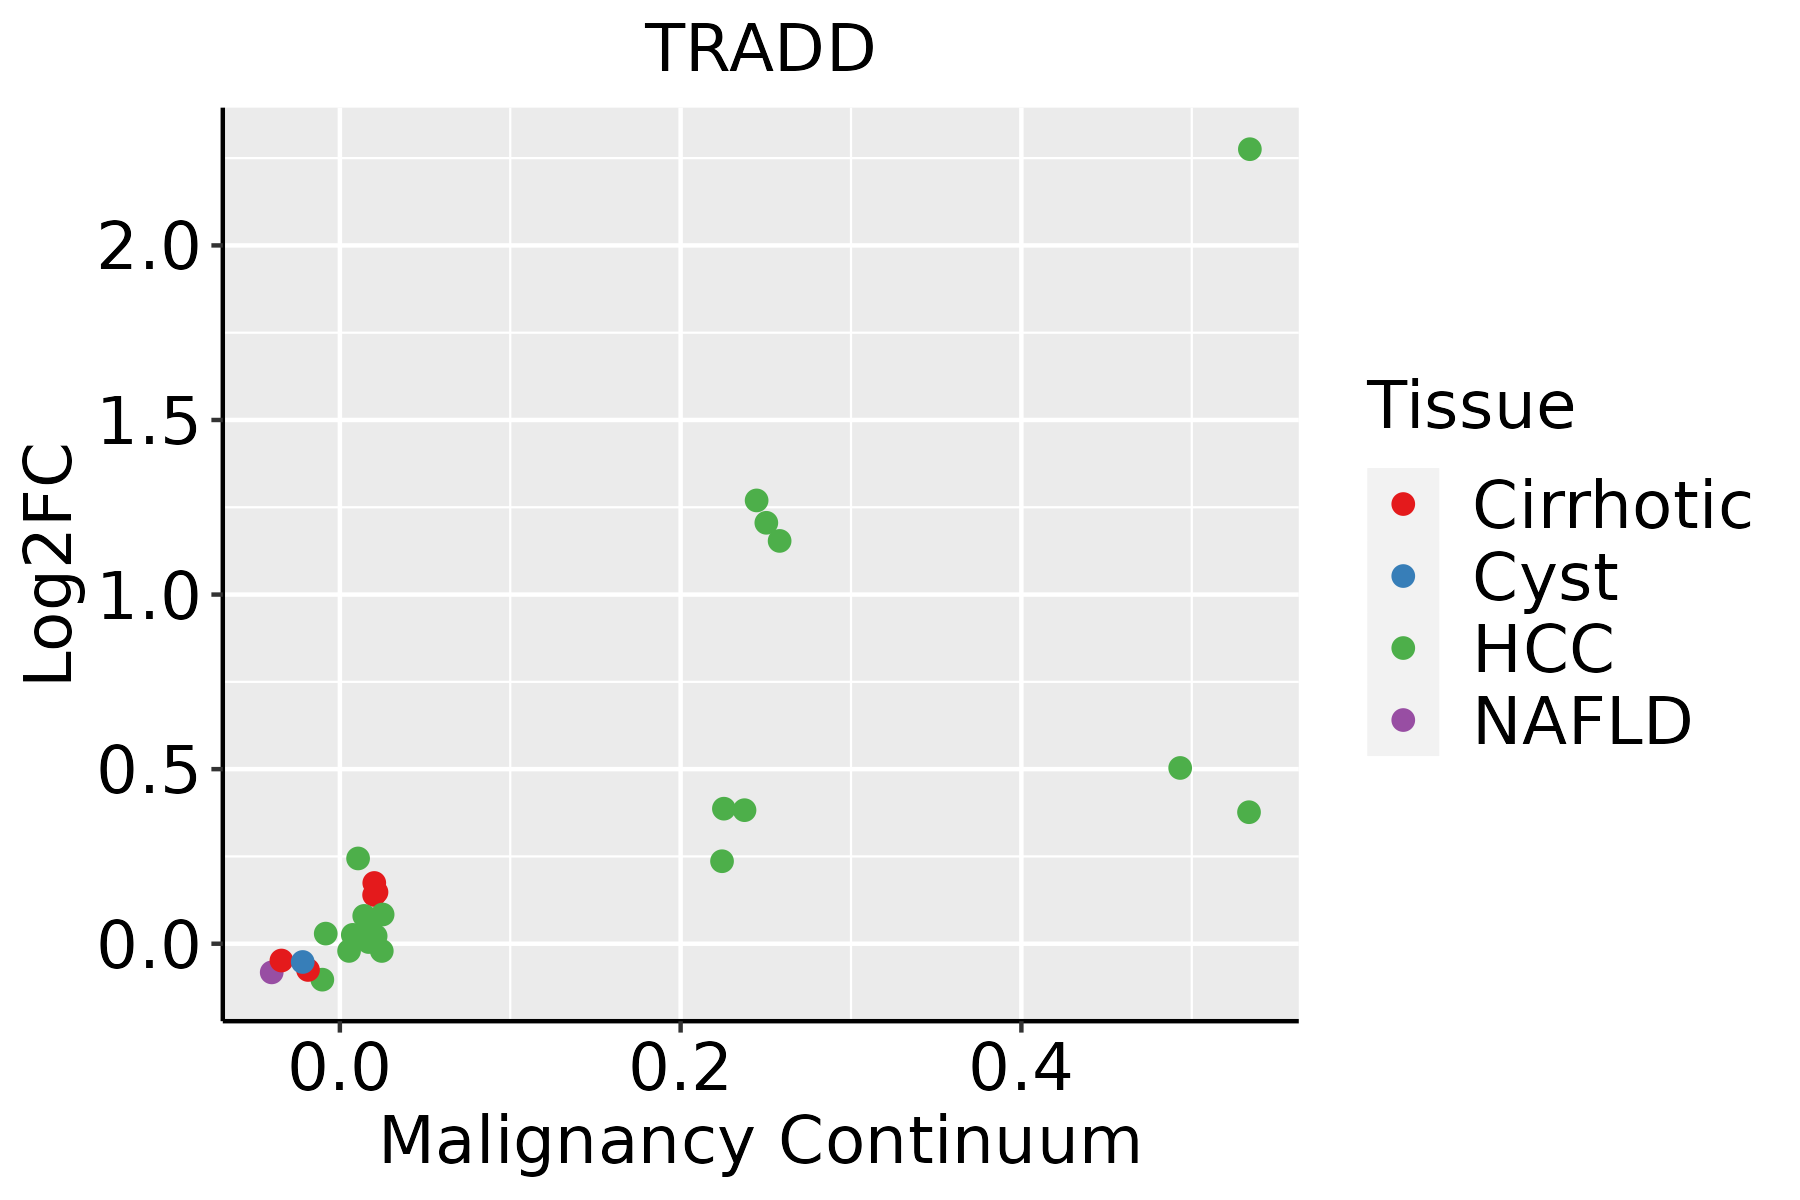 | HCC: Hepatocellular carcinoma |
| NAFLD: Non-alcoholic fatty liver disease | ||
| Oral Cavity |  | EOLP: Erosive Oral lichen planus |
| LP: leukoplakia | ||
| NEOLP: Non-erosive oral lichen planus | ||
| OSCC: Oral squamous cell carcinoma | ||
| Skin | 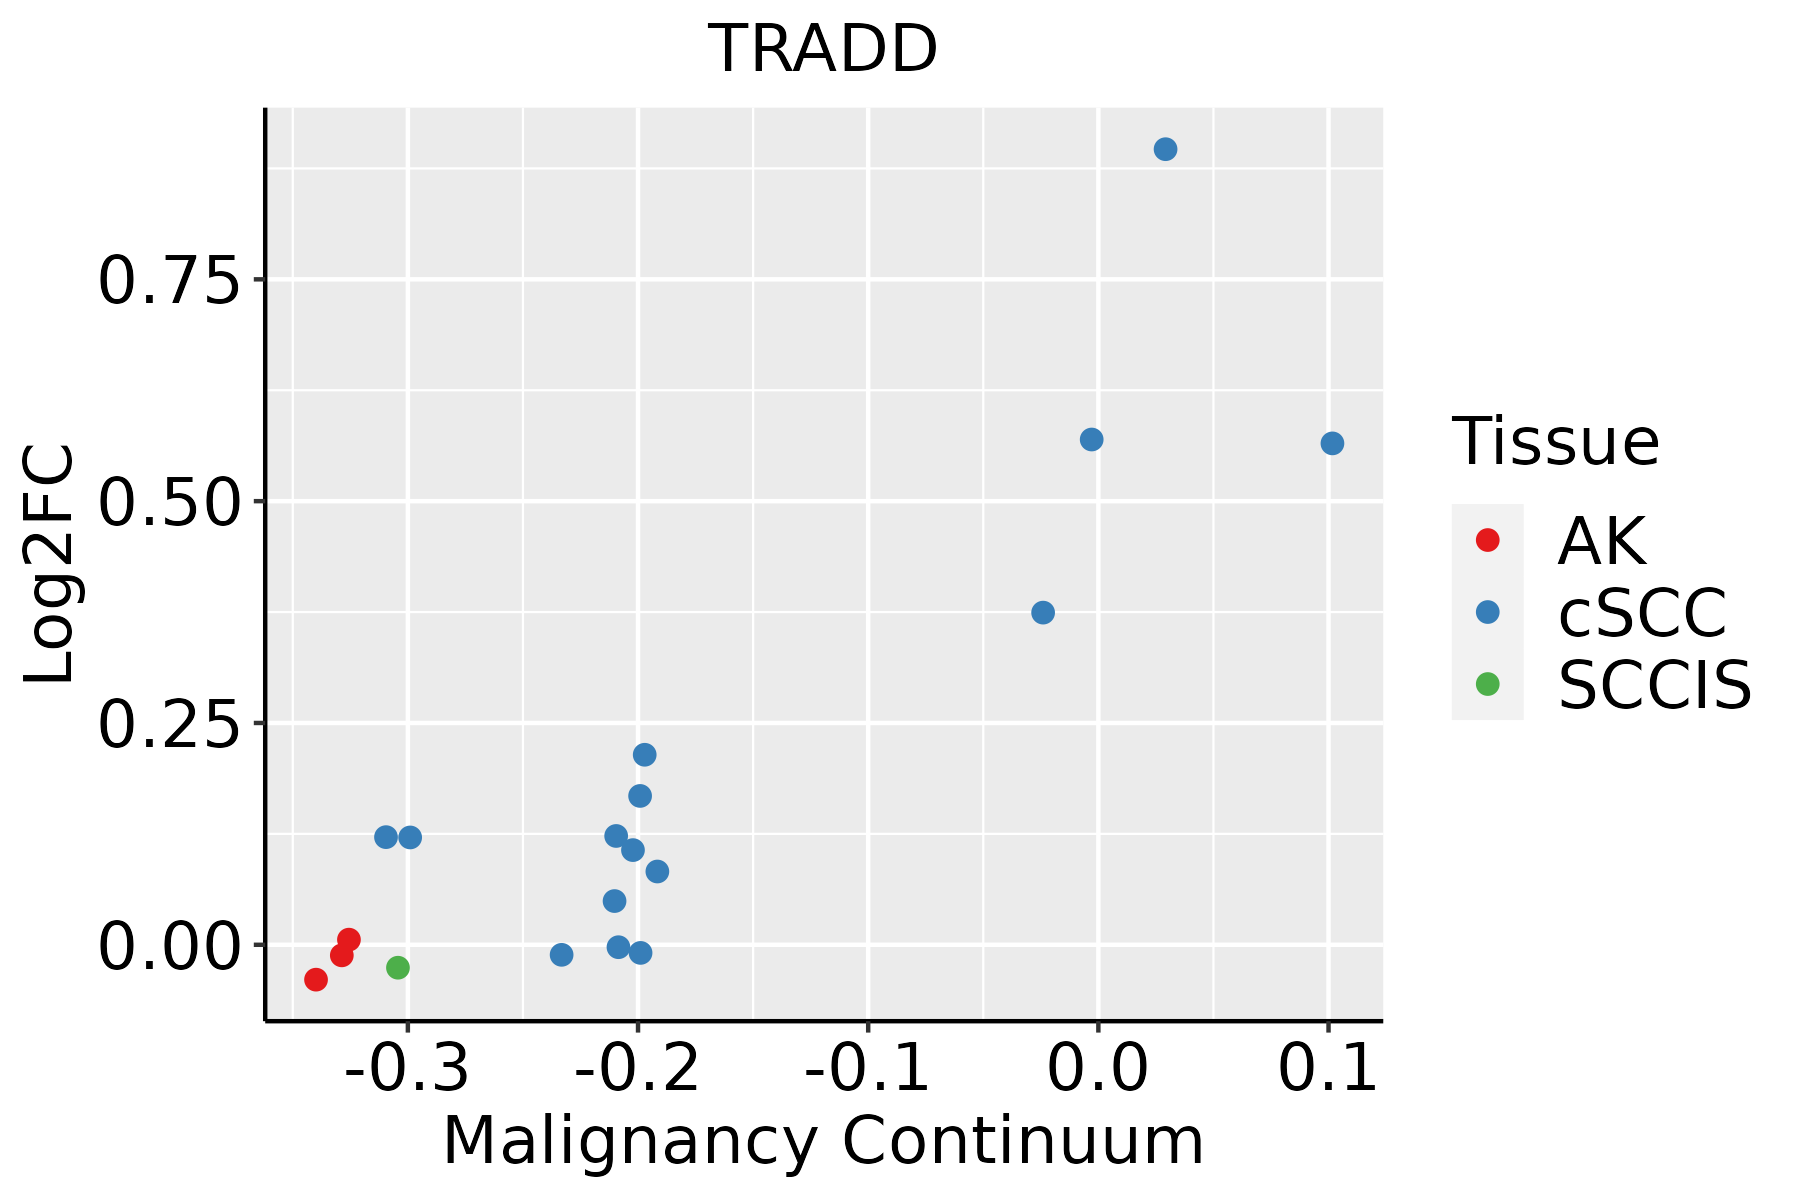 | AK: Actinic keratosis |
| cSCC: Cutaneous squamous cell carcinoma | ||
| SCCIS:squamous cell carcinoma in situ | ||
| Thyroid |  | ATC: Anaplastic thyroid cancer |
| HT: Hashimoto's thyroiditis | ||
| PTC: Papillary thyroid cancer |
| ∗log2FC in expression of this searched gene in stem-like cells from each diseased tissue sample relative to stem-like cells in normal samples in each tissue plotted against the malignancy continuum. Samples are colored based on if they are from different disease stage. |
Top |
Malignant transformation related pathway analysis |
| Find out the enriched GO biological processes and KEGG pathways involved in transition from healthy to precancer to cancer |
| Tissue | Disease Stage | Enriched GO biological Processes |
| Colorectum | AD |  |
| Colorectum | SER |  |
| Colorectum | MSS |  |
| Colorectum | MSI-H |  |
| Colorectum | FAP |  |
| ∗Top 15 enriched GO BP terms are showed in the bar plot of each disease state in each tissue. Each row represents a significant GO biological process which is colored according to the -log10(p.adjust). |
| Page: 1 2 3 4 5 6 7 8 9 |
| GO ID | Tissue | Disease Stage | Description | Gene Ratio | Bg Ratio | pvalue | p.adjust | Count |
| GO:19012248 | Skin | cSCC | positive regulation of NIK/NF-kappaB signaling | 30/4864 | 69/18723 | 1.19e-03 | 7.75e-03 | 30 |
| GO:003320915 | Skin | cSCC | tumor necrosis factor-mediated signaling pathway | 39/4864 | 99/18723 | 2.33e-03 | 1.36e-02 | 39 |
| GO:007135625 | Skin | cSCC | cellular response to tumor necrosis factor | 79/4864 | 229/18723 | 2.48e-03 | 1.42e-02 | 79 |
| GO:005109214 | Skin | cSCC | positive regulation of NF-kappaB transcription factor activity | 55/4864 | 152/18723 | 3.40e-03 | 1.84e-02 | 55 |
| GO:00380616 | Skin | cSCC | NIK/NF-kappaB signaling | 52/4864 | 143/18723 | 3.83e-03 | 2.05e-02 | 52 |
| GO:19012225 | Skin | cSCC | regulation of NIK/NF-kappaB signaling | 42/4864 | 112/18723 | 4.71e-03 | 2.40e-02 | 42 |
| GO:0097191113 | Thyroid | PTC | extrinsic apoptotic signaling pathway | 117/5968 | 219/18723 | 2.73e-11 | 1.03e-09 | 117 |
| GO:004312226 | Thyroid | PTC | regulation of I-kappaB kinase/NF-kappaB signaling | 118/5968 | 249/18723 | 2.04e-07 | 3.63e-06 | 118 |
| GO:000724926 | Thyroid | PTC | I-kappaB kinase/NF-kappaB signaling | 130/5968 | 281/18723 | 2.78e-07 | 4.80e-06 | 130 |
| GO:004312320 | Thyroid | PTC | positive regulation of I-kappaB kinase/NF-kappaB signaling | 91/5968 | 186/18723 | 8.76e-07 | 1.33e-05 | 91 |
| GO:000862523 | Thyroid | PTC | extrinsic apoptotic signaling pathway via death domain receptors | 47/5968 | 82/18723 | 1.70e-06 | 2.38e-05 | 47 |
| GO:005109016 | Thyroid | PTC | regulation of DNA-binding transcription factor activity | 178/5968 | 440/18723 | 7.63e-05 | 6.54e-04 | 178 |
| GO:0034612111 | Thyroid | PTC | response to tumor necrosis factor | 109/5968 | 253/18723 | 1.08e-04 | 8.69e-04 | 109 |
| GO:190122415 | Thyroid | PTC | positive regulation of NIK/NF-kappaB signaling | 37/5968 | 69/18723 | 1.46e-04 | 1.13e-03 | 37 |
| GO:0071356111 | Thyroid | PTC | cellular response to tumor necrosis factor | 96/5968 | 229/18723 | 8.24e-04 | 5.10e-03 | 96 |
| GO:003210316 | Thyroid | PTC | positive regulation of response to external stimulus | 167/5968 | 427/18723 | 8.31e-04 | 5.13e-03 | 167 |
| GO:005109115 | Thyroid | PTC | positive regulation of DNA-binding transcription factor activity | 107/5968 | 260/18723 | 9.44e-04 | 5.70e-03 | 107 |
| GO:003806113 | Thyroid | PTC | NIK/NF-kappaB signaling | 63/5968 | 143/18723 | 1.45e-03 | 8.12e-03 | 63 |
| GO:190122213 | Thyroid | PTC | regulation of NIK/NF-kappaB signaling | 49/5968 | 112/18723 | 5.42e-03 | 2.49e-02 | 49 |
| GO:003320916 | Thyroid | PTC | tumor necrosis factor-mediated signaling pathway | 44/5968 | 99/18723 | 5.77e-03 | 2.60e-02 | 44 |
| Page: 1 2 3 4 5 6 7 |
| Pathway ID | Tissue | Disease Stage | Description | Gene Ratio | Bg Ratio | pvalue | p.adjust | qvalue | Count |
| hsa0513139 | Esophagus | HGIN | Shigellosis | 71/1383 | 247/8465 | 4.89e-07 | 7.98e-06 | 6.34e-06 | 71 |
| hsa0513239 | Esophagus | HGIN | Salmonella infection | 69/1383 | 249/8465 | 3.02e-06 | 4.47e-05 | 3.55e-05 | 69 |
| hsa0513039 | Esophagus | HGIN | Pathogenic Escherichia coli infection | 54/1383 | 197/8465 | 4.91e-05 | 6.15e-04 | 4.89e-04 | 54 |
| hsa0516730 | Esophagus | HGIN | Kaposi sarcoma-associated herpesvirus infection | 51/1383 | 194/8465 | 2.46e-04 | 2.69e-03 | 2.14e-03 | 51 |
| hsa052039 | Esophagus | HGIN | Viral carcinogenesis | 53/1383 | 204/8465 | 2.58e-04 | 2.71e-03 | 2.15e-03 | 53 |
| hsa0516420 | Esophagus | HGIN | Influenza A | 42/1383 | 171/8465 | 3.41e-03 | 2.54e-02 | 2.02e-02 | 42 |
| hsa0516330 | Esophagus | HGIN | Human cytomegalovirus infection | 51/1383 | 225/8465 | 7.67e-03 | 4.63e-02 | 3.68e-02 | 51 |
| hsa05131114 | Esophagus | HGIN | Shigellosis | 71/1383 | 247/8465 | 4.89e-07 | 7.98e-06 | 6.34e-06 | 71 |
| hsa05132115 | Esophagus | HGIN | Salmonella infection | 69/1383 | 249/8465 | 3.02e-06 | 4.47e-05 | 3.55e-05 | 69 |
| hsa05130115 | Esophagus | HGIN | Pathogenic Escherichia coli infection | 54/1383 | 197/8465 | 4.91e-05 | 6.15e-04 | 4.89e-04 | 54 |
| hsa05167114 | Esophagus | HGIN | Kaposi sarcoma-associated herpesvirus infection | 51/1383 | 194/8465 | 2.46e-04 | 2.69e-03 | 2.14e-03 | 51 |
| hsa0520315 | Esophagus | HGIN | Viral carcinogenesis | 53/1383 | 204/8465 | 2.58e-04 | 2.71e-03 | 2.15e-03 | 53 |
| hsa05164110 | Esophagus | HGIN | Influenza A | 42/1383 | 171/8465 | 3.41e-03 | 2.54e-02 | 2.02e-02 | 42 |
| hsa05163113 | Esophagus | HGIN | Human cytomegalovirus infection | 51/1383 | 225/8465 | 7.67e-03 | 4.63e-02 | 3.68e-02 | 51 |
| hsa05132211 | Esophagus | ESCC | Salmonella infection | 191/4205 | 249/8465 | 6.51e-19 | 5.45e-17 | 2.79e-17 | 191 |
| hsa05169210 | Esophagus | ESCC | Epstein-Barr virus infection | 151/4205 | 202/8465 | 1.55e-13 | 3.45e-12 | 1.77e-12 | 151 |
| hsa05131211 | Esophagus | ESCC | Shigellosis | 176/4205 | 247/8465 | 2.27e-12 | 4.01e-11 | 2.05e-11 | 176 |
| hsa05130211 | Esophagus | ESCC | Pathogenic Escherichia coli infection | 142/4205 | 197/8465 | 8.21e-11 | 1.06e-09 | 5.42e-10 | 142 |
| hsa0466810 | Esophagus | ESCC | TNF signaling pathway | 89/4205 | 114/8465 | 3.36e-10 | 4.01e-09 | 2.06e-09 | 89 |
| hsa0421027 | Esophagus | ESCC | Apoptosis | 102/4205 | 136/8465 | 1.05e-09 | 1.21e-08 | 6.21e-09 | 102 |
| Page: 1 2 3 4 5 6 7 8 9 10 |
Top |
Cell-cell communication analysis |
| Identification of potential cell-cell interactions between two cell types and their ligand-receptor pairs for different disease states |
| Ligand | Receptor | LRpair | Pathway | Tissue | Disease Stage |
| Page: 1 |
Top |
Single-cell gene regulatory network inference analysis |
| Find out the significant the regulons (TFs) and the target genes of each regulon across cell types for different disease states |
| TF | Cell Type | Tissue | Disease Stage | Target Gene | RSS | Regulon Activity |
| ∗The dot plots of a searched regulon are shown for all cell subpopulations in each disease state of each tissue based on the regulon specific score inferred using pySCENIC and by calculating the average expression. |
| Page: 1 |
Top |
Somatic mutation of malignant transformation related genes |
| Annotation of somatic variants for genes involved in malignant transformation |
| Hugo Symbol | Variant Class | Variant Classification | dbSNP RS | HGVSc | HGVSp | HGVSp Short | SWISSPROT | BIOTYPE | SIFT | PolyPhen | Tumor Sample Barcode | Tissue | Histology | Sex | Age | Stage | Therapy Types | Drugs | Outcome |
| TRADD | SNV | Missense_Mutation | c.98N>T | p.Ala33Val | p.A33V | Q15628 | protein_coding | tolerated(0.2) | benign(0) | TCGA-BH-A0C1-01 | Breast | breast invasive carcinoma | Female | <65 | III/IV | Chemotherapy | adriamycin | PD | |
| TRADD | SNV | Missense_Mutation | novel | c.530N>T | p.Ser177Leu | p.S177L | Q15628 | protein_coding | tolerated(0.37) | benign(0) | TCGA-MU-A51Y-01 | Cervix | cervical & endocervical cancer | Female | <65 | I/II | Unknown | Unknown | SD |
| TRADD | SNV | Missense_Mutation | c.667G>A | p.Ala223Thr | p.A223T | Q15628 | protein_coding | deleterious(0) | probably_damaging(0.967) | TCGA-AZ-6601-01 | Colorectum | colon adenocarcinoma | Male | >=65 | I/II | Unknown | Unknown | PD | |
| TRADD | SNV | Missense_Mutation | c.934G>A | p.Ala312Thr | p.A312T | Q15628 | protein_coding | deleterious_low_confidence(0.01) | benign(0.06) | TCGA-G4-6628-01 | Colorectum | colon adenocarcinoma | Male | >=65 | I/II | Unknown | Unknown | SD | |
| TRADD | SNV | Missense_Mutation | novel | c.900N>A | p.Asp300Glu | p.D300E | Q15628 | protein_coding | tolerated(0.7) | benign(0.018) | TCGA-AJ-A23O-01 | Endometrium | uterine corpus endometrioid carcinoma | Female | >=65 | I/II | Unknown | Unknown | SD |
| TRADD | SNV | Missense_Mutation | novel | c.811C>T | p.Arg271Cys | p.R271C | Q15628 | protein_coding | deleterious(0) | probably_damaging(0.963) | TCGA-AJ-A3BG-01 | Endometrium | uterine corpus endometrioid carcinoma | Female | >=65 | I/II | Chemotherapy | carboplatin | PD |
| TRADD | SNV | Missense_Mutation | novel | c.468N>T | p.Glu156Asp | p.E156D | Q15628 | protein_coding | tolerated(0.09) | benign(0.017) | TCGA-AX-A2HC-01 | Endometrium | uterine corpus endometrioid carcinoma | Female | <65 | III/IV | Chemotherapy | paclitaxel | PD |
| TRADD | SNV | Missense_Mutation | c.877G>A | p.Glu293Lys | p.E293K | Q15628 | protein_coding | tolerated(0.54) | benign(0.097) | TCGA-EO-A22X-01 | Endometrium | uterine corpus endometrioid carcinoma | Female | <65 | III/IV | Unspecific | Carboplatin | Complete Response | |
| TRADD | SNV | Missense_Mutation | novel | c.5C>T | p.Ala2Val | p.A2V | Q15628 | protein_coding | deleterious_low_confidence(0) | probably_damaging(0.946) | TCGA-EO-A3AU-01 | Endometrium | uterine corpus endometrioid carcinoma | Female | >=65 | I/II | Unknown | Unknown | PD |
| TRADD | SNV | Missense_Mutation | novel | c.479N>A | p.Arg160Gln | p.R160Q | Q15628 | protein_coding | tolerated(0.6) | benign(0.006) | TCGA-FI-A2D0-01 | Endometrium | uterine corpus endometrioid carcinoma | Female | <65 | I/II | Unknown | Unknown | SD |
| Page: 1 2 |
Top |
Related drugs of malignant transformation related genes |
| Identification of chemicals and drugs interact with genes involved in malignant transfromation |
| (DGIdb 4.0) |
| Entrez ID | Symbol | Category | Interaction Types | Drug Claim Name | Drug Name | PMIDs |
| Page: 1 |

Copyright 2023-Present -The University of Texas Health Science Center at Houston |