
|
|||||
|
 | |
| |
| |
| |
| |
| |
|
Gene: TPCN1 |
Gene summary for TPCN1 |
| Gene information | Species | Human | Gene symbol | TPCN1 | Gene ID | 53373 |
| Gene name | two pore segment channel 1 | |
| Gene Alias | TPC1 | |
| Cytomap | 12q24.13 | |
| Gene Type | protein-coding | GO ID | GO:0006810 | UniProtAcc | B3KSG7 |
Top |
Malignant transformation analysis |
| Identification of the aberrant gene expression in precancerous and cancerous lesions by comparing the gene expression of stem-like cells in diseased tissues with normal stem cells |
| Entrez ID | Symbol | Replicates | Species | Organ | Tissue | Adj P-value | Log2FC | Malignancy |
| 53373 | TPCN1 | HTA11_347_2000001011 | Human | Colorectum | AD | 1.37e-16 | 6.46e-01 | -0.1954 |
| 53373 | TPCN1 | HTA11_411_2000001011 | Human | Colorectum | SER | 2.76e-05 | 9.11e-01 | -0.2602 |
| 53373 | TPCN1 | HTA11_83_2000001011 | Human | Colorectum | SER | 2.84e-04 | 4.90e-01 | -0.1526 |
| 53373 | TPCN1 | HTA11_696_2000001011 | Human | Colorectum | AD | 1.66e-04 | 4.89e-01 | -0.1464 |
| 53373 | TPCN1 | HTA11_866_2000001011 | Human | Colorectum | AD | 6.52e-05 | 4.04e-01 | -0.1001 |
| 53373 | TPCN1 | HTA11_1391_2000001011 | Human | Colorectum | AD | 3.85e-02 | 3.28e-01 | -0.059 |
| 53373 | TPCN1 | A015-C-203 | Human | Colorectum | FAP | 2.93e-15 | -1.52e-01 | -0.1294 |
| 53373 | TPCN1 | A002-C-201 | Human | Colorectum | FAP | 1.45e-04 | -3.63e-02 | 0.0324 |
| 53373 | TPCN1 | A001-C-108 | Human | Colorectum | FAP | 5.16e-05 | -4.05e-02 | -0.0272 |
| 53373 | TPCN1 | A002-C-205 | Human | Colorectum | FAP | 2.77e-11 | -1.53e-01 | -0.1236 |
| 53373 | TPCN1 | A015-C-006 | Human | Colorectum | FAP | 3.36e-08 | -6.91e-02 | -0.0994 |
| 53373 | TPCN1 | A015-C-106 | Human | Colorectum | FAP | 1.44e-03 | -5.86e-02 | -0.0511 |
| 53373 | TPCN1 | A002-C-114 | Human | Colorectum | FAP | 1.72e-09 | -1.46e-01 | -0.1561 |
| 53373 | TPCN1 | A015-C-104 | Human | Colorectum | FAP | 4.22e-16 | -8.42e-02 | -0.1899 |
| 53373 | TPCN1 | A015-C-202 | Human | Colorectum | FAP | 4.58e-04 | 2.93e-01 | -0.0849 |
| 53373 | TPCN1 | A001-C-014 | Human | Colorectum | FAP | 4.68e-06 | -1.46e-01 | 0.0135 |
| 53373 | TPCN1 | A002-C-016 | Human | Colorectum | FAP | 4.44e-11 | -2.57e-01 | 0.0521 |
| 53373 | TPCN1 | A015-C-002 | Human | Colorectum | FAP | 3.35e-05 | -2.25e-01 | -0.0763 |
| 53373 | TPCN1 | A001-C-203 | Human | Colorectum | FAP | 8.40e-03 | -7.99e-03 | -0.0481 |
| 53373 | TPCN1 | A002-C-116 | Human | Colorectum | FAP | 6.82e-21 | -2.65e-01 | -0.0452 |
| Page: 1 2 3 |
| Tissue | Expression Dynamics | Abbreviation |
| Colorectum (GSE201348) |  | FAP: Familial adenomatous polyposis |
| CRC: Colorectal cancer | ||
| Colorectum (HTA11) |  | AD: Adenomas |
| SER: Sessile serrated lesions | ||
| MSI-H: Microsatellite-high colorectal cancer | ||
| MSS: Microsatellite stable colorectal cancer | ||
| Liver | 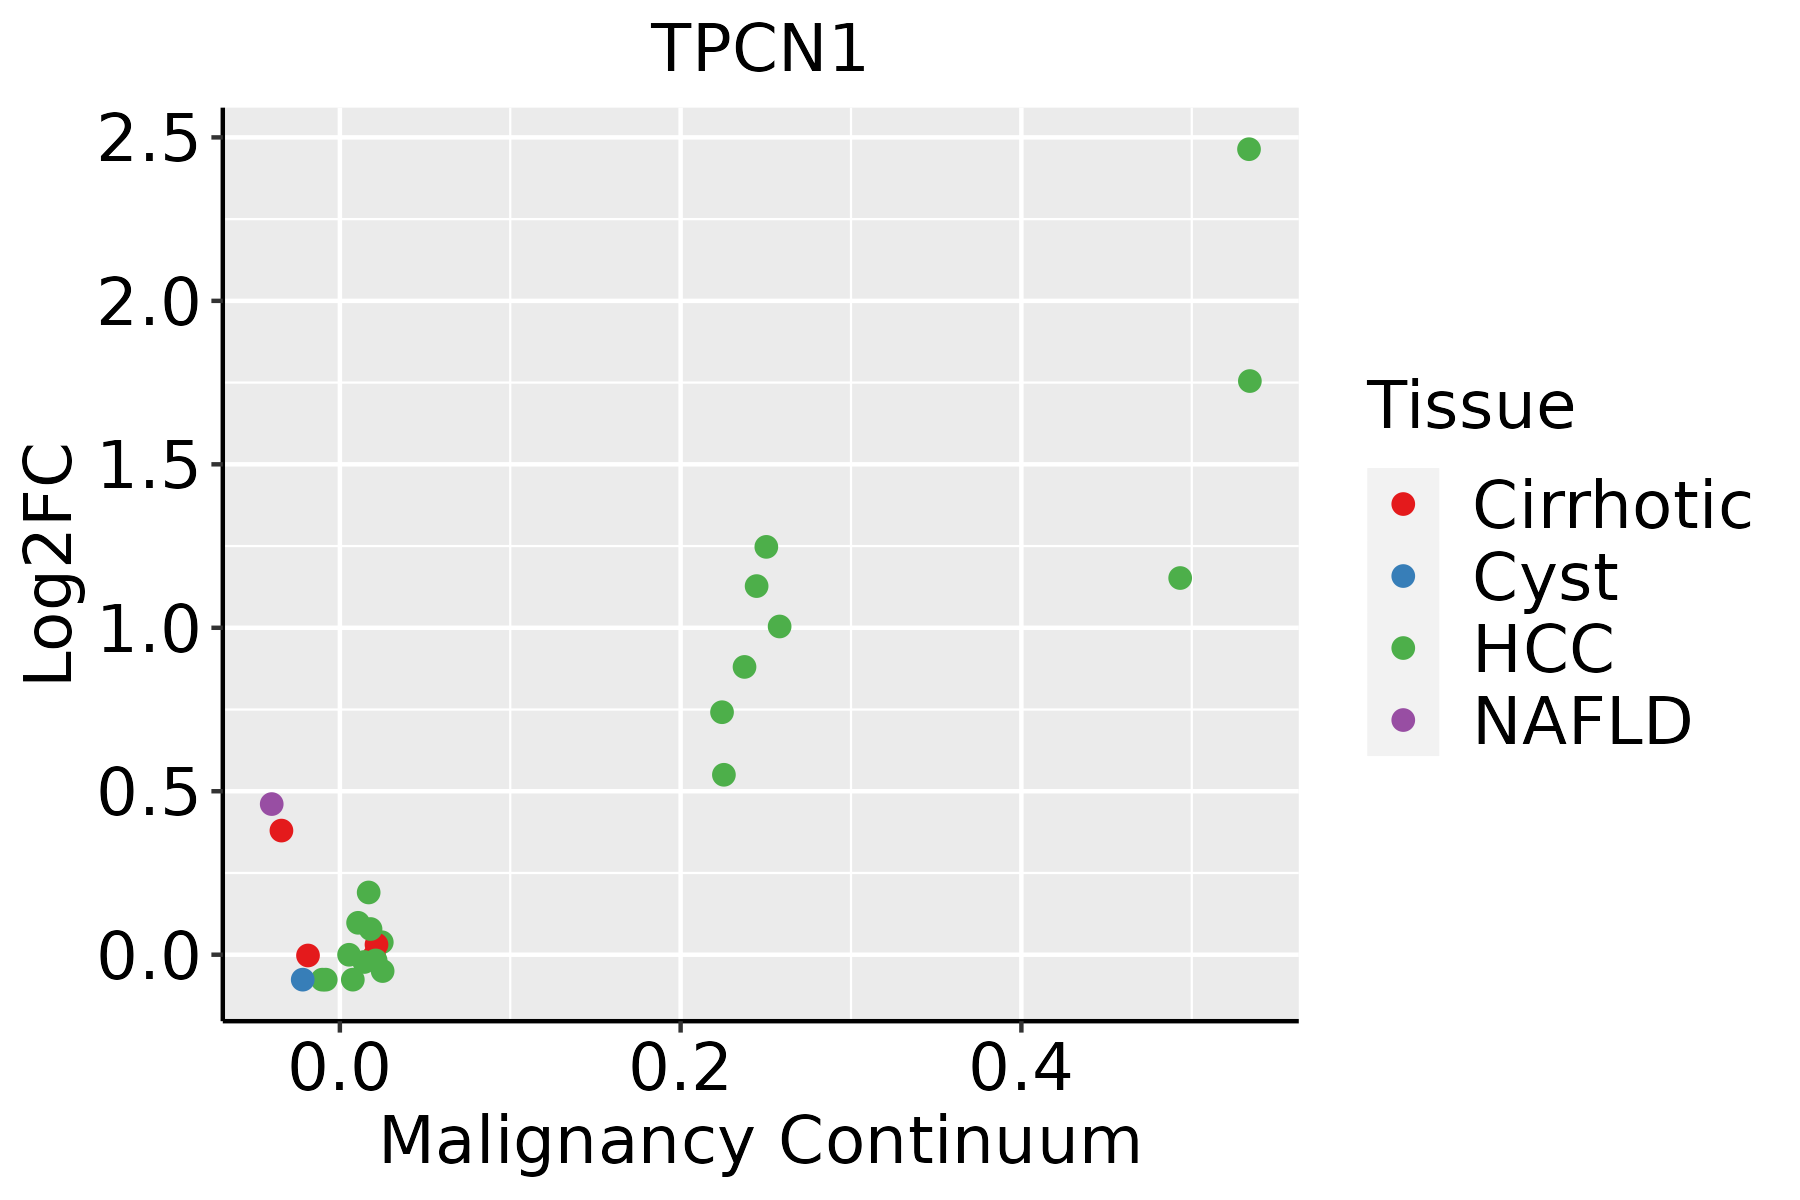 | HCC: Hepatocellular carcinoma |
| NAFLD: Non-alcoholic fatty liver disease | ||
| Thyroid | 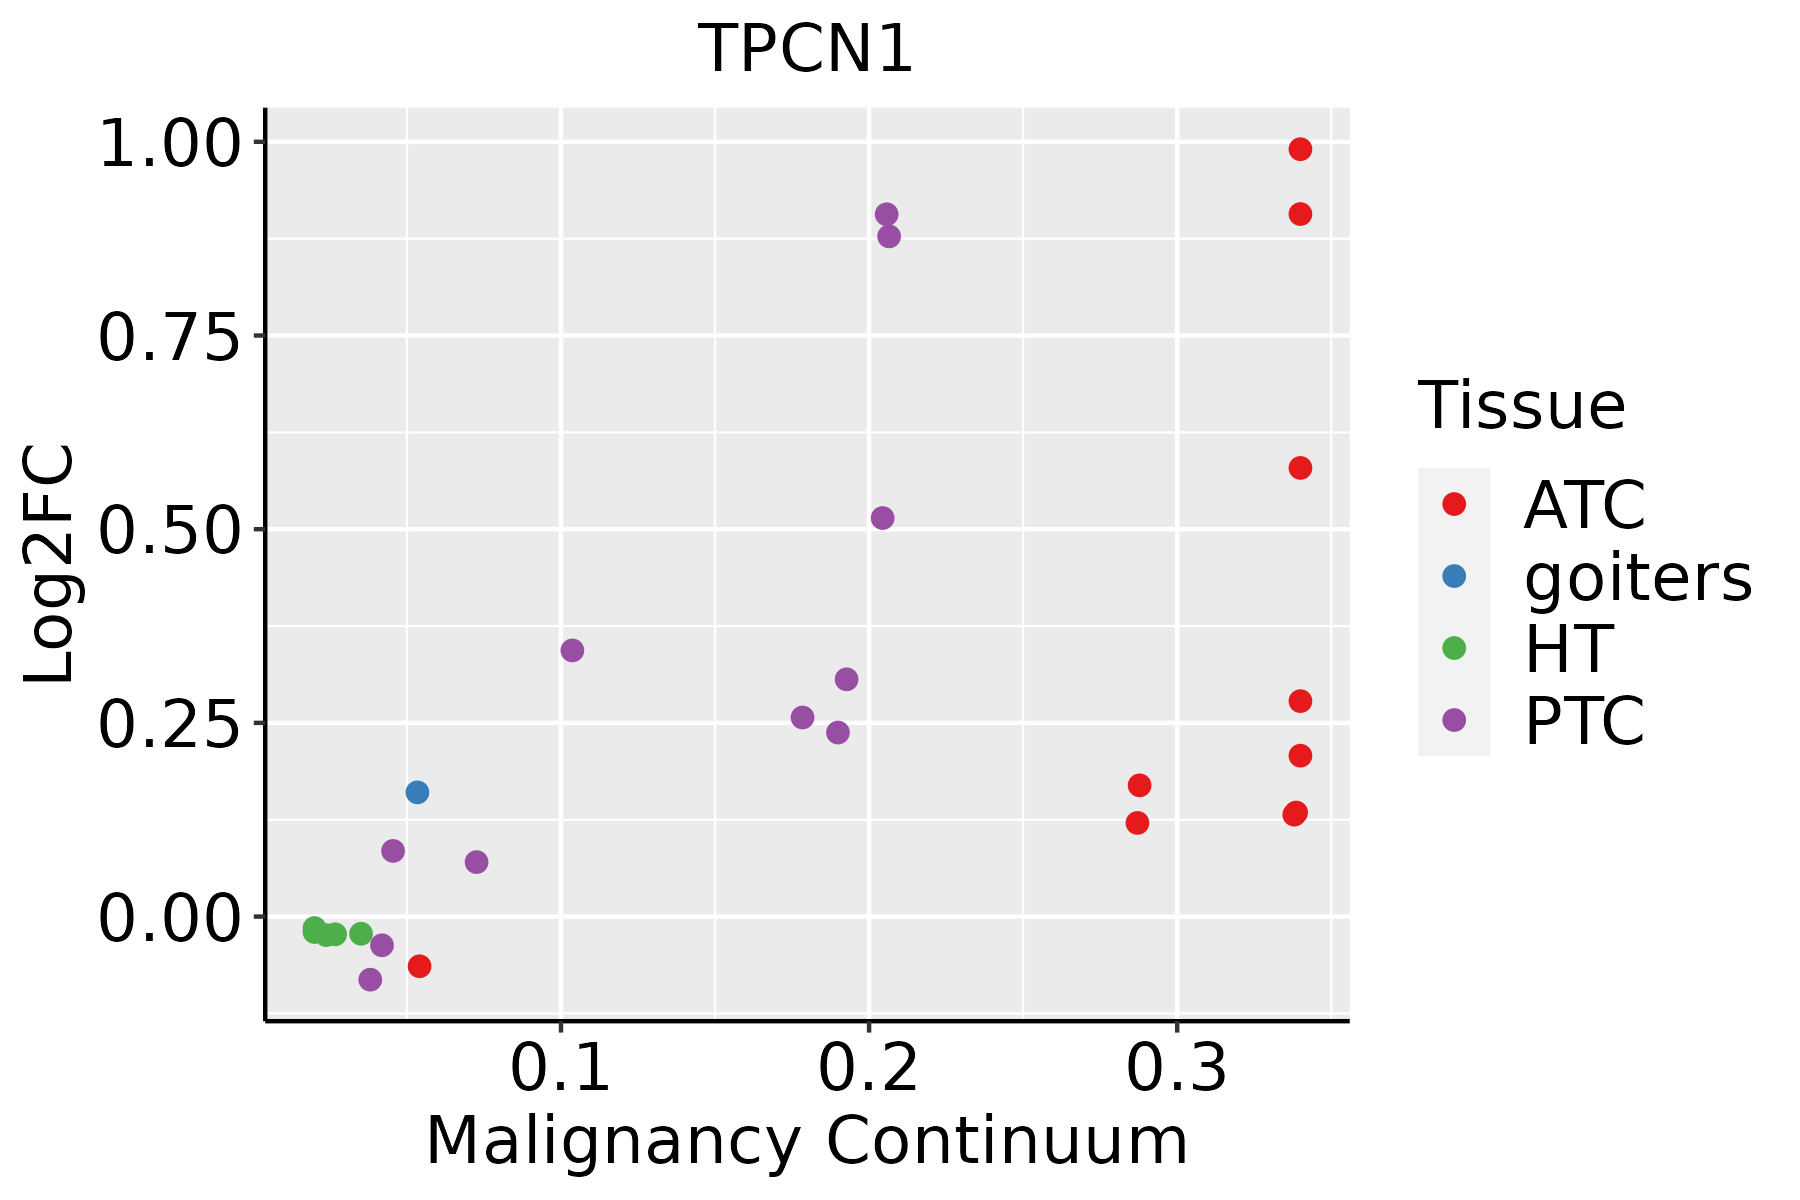 | ATC: Anaplastic thyroid cancer |
| HT: Hashimoto's thyroiditis | ||
| PTC: Papillary thyroid cancer |
| ∗log2FC in expression of this searched gene in stem-like cells from each diseased tissue sample relative to stem-like cells in normal samples in each tissue plotted against the malignancy continuum. Samples are colored based on if they are from different disease stage. |
Top |
Malignant transformation related pathway analysis |
| Find out the enriched GO biological processes and KEGG pathways involved in transition from healthy to precancer to cancer |
| Tissue | Disease Stage | Enriched GO biological Processes |
| Colorectum | AD |  |
| Colorectum | SER |  |
| Colorectum | MSS |  |
| Colorectum | MSI-H |  |
| Colorectum | FAP |  |
| ∗Top 15 enriched GO BP terms are showed in the bar plot of each disease state in each tissue. Each row represents a significant GO biological process which is colored according to the -log10(p.adjust). |
| Page: 1 2 3 4 5 6 7 8 9 |
| GO ID | Tissue | Disease Stage | Description | Gene Ratio | Bg Ratio | pvalue | p.adjust | Count |
| GO:0046718112 | Thyroid | PTC | viral entry into host cell | 68/5968 | 144/18723 | 8.26e-05 | 7.00e-04 | 68 |
| GO:0009896210 | Thyroid | ATC | positive regulation of catabolic process | 290/6293 | 492/18723 | 2.15e-31 | 1.94e-28 | 290 |
| GO:0031331210 | Thyroid | ATC | positive regulation of cellular catabolic process | 258/6293 | 427/18723 | 2.09e-30 | 1.65e-27 | 258 |
| GO:001603234 | Thyroid | ATC | viral process | 241/6293 | 415/18723 | 5.50e-25 | 2.04e-22 | 241 |
| GO:001050632 | Thyroid | ATC | regulation of autophagy | 180/6293 | 317/18723 | 1.34e-17 | 1.46e-15 | 180 |
| GO:001905835 | Thyroid | ATC | viral life cycle | 173/6293 | 317/18723 | 9.22e-15 | 5.50e-13 | 173 |
| GO:004440334 | Thyroid | ATC | biological process involved in symbiotic interaction | 153/6293 | 290/18723 | 1.12e-11 | 4.12e-10 | 153 |
| GO:005170134 | Thyroid | ATC | biological process involved in interaction with host | 112/6293 | 203/18723 | 1.93e-10 | 5.76e-09 | 112 |
| GO:001050817 | Thyroid | ATC | positive regulation of autophagy | 73/6293 | 124/18723 | 6.74e-09 | 1.46e-07 | 73 |
| GO:005212633 | Thyroid | ATC | movement in host environment | 94/6293 | 175/18723 | 3.20e-08 | 6.00e-07 | 94 |
| GO:005123532 | Thyroid | ATC | maintenance of location | 152/6293 | 327/18723 | 7.84e-07 | 1.04e-05 | 152 |
| GO:005165133 | Thyroid | ATC | maintenance of location in cell | 105/6293 | 214/18723 | 1.92e-06 | 2.31e-05 | 105 |
| GO:004440933 | Thyroid | ATC | entry into host | 76/6293 | 151/18723 | 1.54e-05 | 1.43e-04 | 76 |
| GO:004671833 | Thyroid | ATC | viral entry into host cell | 72/6293 | 144/18723 | 3.38e-05 | 2.80e-04 | 72 |
| Page: 1 2 3 4 5 6 |
| Pathway ID | Tissue | Disease Stage | Description | Gene Ratio | Bg Ratio | pvalue | p.adjust | qvalue | Count |
| Page: 1 |
Top |
Cell-cell communication analysis |
| Identification of potential cell-cell interactions between two cell types and their ligand-receptor pairs for different disease states |
| Ligand | Receptor | LRpair | Pathway | Tissue | Disease Stage |
| Page: 1 |
Top |
Single-cell gene regulatory network inference analysis |
| Find out the significant the regulons (TFs) and the target genes of each regulon across cell types for different disease states |
| TF | Cell Type | Tissue | Disease Stage | Target Gene | RSS | Regulon Activity |
| ∗The dot plots of a searched regulon are shown for all cell subpopulations in each disease state of each tissue based on the regulon specific score inferred using pySCENIC and by calculating the average expression. |
| Page: 1 |
Top |
Somatic mutation of malignant transformation related genes |
| Annotation of somatic variants for genes involved in malignant transformation |
| Hugo Symbol | Variant Class | Variant Classification | dbSNP RS | HGVSc | HGVSp | HGVSp Short | SWISSPROT | BIOTYPE | SIFT | PolyPhen | Tumor Sample Barcode | Tissue | Histology | Sex | Age | Stage | Therapy Types | Drugs | Outcome |
| TPCN1 | SNV | Missense_Mutation | novel | c.992N>T | p.Ser331Leu | p.S331L | Q9ULQ1 | protein_coding | tolerated(0.17) | benign(0.084) | TCGA-3C-AALI-01 | Breast | breast invasive carcinoma | Female | <65 | I/II | Unspecific | Poly E | Complete Response |
| TPCN1 | SNV | Missense_Mutation | novel | c.2185N>G | p.Thr729Ala | p.T729A | Q9ULQ1 | protein_coding | tolerated(0.78) | benign(0.086) | TCGA-A2-A0CP-01 | Breast | breast invasive carcinoma | Female | <65 | I/II | Chemotherapy | cytoxan | SD |
| TPCN1 | SNV | Missense_Mutation | c.2473N>T | p.His825Tyr | p.H825Y | Q9ULQ1 | protein_coding | tolerated(0.88) | benign(0.034) | TCGA-A2-A0SY-01 | Breast | breast invasive carcinoma | Female | <65 | III/IV | Hormone Therapy | arimidex | SD | |
| TPCN1 | SNV | Missense_Mutation | novel | c.1654N>T | p.Leu552Phe | p.L552F | Q9ULQ1 | protein_coding | tolerated(0.3) | benign(0.068) | TCGA-A7-A0CJ-01 | Breast | breast invasive carcinoma | Female | <65 | I/II | Chemotherapy | cytoxan | SD |
| TPCN1 | SNV | Missense_Mutation | rs200815967 | c.1702N>A | p.Gly568Ser | p.G568S | Q9ULQ1 | protein_coding | deleterious(0.03) | probably_damaging(0.991) | TCGA-A8-A09Z-01 | Breast | breast invasive carcinoma | Female | >=65 | I/II | Unknown | Unknown | SD |
| TPCN1 | SNV | Missense_Mutation | c.2156N>T | p.Asn719Ile | p.N719I | Q9ULQ1 | protein_coding | deleterious(0) | probably_damaging(0.998) | TCGA-B6-A0WV-01 | Breast | breast invasive carcinoma | Female | >=65 | I/II | Unknown | Unknown | SD | |
| TPCN1 | SNV | Missense_Mutation | c.592G>A | p.Glu198Lys | p.E198K | Q9ULQ1 | protein_coding | deleterious(0) | probably_damaging(0.999) | TCGA-BH-A18P-01 | Breast | breast invasive carcinoma | Female | <65 | I/II | Unknown | Unknown | PD | |
| TPCN1 | SNV | Missense_Mutation | rs766623325 | c.1352N>A | p.Arg451His | p.R451H | Q9ULQ1 | protein_coding | tolerated(0.55) | probably_damaging(0.985) | TCGA-E9-A2JS-01 | Breast | breast invasive carcinoma | Female | >=65 | I/II | Chemotherapy | cyclophosphamide | PD |
| TPCN1 | insertion | Frame_Shift_Ins | novel | c.1656_1657insAGCCTGGGTAATAATAAAACCCT | p.Val553SerfsTer11 | p.V553Sfs*11 | Q9ULQ1 | protein_coding | TCGA-A7-A0CJ-01 | Breast | breast invasive carcinoma | Female | <65 | I/II | Chemotherapy | cytoxan | SD | ||
| TPCN1 | insertion | Frame_Shift_Ins | novel | c.1346_1347insTTTAGAAACCAGGAACCCTGCCCTTGGAAGAATGAACAGAGCT | p.Arg449SerfsTer59 | p.R449Sfs*59 | Q9ULQ1 | protein_coding | TCGA-AN-A0FN-01 | Breast | breast invasive carcinoma | Female | <65 | I/II | Unknown | Unknown | SD |
| Page: 1 2 3 4 5 6 7 8 9 10 |
Top |
Related drugs of malignant transformation related genes |
| Identification of chemicals and drugs interact with genes involved in malignant transfromation |
| (DGIdb 4.0) |
| Entrez ID | Symbol | Category | Interaction Types | Drug Claim Name | Drug Name | PMIDs |
| 53373 | TPCN1 | ION CHANNEL, DRUGGABLE GENOME | blocker | 135652732 | ||
| 53373 | TPCN1 | ION CHANNEL, DRUGGABLE GENOME | blocker | 135651305 | VERAPAMIL | |
| 53373 | TPCN1 | ION CHANNEL, DRUGGABLE GENOME | activator | 178100233 |
| Page: 1 |

Copyright 2023-Present -The University of Texas Health Science Center at Houston |