
|
|||||
|
 | |
| |
| |
| |
| |
| |
|
Gene: TMEM259 |
Gene summary for TMEM259 |
| Gene information | Species | Human | Gene symbol | TMEM259 | Gene ID | 91304 |
| Gene name | transmembrane protein 259 | |
| Gene Alias | ASBABP1 | |
| Cytomap | 19p13.3 | |
| Gene Type | protein-coding | GO ID | GO:0006508 | UniProtAcc | B3KTL0 |
Top |
Malignant transformation analysis |
| Identification of the aberrant gene expression in precancerous and cancerous lesions by comparing the gene expression of stem-like cells in diseased tissues with normal stem cells |
| Entrez ID | Symbol | Replicates | Species | Organ | Tissue | Adj P-value | Log2FC | Malignancy |
| 91304 | TMEM259 | LZE4T | Human | Esophagus | ESCC | 9.89e-03 | -1.84e-02 | 0.0811 |
| 91304 | TMEM259 | LZE7T | Human | Esophagus | ESCC | 6.28e-10 | 2.86e-01 | 0.0667 |
| 91304 | TMEM259 | LZE20T | Human | Esophagus | ESCC | 7.70e-13 | 3.08e-01 | 0.0662 |
| 91304 | TMEM259 | LZE22D1 | Human | Esophagus | HGIN | 7.76e-06 | 1.63e-01 | 0.0595 |
| 91304 | TMEM259 | LZE22T | Human | Esophagus | ESCC | 3.77e-08 | 4.56e-01 | 0.068 |
| 91304 | TMEM259 | LZE24T | Human | Esophagus | ESCC | 6.01e-20 | 4.59e-01 | 0.0596 |
| 91304 | TMEM259 | LZE21T | Human | Esophagus | ESCC | 1.39e-13 | 5.11e-01 | 0.0655 |
| 91304 | TMEM259 | P1T-E | Human | Esophagus | ESCC | 9.85e-21 | 9.15e-01 | 0.0875 |
| 91304 | TMEM259 | P2T-E | Human | Esophagus | ESCC | 8.21e-32 | 4.56e-01 | 0.1177 |
| 91304 | TMEM259 | P4T-E | Human | Esophagus | ESCC | 1.29e-25 | 6.04e-01 | 0.1323 |
| 91304 | TMEM259 | P5T-E | Human | Esophagus | ESCC | 2.46e-22 | 2.69e-01 | 0.1327 |
| 91304 | TMEM259 | P8T-E | Human | Esophagus | ESCC | 7.34e-26 | 2.76e-01 | 0.0889 |
| 91304 | TMEM259 | P9T-E | Human | Esophagus | ESCC | 7.03e-27 | 5.32e-01 | 0.1131 |
| 91304 | TMEM259 | P10T-E | Human | Esophagus | ESCC | 1.29e-51 | 8.85e-01 | 0.116 |
| 91304 | TMEM259 | P11T-E | Human | Esophagus | ESCC | 7.63e-13 | 5.88e-01 | 0.1426 |
| 91304 | TMEM259 | P12T-E | Human | Esophagus | ESCC | 5.29e-22 | 4.55e-01 | 0.1122 |
| 91304 | TMEM259 | P15T-E | Human | Esophagus | ESCC | 7.20e-25 | 5.17e-01 | 0.1149 |
| 91304 | TMEM259 | P16T-E | Human | Esophagus | ESCC | 4.18e-19 | 1.46e-01 | 0.1153 |
| 91304 | TMEM259 | P17T-E | Human | Esophagus | ESCC | 3.59e-13 | 2.44e-01 | 0.1278 |
| 91304 | TMEM259 | P20T-E | Human | Esophagus | ESCC | 4.66e-22 | 3.60e-01 | 0.1124 |
| Page: 1 2 3 4 5 6 |
| Tissue | Expression Dynamics | Abbreviation |
| Esophagus | 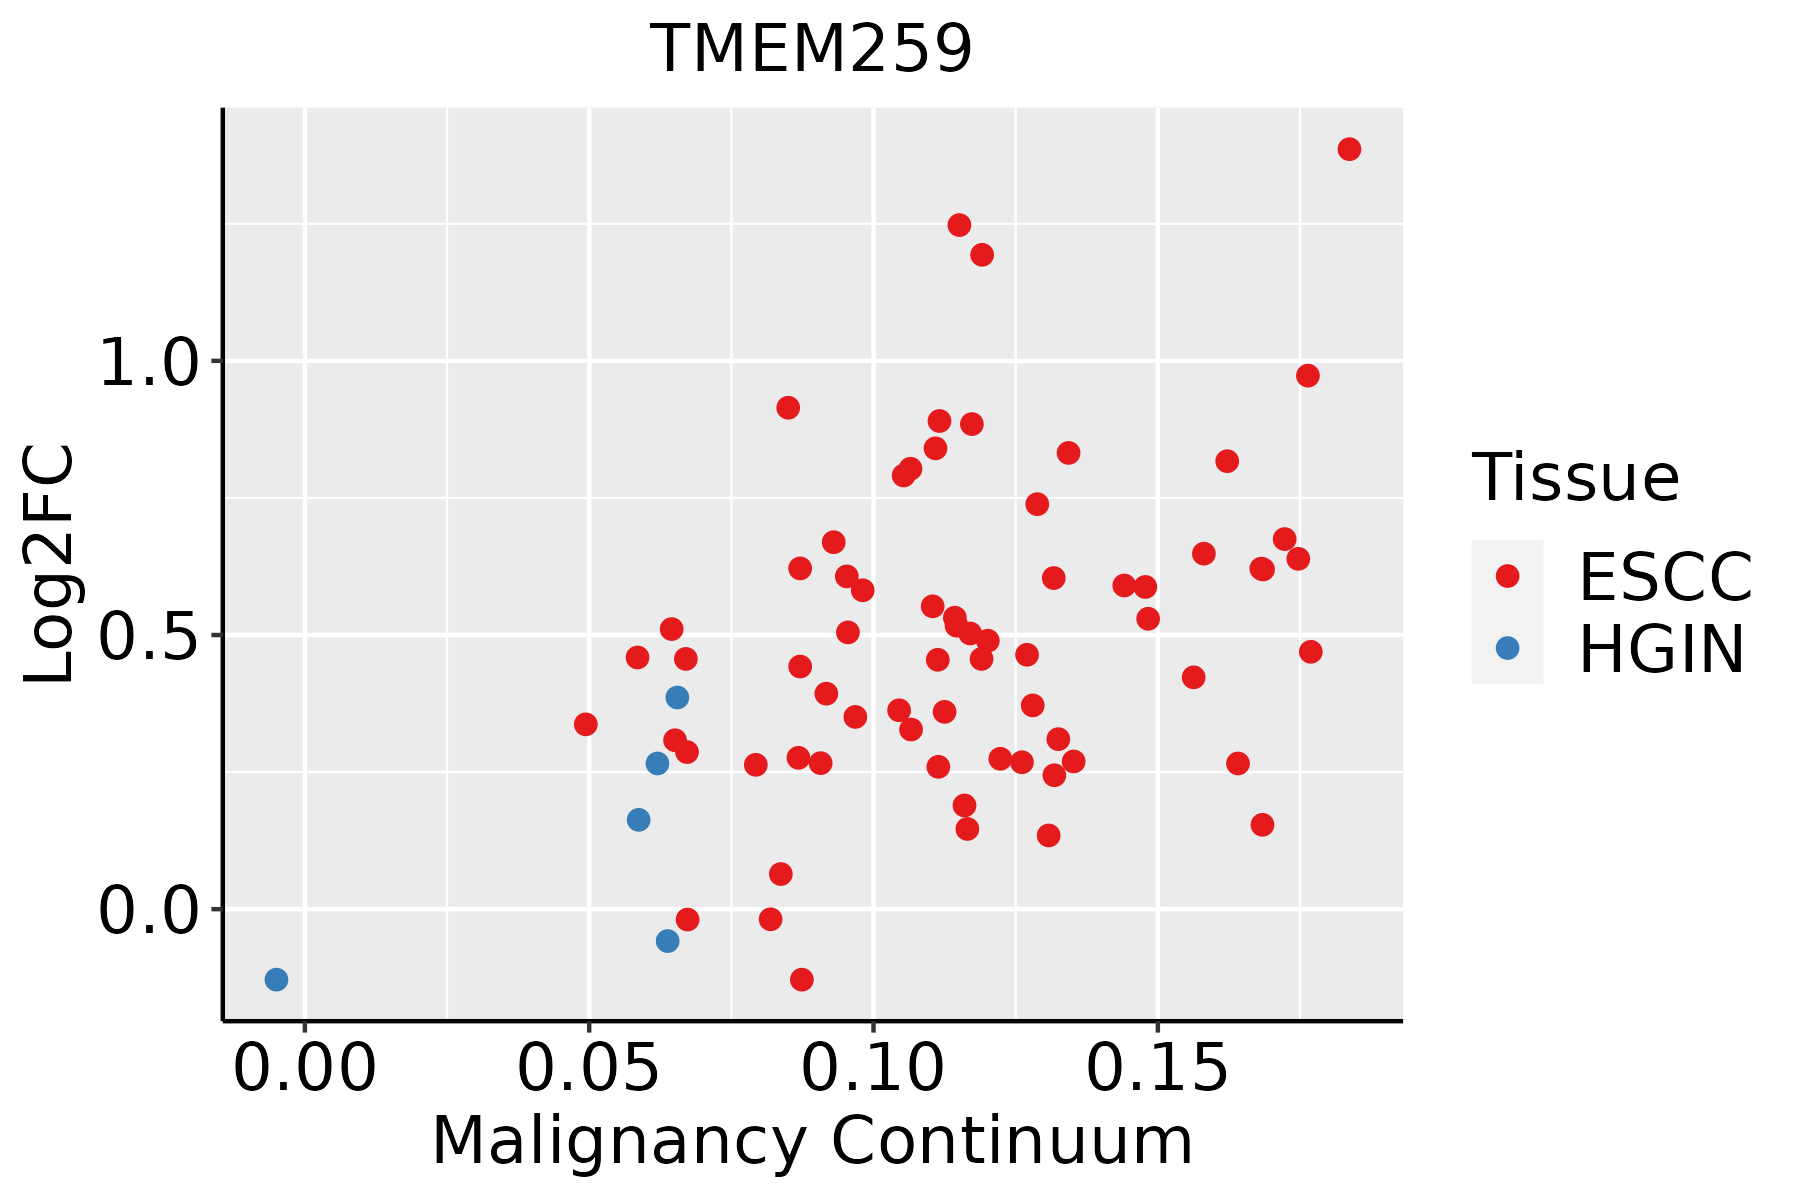 | ESCC: Esophageal squamous cell carcinoma |
| HGIN: High-grade intraepithelial neoplasias | ||
| LGIN: Low-grade intraepithelial neoplasias | ||
| Liver | 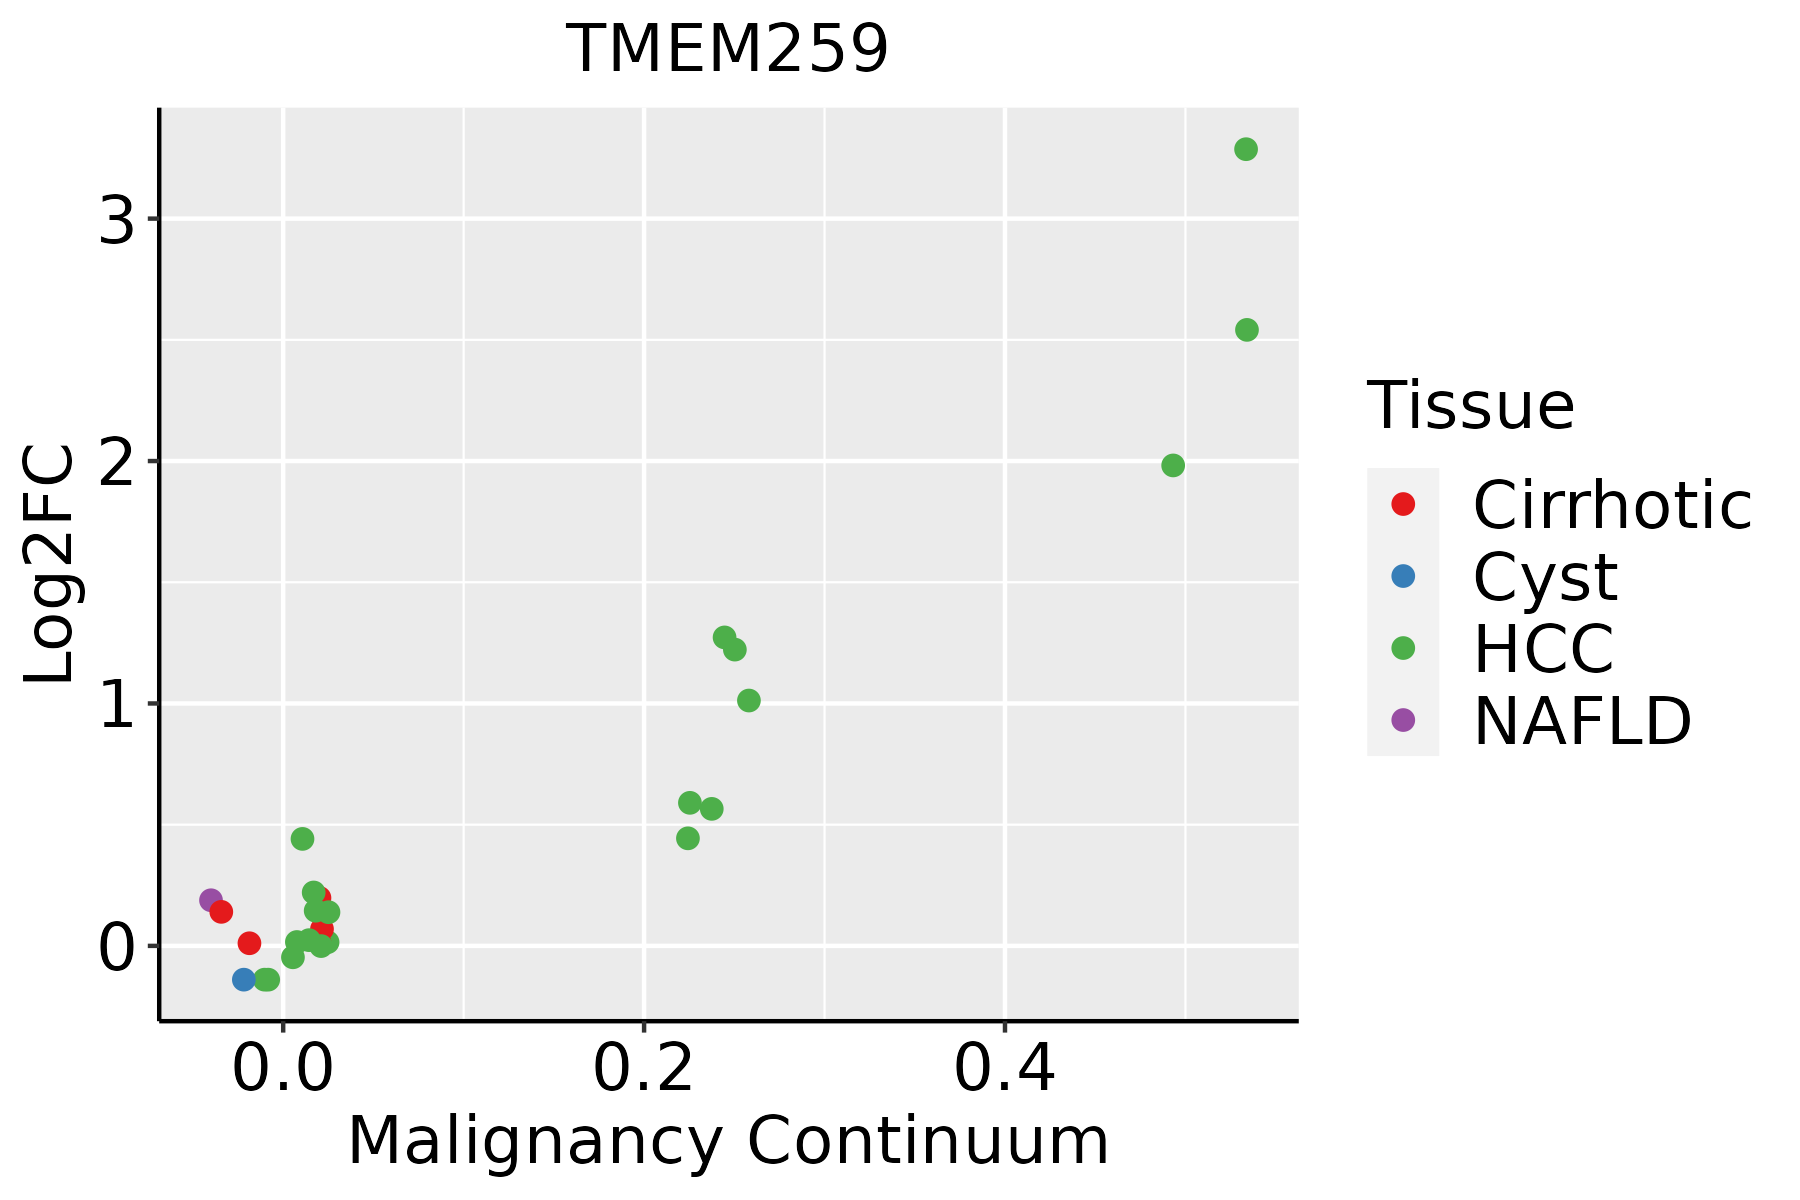 | HCC: Hepatocellular carcinoma |
| NAFLD: Non-alcoholic fatty liver disease | ||
| Oral Cavity | 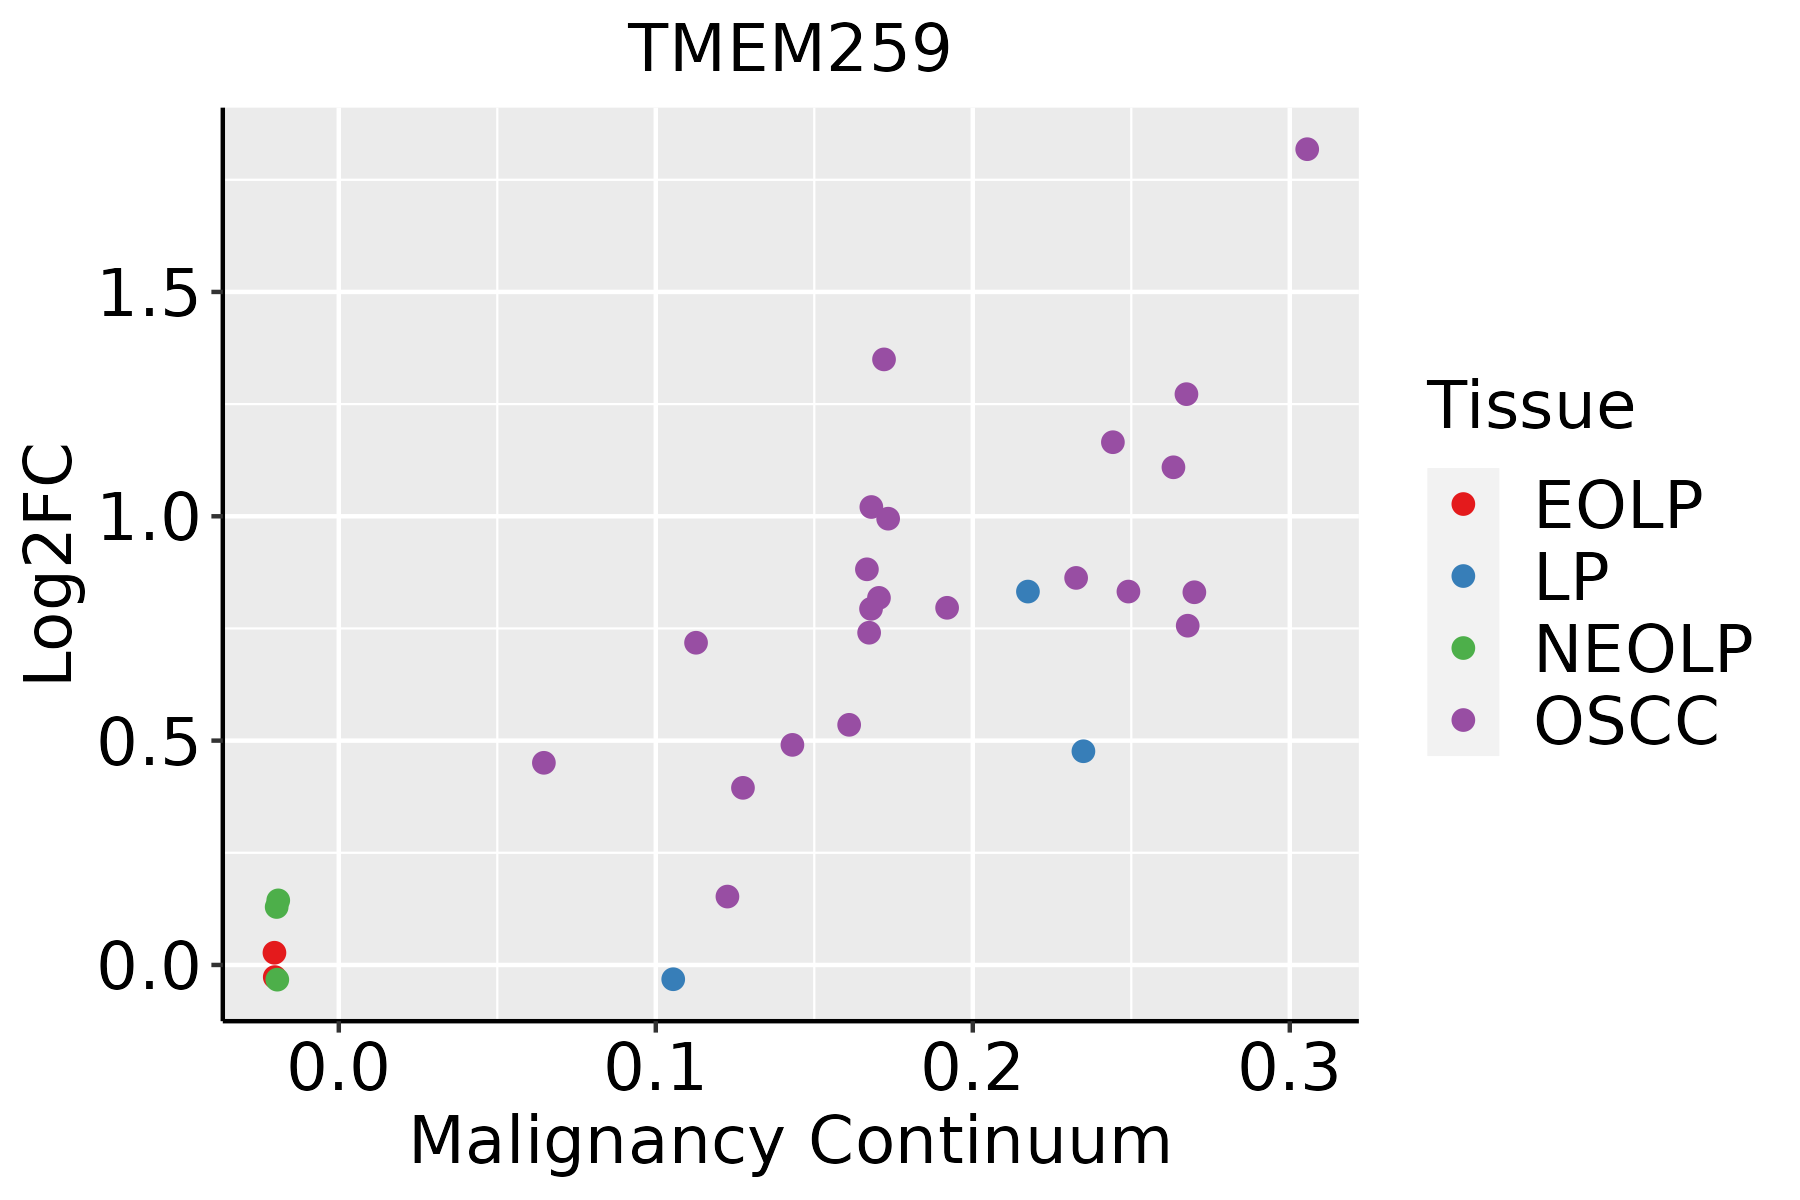 | EOLP: Erosive Oral lichen planus |
| LP: leukoplakia | ||
| NEOLP: Non-erosive oral lichen planus | ||
| OSCC: Oral squamous cell carcinoma | ||
| Skin | 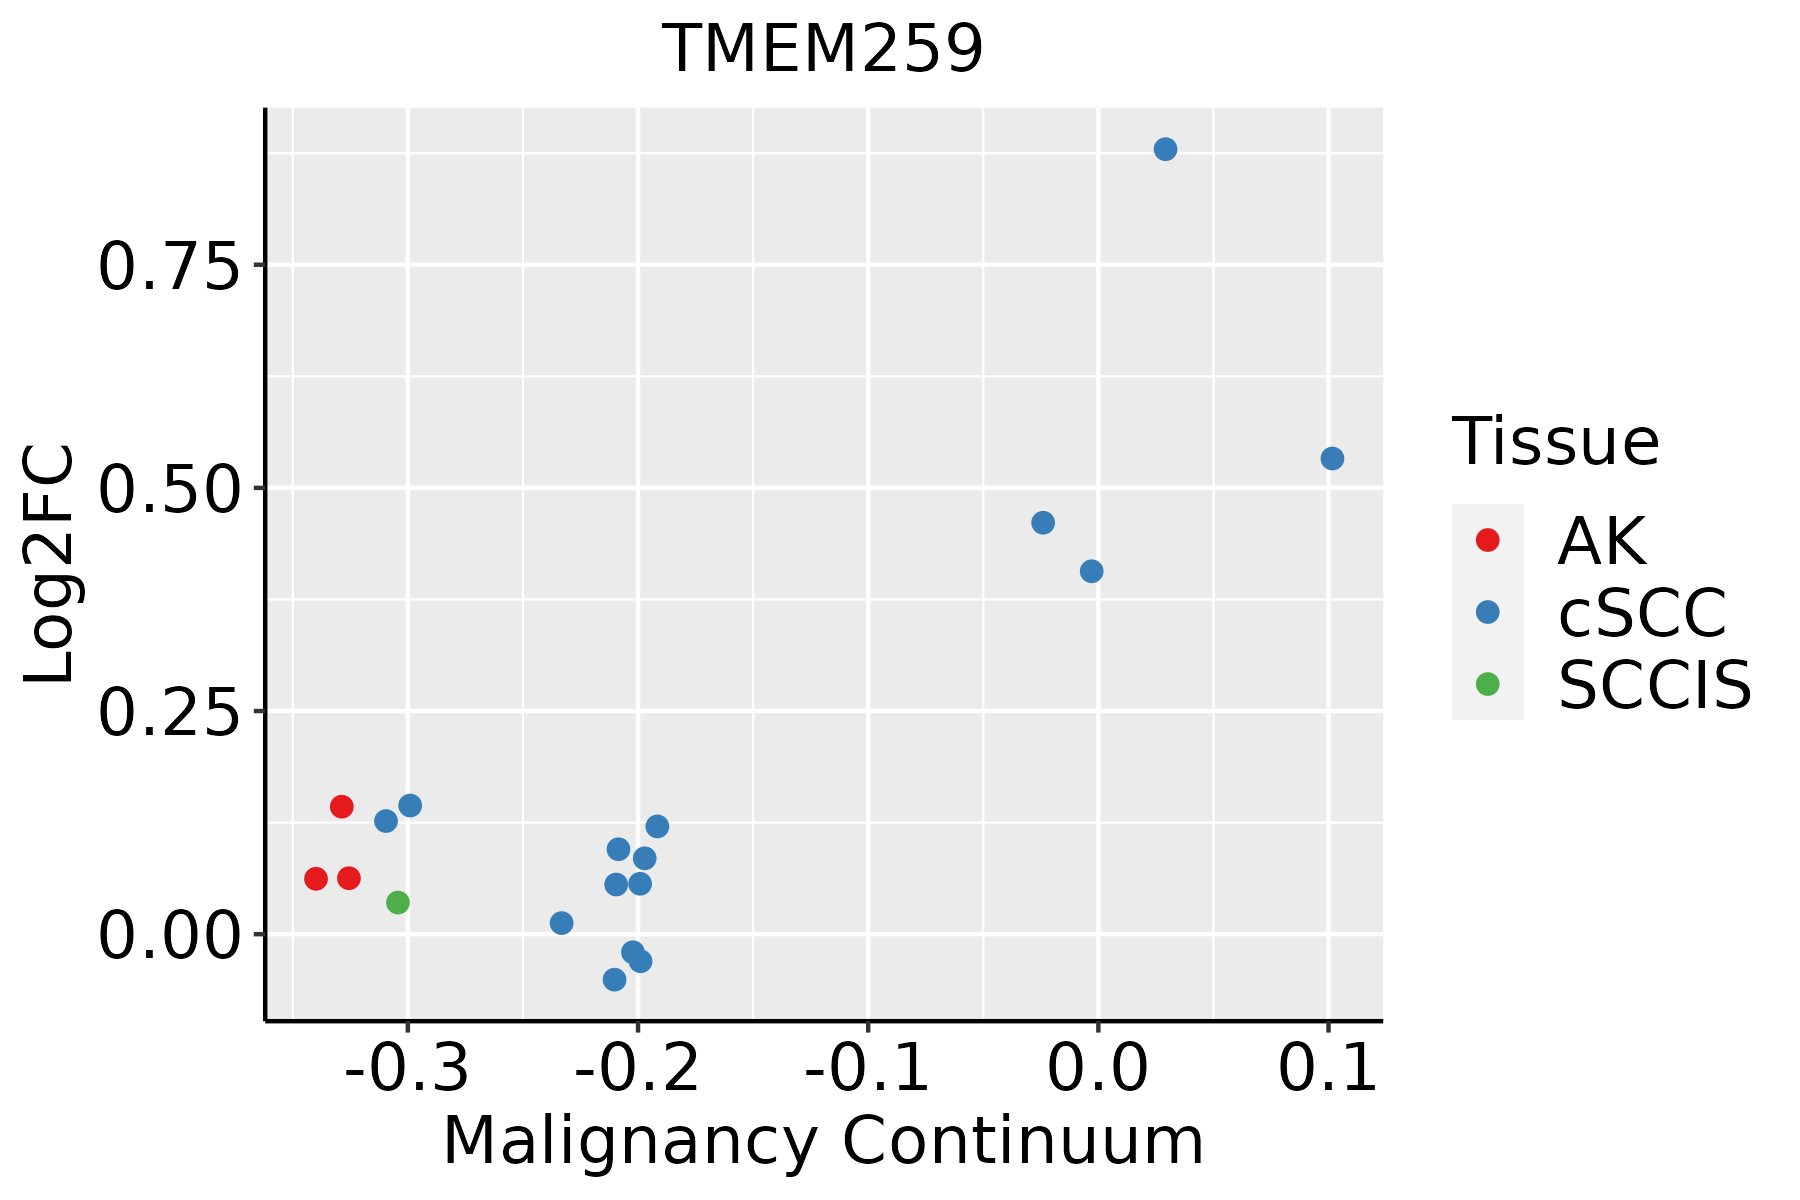 | AK: Actinic keratosis |
| cSCC: Cutaneous squamous cell carcinoma | ||
| SCCIS:squamous cell carcinoma in situ | ||
| Thyroid | 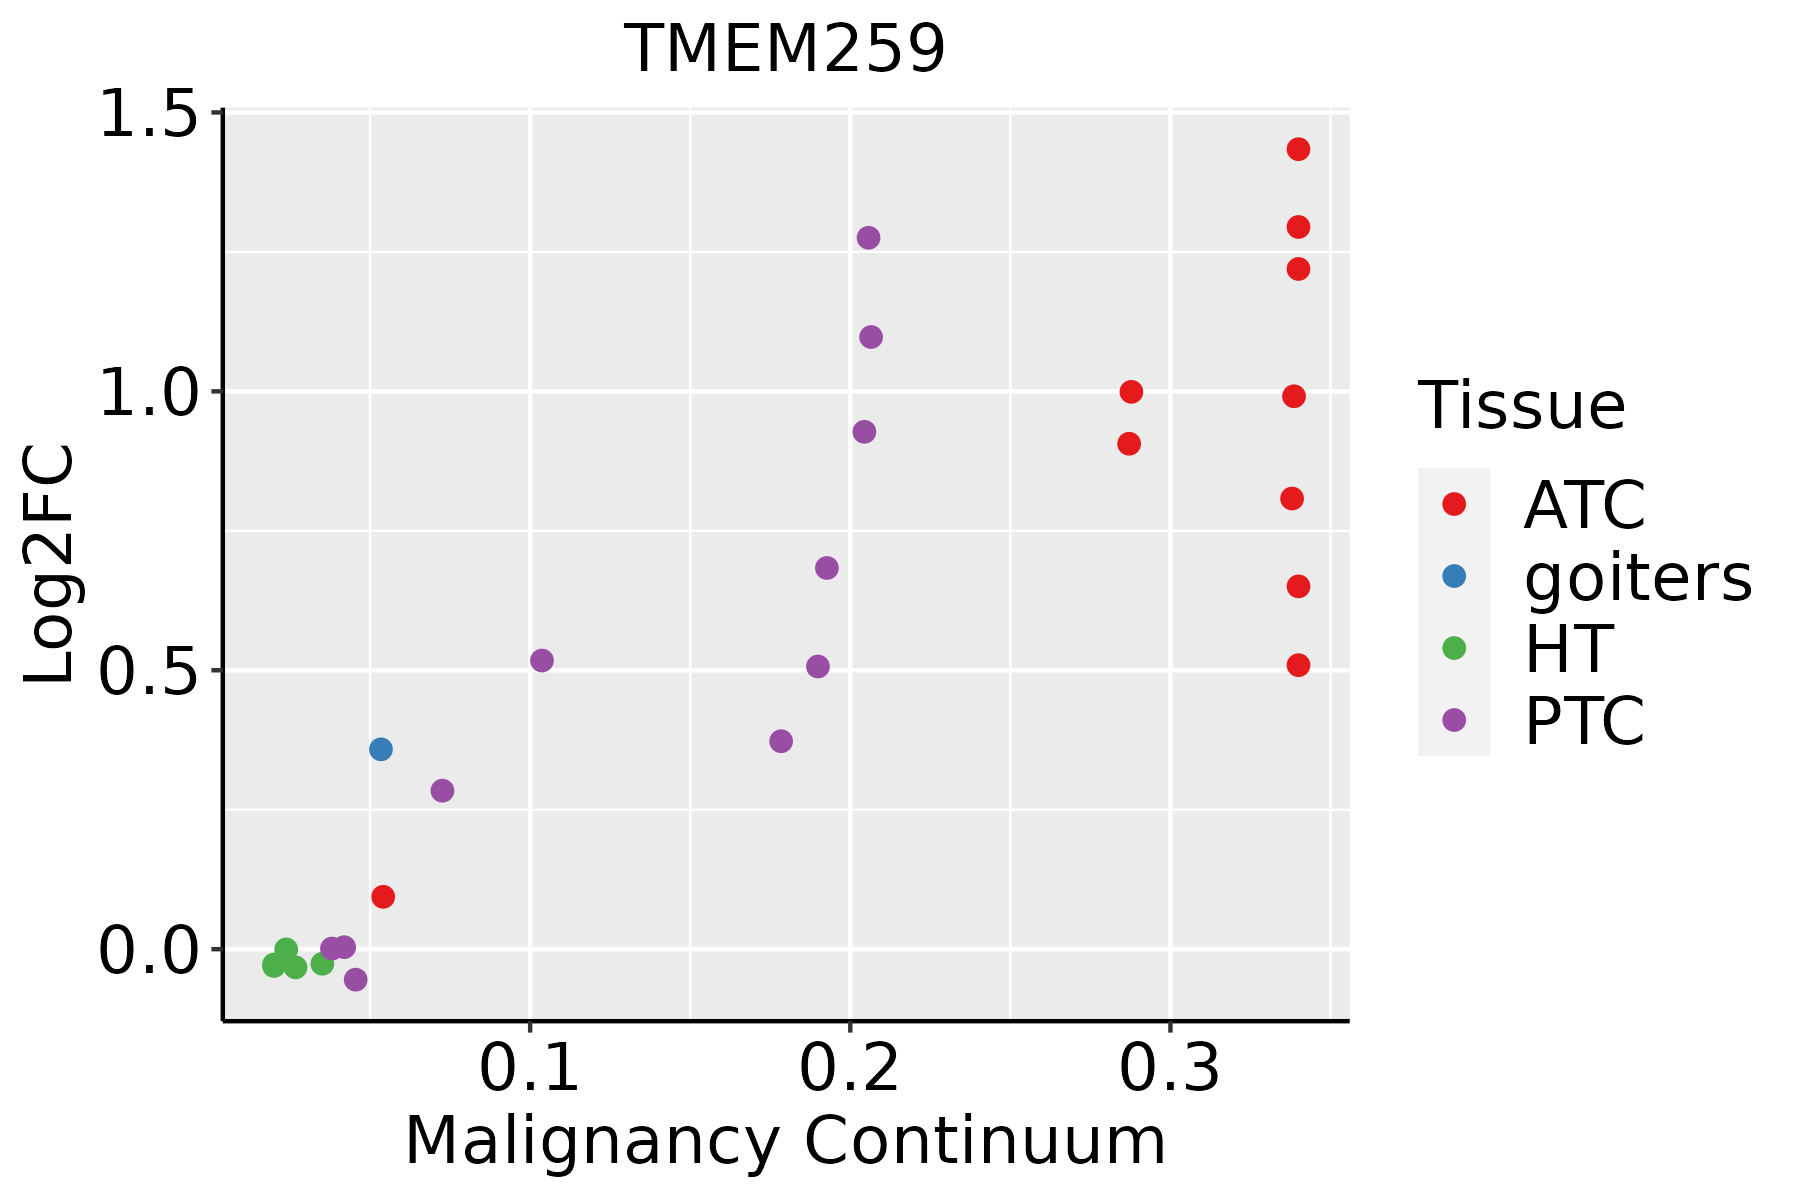 | ATC: Anaplastic thyroid cancer |
| HT: Hashimoto's thyroiditis | ||
| PTC: Papillary thyroid cancer |
| ∗log2FC in expression of this searched gene in stem-like cells from each diseased tissue sample relative to stem-like cells in normal samples in each tissue plotted against the malignancy continuum. Samples are colored based on if they are from different disease stage. |
Top |
Malignant transformation related pathway analysis |
| Find out the enriched GO biological processes and KEGG pathways involved in transition from healthy to precancer to cancer |
| Tissue | Disease Stage | Enriched GO biological Processes |
| Colorectum | AD |  |
| Colorectum | SER |  |
| Colorectum | MSS |  |
| Colorectum | MSI-H |  |
| Colorectum | FAP |  |
| ∗Top 15 enriched GO BP terms are showed in the bar plot of each disease state in each tissue. Each row represents a significant GO biological process which is colored according to the -log10(p.adjust). |
| Page: 1 2 3 4 5 6 7 8 9 |
| GO ID | Tissue | Disease Stage | Description | Gene Ratio | Bg Ratio | pvalue | p.adjust | Count |
| GO:19042942 | Oral cavity | OSCC | positive regulation of ERAD pathway | 10/7305 | 14/18723 | 1.44e-02 | 4.69e-02 | 10 |
| GO:0010498110 | Oral cavity | LP | proteasomal protein catabolic process | 224/4623 | 490/18723 | 9.57e-25 | 4.00e-22 | 224 |
| GO:0034976110 | Oral cavity | LP | response to endoplasmic reticulum stress | 133/4623 | 256/18723 | 3.84e-21 | 9.24e-19 | 133 |
| GO:0042176110 | Oral cavity | LP | regulation of protein catabolic process | 177/4623 | 391/18723 | 3.00e-19 | 5.87e-17 | 177 |
| GO:0045862110 | Oral cavity | LP | positive regulation of proteolysis | 165/4623 | 372/18723 | 5.40e-17 | 8.46e-15 | 165 |
| GO:1903362110 | Oral cavity | LP | regulation of cellular protein catabolic process | 119/4623 | 255/18723 | 1.52e-14 | 1.76e-12 | 119 |
| GO:1903050110 | Oral cavity | LP | regulation of proteolysis involved in cellular protein catabolic process | 101/4623 | 221/18723 | 7.00e-12 | 5.48e-10 | 101 |
| GO:0061136110 | Oral cavity | LP | regulation of proteasomal protein catabolic process | 89/4623 | 187/18723 | 8.05e-12 | 6.15e-10 | 89 |
| GO:0009896110 | Oral cavity | LP | positive regulation of catabolic process | 187/4623 | 492/18723 | 2.30e-11 | 1.58e-09 | 187 |
| GO:0045732110 | Oral cavity | LP | positive regulation of protein catabolic process | 103/4623 | 231/18723 | 2.68e-11 | 1.81e-09 | 103 |
| GO:003650314 | Oral cavity | LP | ERAD pathway | 57/4623 | 107/18723 | 1.99e-10 | 1.08e-08 | 57 |
| GO:0031331110 | Oral cavity | LP | positive regulation of cellular catabolic process | 163/4623 | 427/18723 | 3.03e-10 | 1.59e-08 | 163 |
| GO:1903364110 | Oral cavity | LP | positive regulation of cellular protein catabolic process | 72/4623 | 155/18723 | 2.93e-09 | 1.28e-07 | 72 |
| GO:190180019 | Oral cavity | LP | positive regulation of proteasomal protein catabolic process | 57/4623 | 114/18723 | 4.56e-09 | 1.91e-07 | 57 |
| GO:1905897110 | Oral cavity | LP | regulation of response to endoplasmic reticulum stress | 45/4623 | 82/18723 | 4.58e-09 | 1.91e-07 | 45 |
| GO:0070997110 | Oral cavity | LP | neuron death | 135/4623 | 361/18723 | 4.31e-08 | 1.52e-06 | 135 |
| GO:190305218 | Oral cavity | LP | positive regulation of proteolysis involved in cellular protein catabolic process | 61/4623 | 133/18723 | 8.17e-08 | 2.72e-06 | 61 |
| GO:1901214110 | Oral cavity | LP | regulation of neuron death | 115/4623 | 319/18723 | 3.39e-06 | 7.19e-05 | 115 |
| GO:190589812 | Oral cavity | LP | positive regulation of response to endoplasmic reticulum stress | 20/4623 | 35/18723 | 4.16e-05 | 6.05e-04 | 20 |
| GO:190429411 | Oral cavity | LP | positive regulation of ERAD pathway | 9/4623 | 14/18723 | 1.95e-03 | 1.45e-02 | 9 |
| Page: 1 2 3 4 5 6 7 8 9 10 11 |
| Pathway ID | Tissue | Disease Stage | Description | Gene Ratio | Bg Ratio | pvalue | p.adjust | qvalue | Count |
| Page: 1 |
Top |
Cell-cell communication analysis |
| Identification of potential cell-cell interactions between two cell types and their ligand-receptor pairs for different disease states |
| Ligand | Receptor | LRpair | Pathway | Tissue | Disease Stage |
| Page: 1 |
Top |
Single-cell gene regulatory network inference analysis |
| Find out the significant the regulons (TFs) and the target genes of each regulon across cell types for different disease states |
| TF | Cell Type | Tissue | Disease Stage | Target Gene | RSS | Regulon Activity |
| ∗The dot plots of a searched regulon are shown for all cell subpopulations in each disease state of each tissue based on the regulon specific score inferred using pySCENIC and by calculating the average expression. |
| Page: 1 |
Top |
Somatic mutation of malignant transformation related genes |
| Annotation of somatic variants for genes involved in malignant transformation |
| Hugo Symbol | Variant Class | Variant Classification | dbSNP RS | HGVSc | HGVSp | HGVSp Short | SWISSPROT | BIOTYPE | SIFT | PolyPhen | Tumor Sample Barcode | Tissue | Histology | Sex | Age | Stage | Therapy Types | Drugs | Outcome |
| TMEM259 | SNV | Missense_Mutation | novel | c.823N>A | p.Glu275Lys | p.E275K | Q4ZIN3 | protein_coding | deleterious(0) | probably_damaging(0.966) | TCGA-C5-A8YQ-01 | Cervix | cervical & endocervical cancer | Female | >=65 | I/II | Chemotherapy | cisplatin | PD |
| TMEM259 | SNV | Missense_Mutation | c.537N>G | p.Phe179Leu | p.F179L | Q4ZIN3 | protein_coding | tolerated(0.41) | benign(0) | TCGA-FU-A23K-01 | Cervix | cervical & endocervical cancer | Female | <65 | III/IV | Unknown | Unknown | SD | |
| TMEM259 | SNV | Missense_Mutation | rs765662869 | c.661N>T | p.Arg221Cys | p.R221C | Q4ZIN3 | protein_coding | deleterious(0) | probably_damaging(0.998) | TCGA-A6-3808-01 | Colorectum | colon adenocarcinoma | Male | >=65 | I/II | Unknown | Unknown | SD |
| TMEM259 | SNV | Missense_Mutation | c.1285N>A | p.Leu429Met | p.L429M | Q4ZIN3 | protein_coding | tolerated(0.05) | probably_damaging(0.999) | TCGA-AM-5821-01 | Colorectum | colon adenocarcinoma | Female | >=65 | I/II | Unknown | Unknown | SD | |
| TMEM259 | SNV | Missense_Mutation | rs771672096 | c.1651N>A | p.Ala551Thr | p.A551T | Q4ZIN3 | protein_coding | deleterious_low_confidence(0.01) | benign(0.413) | TCGA-AY-A54L-01 | Colorectum | colon adenocarcinoma | Female | >=65 | I/II | Unknown | Unknown | PD |
| TMEM259 | SNV | Missense_Mutation | novel | c.572N>A | p.Ser191Asn | p.S191N | Q4ZIN3 | protein_coding | tolerated(0.08) | benign(0.288) | TCGA-AZ-6601-01 | Colorectum | colon adenocarcinoma | Male | >=65 | I/II | Unknown | Unknown | PD |
| TMEM259 | SNV | Missense_Mutation | novel | c.210C>A | p.Phe70Leu | p.F70L | Q4ZIN3 | protein_coding | tolerated(0.07) | benign(0.268) | TCGA-CA-6717-01 | Colorectum | colon adenocarcinoma | Male | <65 | I/II | Chemotherapy | oxaliplatin | CR |
| TMEM259 | SNV | Missense_Mutation | rs750855238 | c.361N>T | p.Arg121Cys | p.R121C | Q4ZIN3 | protein_coding | deleterious(0) | probably_damaging(0.953) | TCGA-CM-6167-01 | Colorectum | colon adenocarcinoma | Female | <65 | III/IV | Unknown | Unknown | SD |
| TMEM259 | SNV | Missense_Mutation | rs774112698 | c.686G>A | p.Arg229His | p.R229H | Q4ZIN3 | protein_coding | deleterious(0.02) | probably_damaging(0.99) | TCGA-AJ-A3BG-01 | Endometrium | uterine corpus endometrioid carcinoma | Female | >=65 | I/II | Chemotherapy | carboplatin | PD |
| TMEM259 | SNV | Missense_Mutation | novel | c.1239N>G | p.Phe413Leu | p.F413L | Q4ZIN3 | protein_coding | deleterious(0.03) | possibly_damaging(0.888) | TCGA-AX-A2H2-01 | Endometrium | uterine corpus endometrioid carcinoma | Female | >=65 | I/II | Unknown | Unknown | SD |
| Page: 1 2 3 |
Top |
Related drugs of malignant transformation related genes |
| Identification of chemicals and drugs interact with genes involved in malignant transfromation |
| (DGIdb 4.0) |
| Entrez ID | Symbol | Category | Interaction Types | Drug Claim Name | Drug Name | PMIDs |
| Page: 1 |

Copyright 2023-Present -The University of Texas Health Science Center at Houston |