
|
|||||
|
 | |
| |
| |
| |
| |
| |
|
Gene: TMEM109 |
Gene summary for TMEM109 |
| Gene information | Species | Human | Gene symbol | TMEM109 | Gene ID | 79073 |
| Gene name | transmembrane protein 109 | |
| Gene Alias | TMEM109 | |
| Cytomap | 11q12.2 | |
| Gene Type | protein-coding | GO ID | GO:0006810 | UniProtAcc | Q9BVC6 |
Top |
Malignant transformation analysis |
| Identification of the aberrant gene expression in precancerous and cancerous lesions by comparing the gene expression of stem-like cells in diseased tissues with normal stem cells |
| Entrez ID | Symbol | Replicates | Species | Organ | Tissue | Adj P-value | Log2FC | Malignancy |
| 79073 | TMEM109 | LZE2T | Human | Esophagus | ESCC | 3.00e-03 | 9.12e-01 | 0.082 |
| 79073 | TMEM109 | LZE3D | Human | Esophagus | HGIN | 4.48e-02 | 4.91e-01 | 0.0668 |
| 79073 | TMEM109 | LZE4T | Human | Esophagus | ESCC | 1.83e-15 | 6.36e-01 | 0.0811 |
| 79073 | TMEM109 | LZE7T | Human | Esophagus | ESCC | 2.58e-02 | 4.18e-01 | 0.0667 |
| 79073 | TMEM109 | LZE8T | Human | Esophagus | ESCC | 3.08e-04 | 2.47e-01 | 0.067 |
| 79073 | TMEM109 | LZE20T | Human | Esophagus | ESCC | 6.89e-03 | 8.41e-02 | 0.0662 |
| 79073 | TMEM109 | LZE24T | Human | Esophagus | ESCC | 1.68e-17 | 6.59e-01 | 0.0596 |
| 79073 | TMEM109 | LZE22D3 | Human | Esophagus | HGIN | 4.25e-02 | 2.53e-01 | 0.0653 |
| 79073 | TMEM109 | LZE21T | Human | Esophagus | ESCC | 7.13e-04 | 1.78e-01 | 0.0655 |
| 79073 | TMEM109 | LZE6T | Human | Esophagus | ESCC | 9.77e-10 | 3.16e-01 | 0.0845 |
| 79073 | TMEM109 | P1T-E | Human | Esophagus | ESCC | 1.49e-07 | 4.96e-01 | 0.0875 |
| 79073 | TMEM109 | P2T-E | Human | Esophagus | ESCC | 2.21e-32 | 6.88e-01 | 0.1177 |
| 79073 | TMEM109 | P4T-E | Human | Esophagus | ESCC | 1.90e-39 | 1.12e+00 | 0.1323 |
| 79073 | TMEM109 | P5T-E | Human | Esophagus | ESCC | 6.11e-39 | 8.55e-01 | 0.1327 |
| 79073 | TMEM109 | P8T-E | Human | Esophagus | ESCC | 1.54e-37 | 8.53e-01 | 0.0889 |
| 79073 | TMEM109 | P9T-E | Human | Esophagus | ESCC | 3.54e-28 | 6.80e-01 | 0.1131 |
| 79073 | TMEM109 | P10T-E | Human | Esophagus | ESCC | 4.01e-41 | 7.93e-01 | 0.116 |
| 79073 | TMEM109 | P11T-E | Human | Esophagus | ESCC | 1.92e-28 | 1.23e+00 | 0.1426 |
| 79073 | TMEM109 | P12T-E | Human | Esophagus | ESCC | 1.90e-49 | 9.36e-01 | 0.1122 |
| 79073 | TMEM109 | P15T-E | Human | Esophagus | ESCC | 8.36e-33 | 9.21e-01 | 0.1149 |
| Page: 1 2 3 4 5 6 |
| Tissue | Expression Dynamics | Abbreviation |
| Esophagus |  | ESCC: Esophageal squamous cell carcinoma |
| HGIN: High-grade intraepithelial neoplasias | ||
| LGIN: Low-grade intraepithelial neoplasias | ||
| Liver | 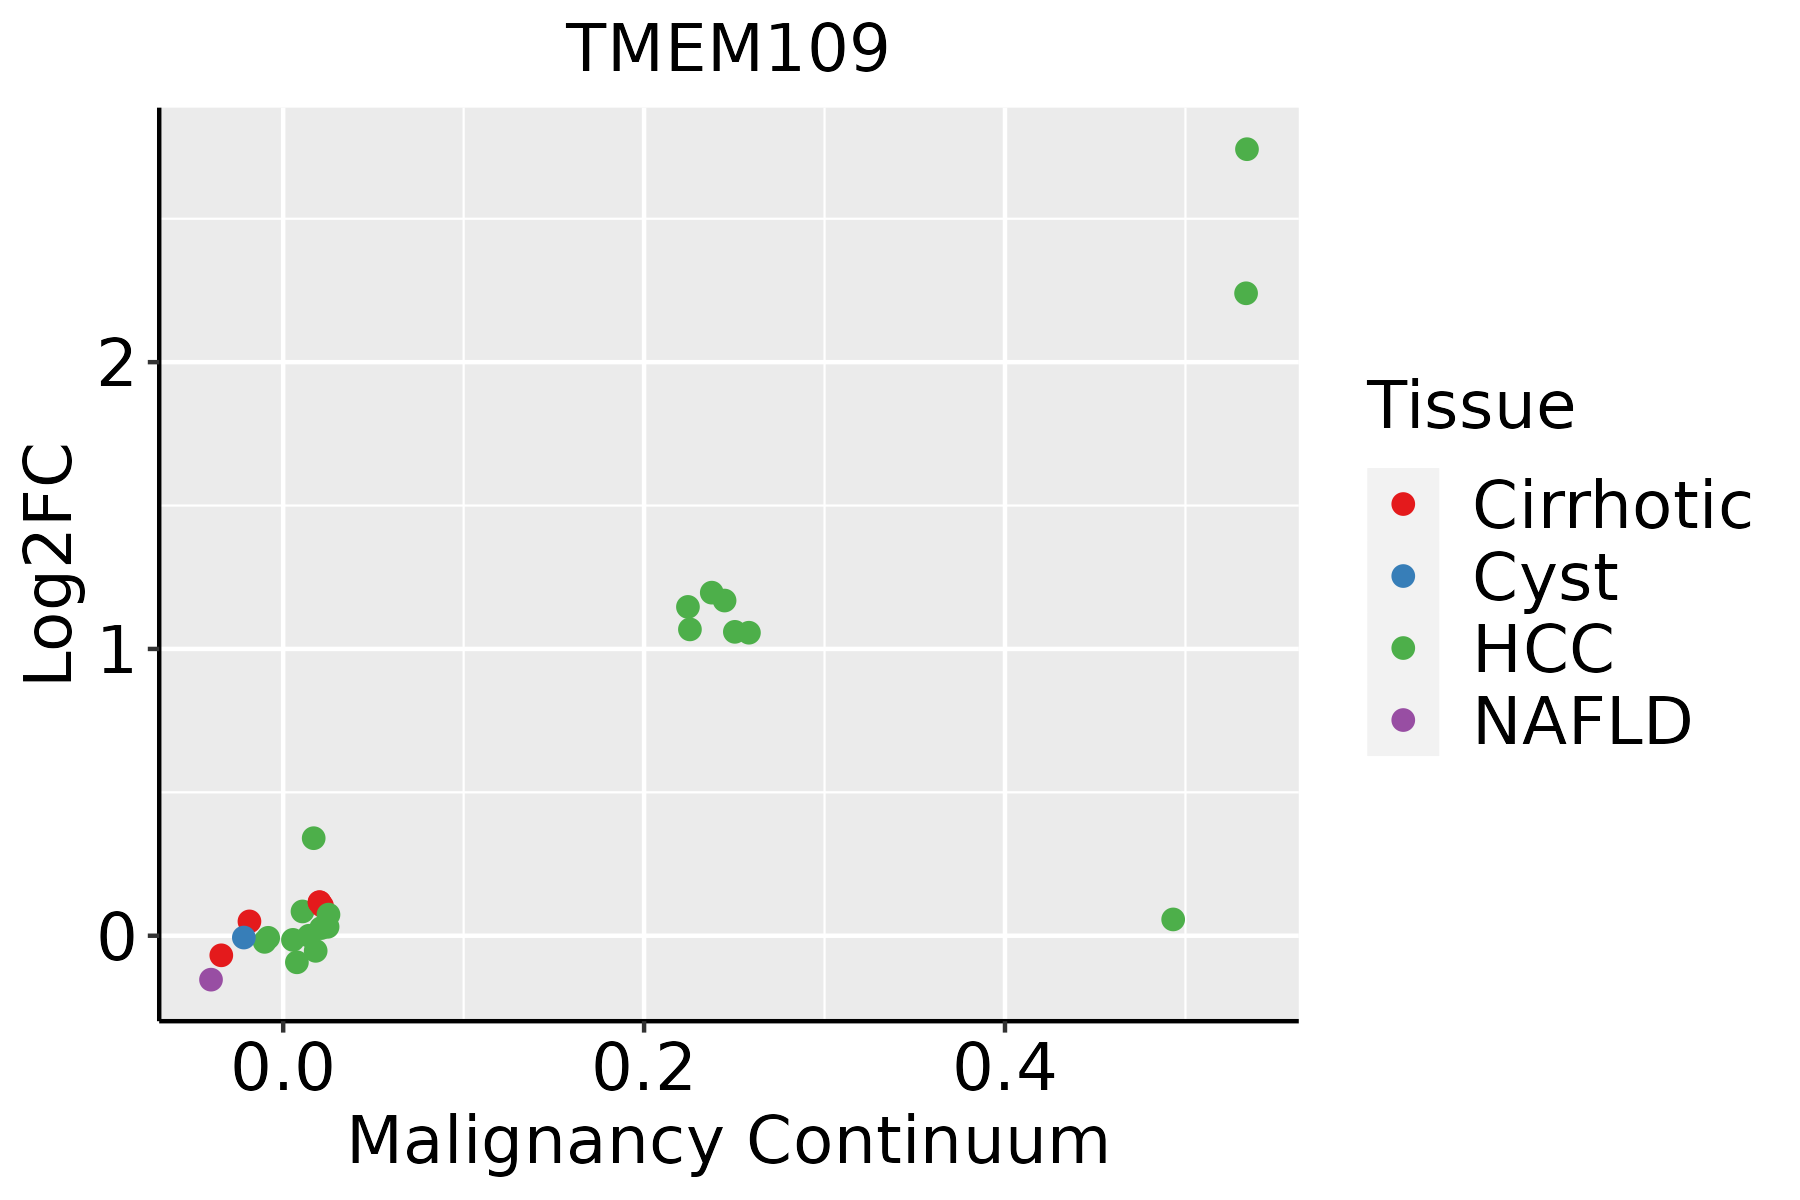 | HCC: Hepatocellular carcinoma |
| NAFLD: Non-alcoholic fatty liver disease | ||
| Oral Cavity | 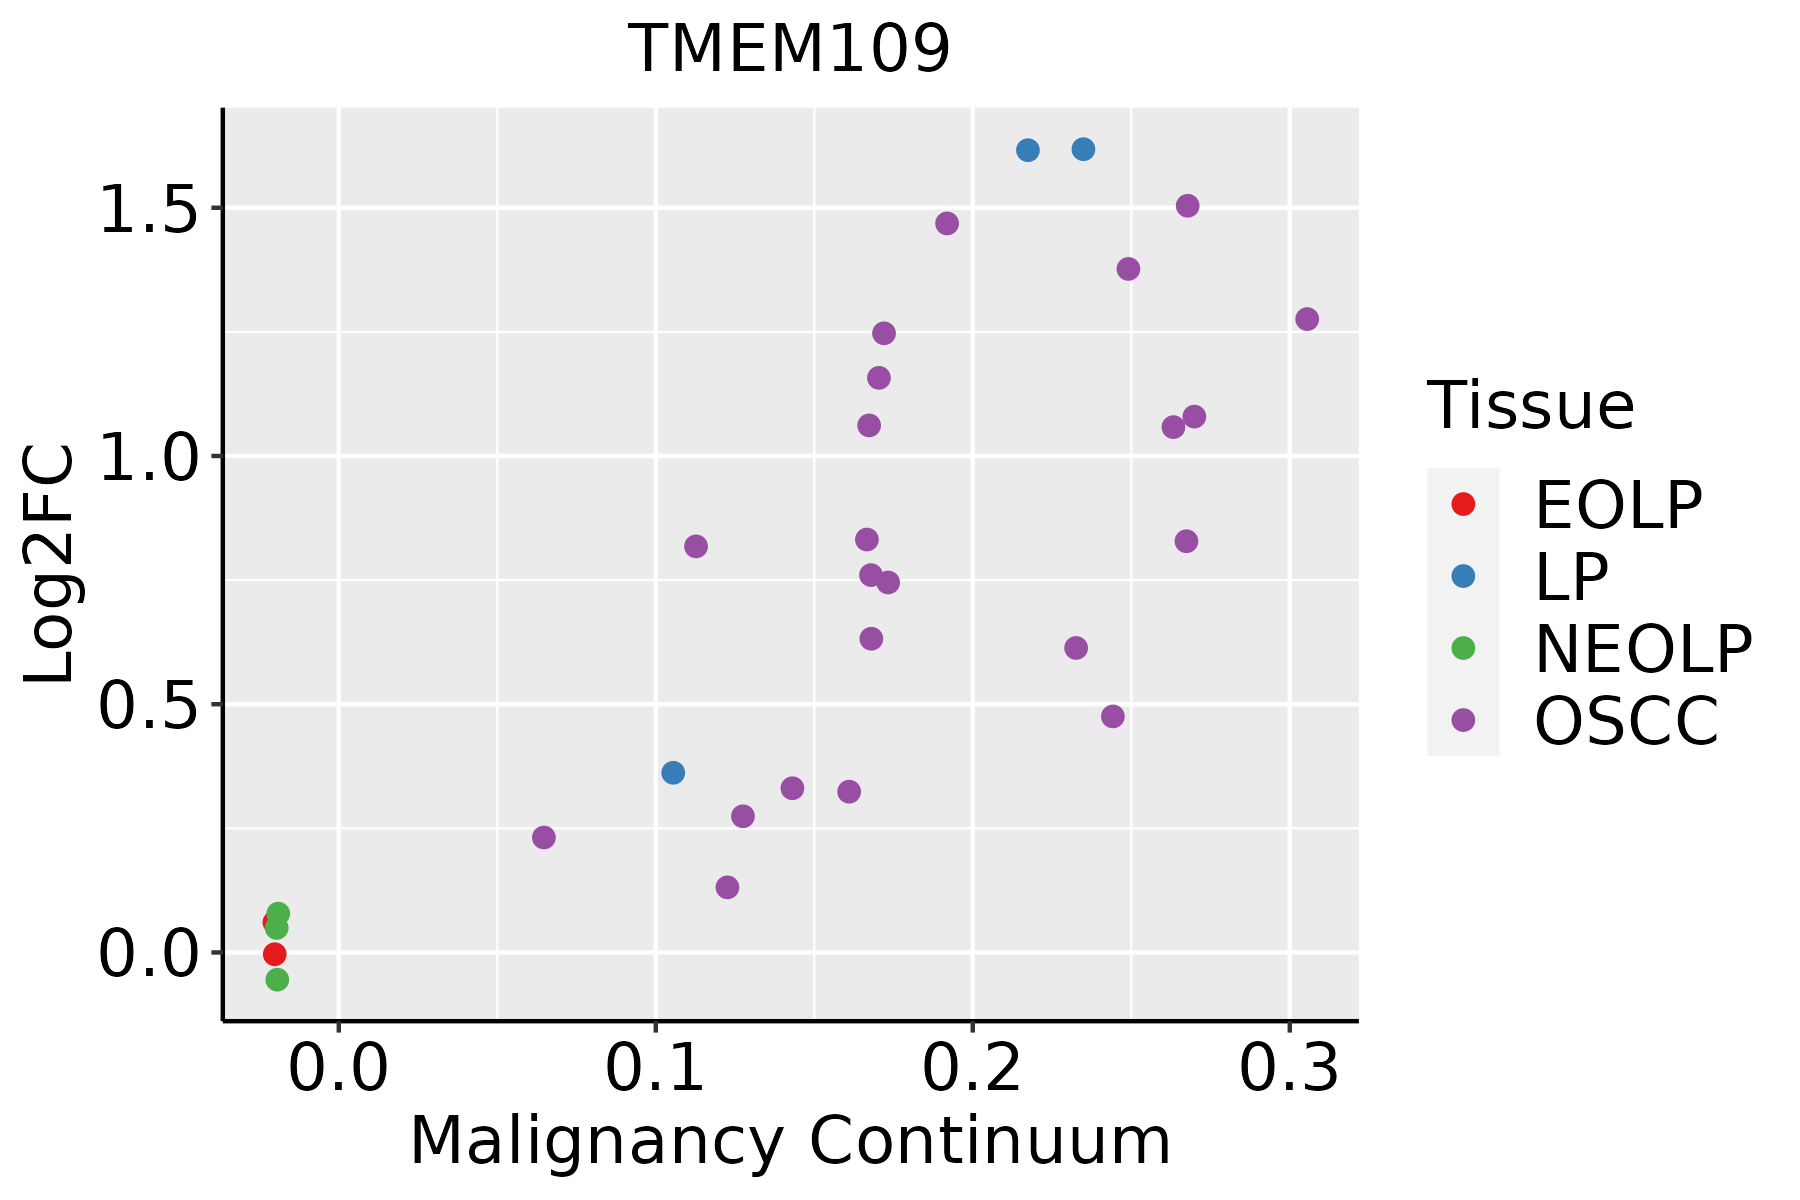 | EOLP: Erosive Oral lichen planus |
| LP: leukoplakia | ||
| NEOLP: Non-erosive oral lichen planus | ||
| OSCC: Oral squamous cell carcinoma | ||
| Skin |  | AK: Actinic keratosis |
| cSCC: Cutaneous squamous cell carcinoma | ||
| SCCIS:squamous cell carcinoma in situ | ||
| Thyroid | 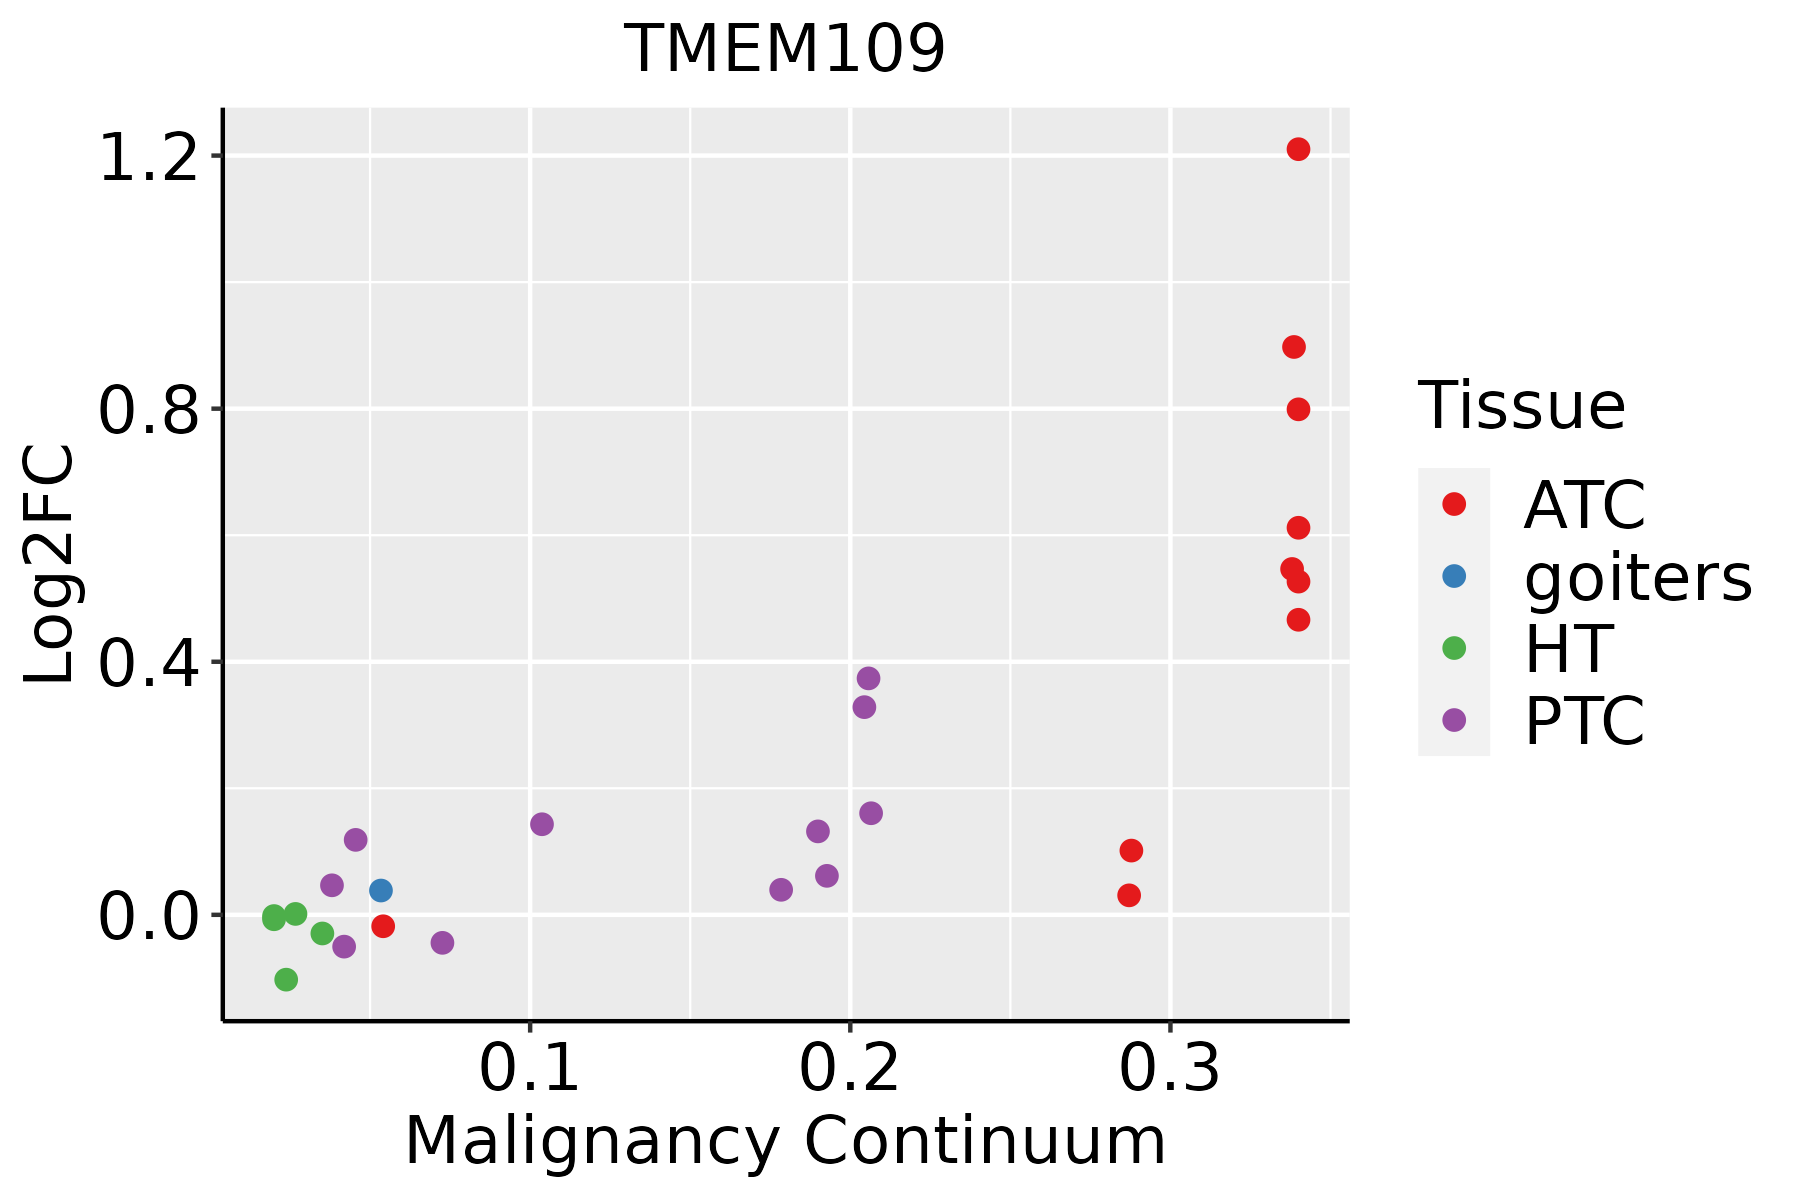 | ATC: Anaplastic thyroid cancer |
| HT: Hashimoto's thyroiditis | ||
| PTC: Papillary thyroid cancer |
| ∗log2FC in expression of this searched gene in stem-like cells from each diseased tissue sample relative to stem-like cells in normal samples in each tissue plotted against the malignancy continuum. Samples are colored based on if they are from different disease stage. |
Top |
Malignant transformation related pathway analysis |
| Find out the enriched GO biological processes and KEGG pathways involved in transition from healthy to precancer to cancer |
| Tissue | Disease Stage | Enriched GO biological Processes |
| Colorectum | AD |  |
| Colorectum | SER |  |
| Colorectum | MSS |  |
| Colorectum | MSI-H |  |
| Colorectum | FAP |  |
| ∗Top 15 enriched GO BP terms are showed in the bar plot of each disease state in each tissue. Each row represents a significant GO biological process which is colored according to the -log10(p.adjust). |
| Page: 1 2 3 4 5 6 7 8 9 |
| GO ID | Tissue | Disease Stage | Description | Gene Ratio | Bg Ratio | pvalue | p.adjust | Count |
| GO:007148018 | Thyroid | PTC | cellular response to gamma radiation | 22/5968 | 31/18723 | 9.07e-06 | 1.03e-04 | 22 |
| GO:00103329 | Thyroid | PTC | response to gamma radiation | 32/5968 | 56/18723 | 8.16e-05 | 6.94e-04 | 32 |
| GO:009719335 | Thyroid | ATC | intrinsic apoptotic signaling pathway | 171/6293 | 288/18723 | 1.86e-19 | 2.67e-17 | 171 |
| GO:007233135 | Thyroid | ATC | signal transduction by p53 class mediator | 102/6293 | 163/18723 | 3.16e-14 | 1.75e-12 | 102 |
| GO:007121427 | Thyroid | ATC | cellular response to abiotic stimulus | 169/6293 | 331/18723 | 3.24e-11 | 1.08e-09 | 169 |
| GO:010400427 | Thyroid | ATC | cellular response to environmental stimulus | 169/6293 | 331/18723 | 3.24e-11 | 1.08e-09 | 169 |
| GO:007147825 | Thyroid | ATC | cellular response to radiation | 101/6293 | 186/18723 | 4.67e-09 | 1.04e-07 | 101 |
| GO:000931426 | Thyroid | ATC | response to radiation | 210/6293 | 456/18723 | 1.69e-08 | 3.39e-07 | 210 |
| GO:007233233 | Thyroid | ATC | intrinsic apoptotic signaling pathway by p53 class mediator | 49/6293 | 76/18723 | 3.60e-08 | 6.67e-07 | 49 |
| GO:0010212110 | Thyroid | ATC | response to ionizing radiation | 82/6293 | 148/18723 | 3.88e-08 | 7.15e-07 | 82 |
| GO:007147927 | Thyroid | ATC | cellular response to ionizing radiation | 46/6293 | 72/18723 | 1.41e-07 | 2.30e-06 | 46 |
| GO:004277131 | Thyroid | ATC | intrinsic apoptotic signaling pathway in response to DNA damage by p53 class mediator | 30/6293 | 43/18723 | 1.36e-06 | 1.71e-05 | 30 |
| GO:000863026 | Thyroid | ATC | intrinsic apoptotic signaling pathway in response to DNA damage | 56/6293 | 99/18723 | 2.22e-06 | 2.63e-05 | 56 |
| GO:007148022 | Thyroid | ATC | cellular response to gamma radiation | 22/6293 | 31/18723 | 2.35e-05 | 2.06e-04 | 22 |
| GO:001033217 | Thyroid | ATC | response to gamma radiation | 34/6293 | 56/18723 | 2.92e-05 | 2.45e-04 | 34 |
| Page: 1 2 3 4 5 6 |
| Pathway ID | Tissue | Disease Stage | Description | Gene Ratio | Bg Ratio | pvalue | p.adjust | qvalue | Count |
| Page: 1 |
Top |
Cell-cell communication analysis |
| Identification of potential cell-cell interactions between two cell types and their ligand-receptor pairs for different disease states |
| Ligand | Receptor | LRpair | Pathway | Tissue | Disease Stage |
| Page: 1 |
Top |
Single-cell gene regulatory network inference analysis |
| Find out the significant the regulons (TFs) and the target genes of each regulon across cell types for different disease states |
| TF | Cell Type | Tissue | Disease Stage | Target Gene | RSS | Regulon Activity |
| ∗The dot plots of a searched regulon are shown for all cell subpopulations in each disease state of each tissue based on the regulon specific score inferred using pySCENIC and by calculating the average expression. |
| Page: 1 |
Top |
Somatic mutation of malignant transformation related genes |
| Annotation of somatic variants for genes involved in malignant transformation |
| Hugo Symbol | Variant Class | Variant Classification | dbSNP RS | HGVSc | HGVSp | HGVSp Short | SWISSPROT | BIOTYPE | SIFT | PolyPhen | Tumor Sample Barcode | Tissue | Histology | Sex | Age | Stage | Therapy Types | Drugs | Outcome |
| TMEM109 | insertion | Nonsense_Mutation | novel | c.531_532insCAGGAAGGAGAGACAGCCTGTTGGCCATCCCTGTAGAC | p.Ser178GlnfsTer12 | p.S178Qfs*12 | Q9BVC6 | protein_coding | TCGA-B6-A0I8-01 | Breast | breast invasive carcinoma | Female | <65 | I/II | Unknown | Unknown | PD | ||
| TMEM109 | insertion | Frame_Shift_Ins | novel | c.98_99insGG | p.Gln34AlafsTer22 | p.Q34Afs*22 | Q9BVC6 | protein_coding | TCGA-BH-A0AY-01 | Breast | breast invasive carcinoma | Female | <65 | I/II | Chemotherapy | SD | |||
| TMEM109 | insertion | Frame_Shift_Ins | novel | c.99_100insAGACAGCCACTGGAGAGTTGGGGCTGGCACAGAA | p.Gln34ArgfsTer30 | p.Q34Rfs*30 | Q9BVC6 | protein_coding | TCGA-BH-A0AY-01 | Breast | breast invasive carcinoma | Female | <65 | I/II | Chemotherapy | SD | |||
| TMEM109 | insertion | Nonsense_Mutation | novel | c.136_137insGGGTCATCCTATGGCAGAAGGCAGAACCCAGCACATG | p.Lys46ArgfsTer13 | p.K46Rfs*13 | Q9BVC6 | protein_coding | TCGA-BH-A0DS-01 | Breast | breast invasive carcinoma | Female | >=65 | III/IV | Chemotherapy | cyclophosphamide | SD | ||
| TMEM109 | deletion | Frame_Shift_Del | novel | c.29delN | p.Gly11GlufsTer9 | p.G11Efs*9 | Q9BVC6 | protein_coding | TCGA-2W-A8YY-01 | Cervix | cervical & endocervical cancer | Female | <65 | I/II | Chemotherapy | cisplatin | CR | ||
| TMEM109 | SNV | Missense_Mutation | c.690N>T | p.Gln230His | p.Q230H | Q9BVC6 | protein_coding | deleterious(0) | possibly_damaging(0.81) | TCGA-A6-5665-01 | Colorectum | colon adenocarcinoma | Female | >=65 | I/II | Unknown | Unknown | PD | |
| TMEM109 | SNV | Missense_Mutation | novel | c.553C>T | p.Arg185Trp | p.R185W | Q9BVC6 | protein_coding | deleterious(0) | benign(0.023) | TCGA-AA-3947-01 | Colorectum | colon adenocarcinoma | Female | <65 | I/II | Unknown | Unknown | SD |
| TMEM109 | SNV | Missense_Mutation | c.298T>C | p.Ser100Pro | p.S100P | Q9BVC6 | protein_coding | tolerated(0.23) | probably_damaging(0.992) | TCGA-AY-6196-01 | Colorectum | colon adenocarcinoma | Male | <65 | III/IV | Unknown | Unknown | SD | |
| TMEM109 | SNV | Missense_Mutation | novel | c.50C>T | p.Ala17Val | p.A17V | Q9BVC6 | protein_coding | tolerated_low_confidence(0.7) | benign(0.001) | TCGA-AZ-4315-01 | Colorectum | colon adenocarcinoma | Male | <65 | I/II | Unknown | Unknown | SD |
| TMEM109 | SNV | Missense_Mutation | rs753654818 | c.310N>A | p.Ala104Thr | p.A104T | Q9BVC6 | protein_coding | deleterious(0.04) | benign(0.029) | TCGA-F4-6856-01 | Colorectum | colon adenocarcinoma | Male | <65 | I/II | Ancillary | leucovorin | CR |
| Page: 1 2 3 4 |
Top |
Related drugs of malignant transformation related genes |
| Identification of chemicals and drugs interact with genes involved in malignant transfromation |
| (DGIdb 4.0) |
| Entrez ID | Symbol | Category | Interaction Types | Drug Claim Name | Drug Name | PMIDs |
| Page: 1 |

Copyright 2023-Present -The University of Texas Health Science Center at Houston |