Schematic overview of the cellular and molecular mechanisms involved in the cancer progression, including the proposed cellular and molecular mechanisms in cancer cells trajectory. AT1: alveolar type 1 cells; AT2: alveolar type 2 cells; AAH: atypical adenomatous hyperplasia; AIS: adenocarcinoma in situ; MIA: minimally invasive adenocarcinoma; IA: invasive adenocarcinoma; EMT: epithelial-mesenchymal transition

Home

Download

Statistics

Help

Contact

Center for Computational Systems Medicine
leaf

Gene summary

leaf

Malignant transformation analysis

leaf

Malignant transformation related pathway analysis

leaf

Cell-cell communication analysis

leaf

Single-cell gene regulatory network inference analysis

leaf

Somatic mutation of malignant transformation related genes

leaf

Related drugs of malignant transformation related genes

Gene: TINF2

Gene summary for TINF2

check button Gene summary.

Gene informationSpeciesHuman
Gene symbol

TINF2

Gene ID

26277

Gene nameTERF1 interacting nuclear factor 2
Gene AliasDKCA3
Cytomap14q12
Gene Typeprotein-coding
GO ID

GO:0000723

UniProtAcc

Q9BSI4


Top

Malignant transformation analysis

check button Identification of the aberrant gene expression in precancerous and cancerous lesions by comparing the gene expression of stem-like cells in diseased tissues with normal stem cells
check button Malignant transformation involving gene list.
Entrez IDSymbolReplicatesSpeciesOrganTissueAdj P-valueLog2FCMalignancy
26277TINF2LZE4THumanEsophagusESCC7.58e-103.12e-010.0811
26277TINF2LZE7THumanEsophagusESCC6.93e-041.98e-010.0667
26277TINF2LZE8THumanEsophagusESCC1.04e-061.70e-010.067
26277TINF2LZE20THumanEsophagusESCC5.58e-061.65e-010.0662
26277TINF2LZE22THumanEsophagusESCC8.47e-031.15e-010.068
26277TINF2LZE24THumanEsophagusESCC4.45e-236.33e-010.0596
26277TINF2LZE6THumanEsophagusESCC5.34e-052.46e-010.0845
26277TINF2P1T-EHumanEsophagusESCC3.13e-092.78e-010.0875
26277TINF2P2T-EHumanEsophagusESCC1.17e-172.73e-010.1177
26277TINF2P4T-EHumanEsophagusESCC4.15e-285.73e-010.1323
26277TINF2P5T-EHumanEsophagusESCC1.09e-153.17e-010.1327
26277TINF2P8T-EHumanEsophagusESCC1.26e-213.94e-010.0889
26277TINF2P9T-EHumanEsophagusESCC1.16e-163.26e-010.1131
26277TINF2P10T-EHumanEsophagusESCC2.37e-193.30e-010.116
26277TINF2P11T-EHumanEsophagusESCC6.51e-116.90e-010.1426
26277TINF2P12T-EHumanEsophagusESCC3.85e-561.04e+000.1122
26277TINF2P15T-EHumanEsophagusESCC1.04e-367.94e-010.1149
26277TINF2P16T-EHumanEsophagusESCC7.68e-182.11e-010.1153
26277TINF2P17T-EHumanEsophagusESCC4.42e-125.89e-010.1278
26277TINF2P19T-EHumanEsophagusESCC5.95e-085.12e-010.1662
Page: 1 2 3 4 5 6 

check button Transcriptomic changes along malignancy continuum.
TissueExpression DynamicsAbbreviation
EsophagusThe image shows the transcriptomic changes along malignancy continuum.log2FC in expression of this searched gene in stem-like cells from each diseased tissue sample relative to stem-like cells in normal samples in each tissue plotted against the malignancy continuum. Samples are colored based on if they are from different disease stage.
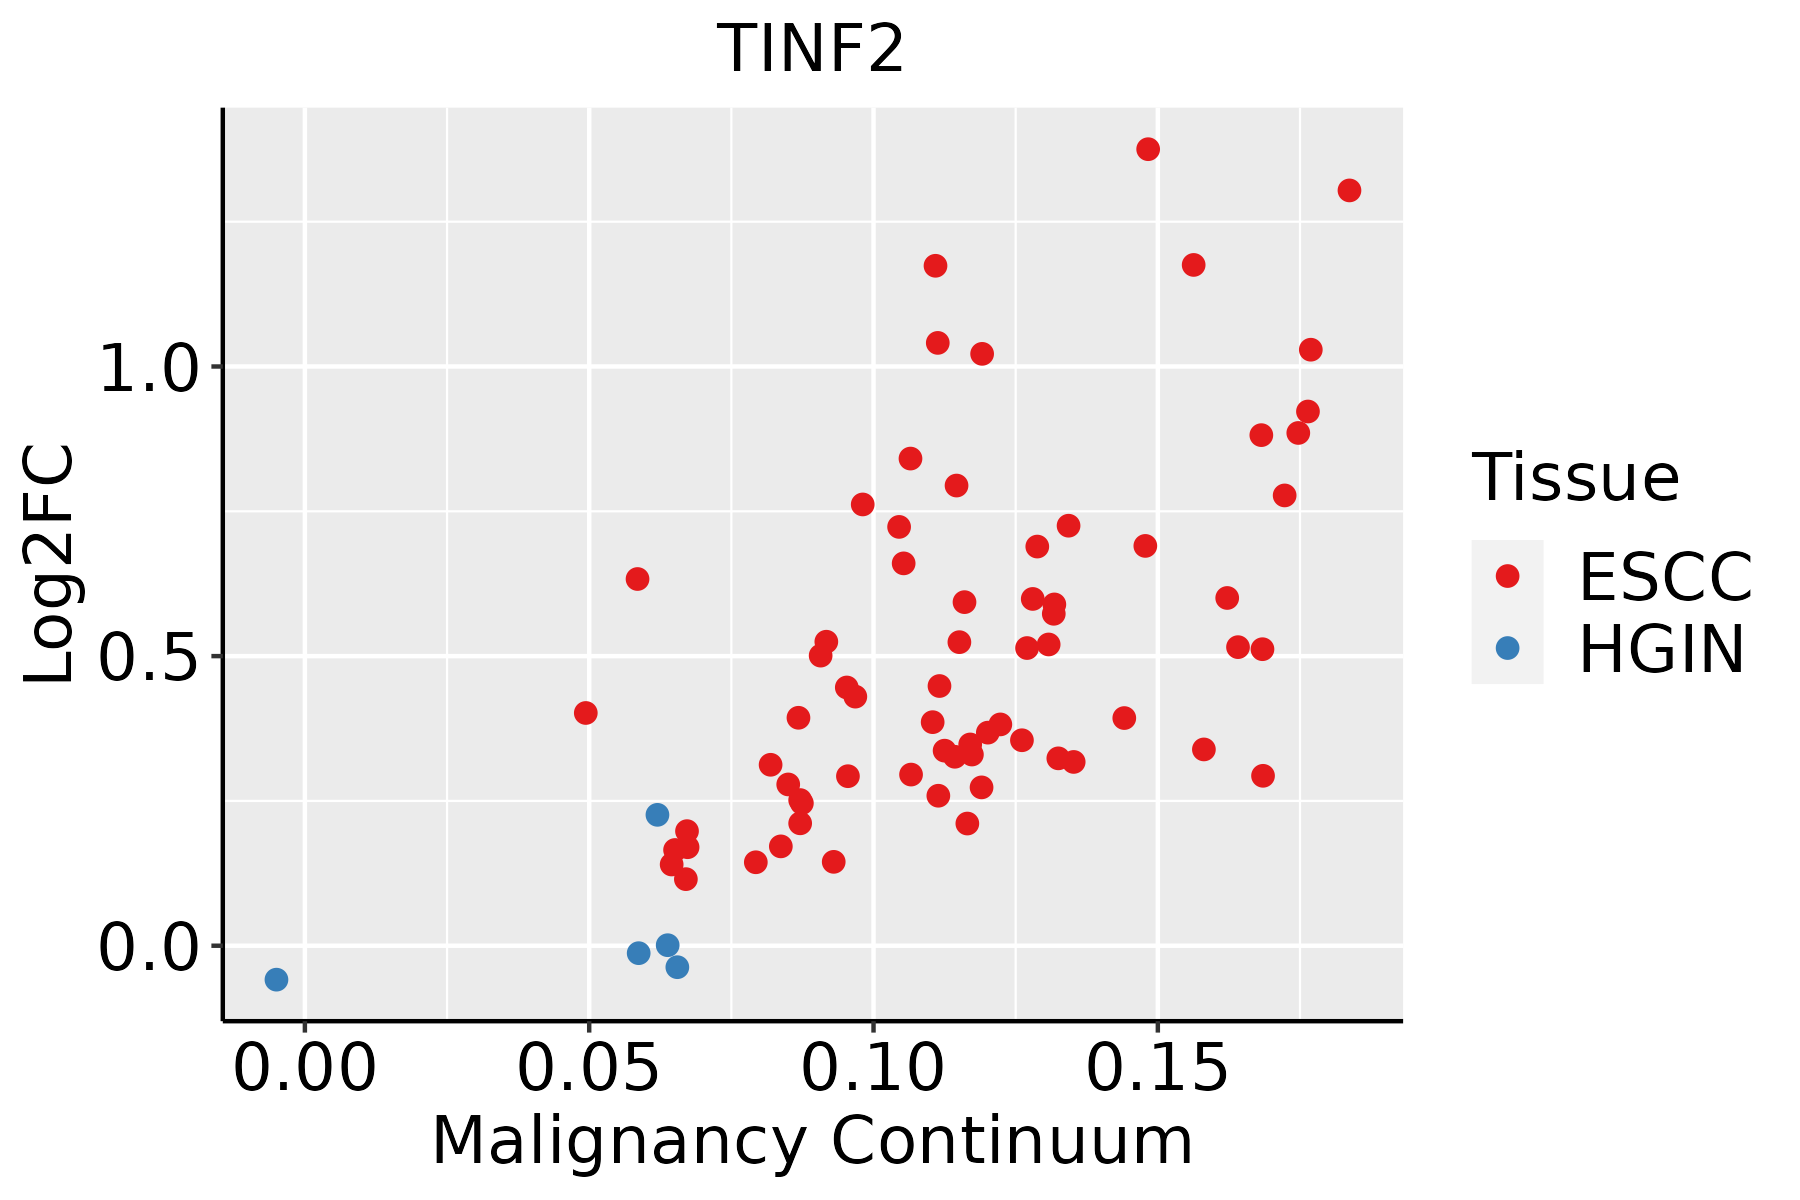
ESCC: Esophageal squamous cell carcinoma
HGIN: High-grade intraepithelial neoplasias
LGIN: Low-grade intraepithelial neoplasias
LiverThe image shows the transcriptomic changes along malignancy continuum.log2FC in expression of this searched gene in stem-like cells from each diseased tissue sample relative to stem-like cells in normal samples in each tissue plotted against the malignancy continuum. Samples are colored based on if they are from different disease stage.HCC: Hepatocellular carcinoma
NAFLD: Non-alcoholic fatty liver disease
Oral CavityThe image shows the transcriptomic changes along malignancy continuum.log2FC in expression of this searched gene in stem-like cells from each diseased tissue sample relative to stem-like cells in normal samples in each tissue plotted against the malignancy continuum. Samples are colored based on if they are from different disease stage.
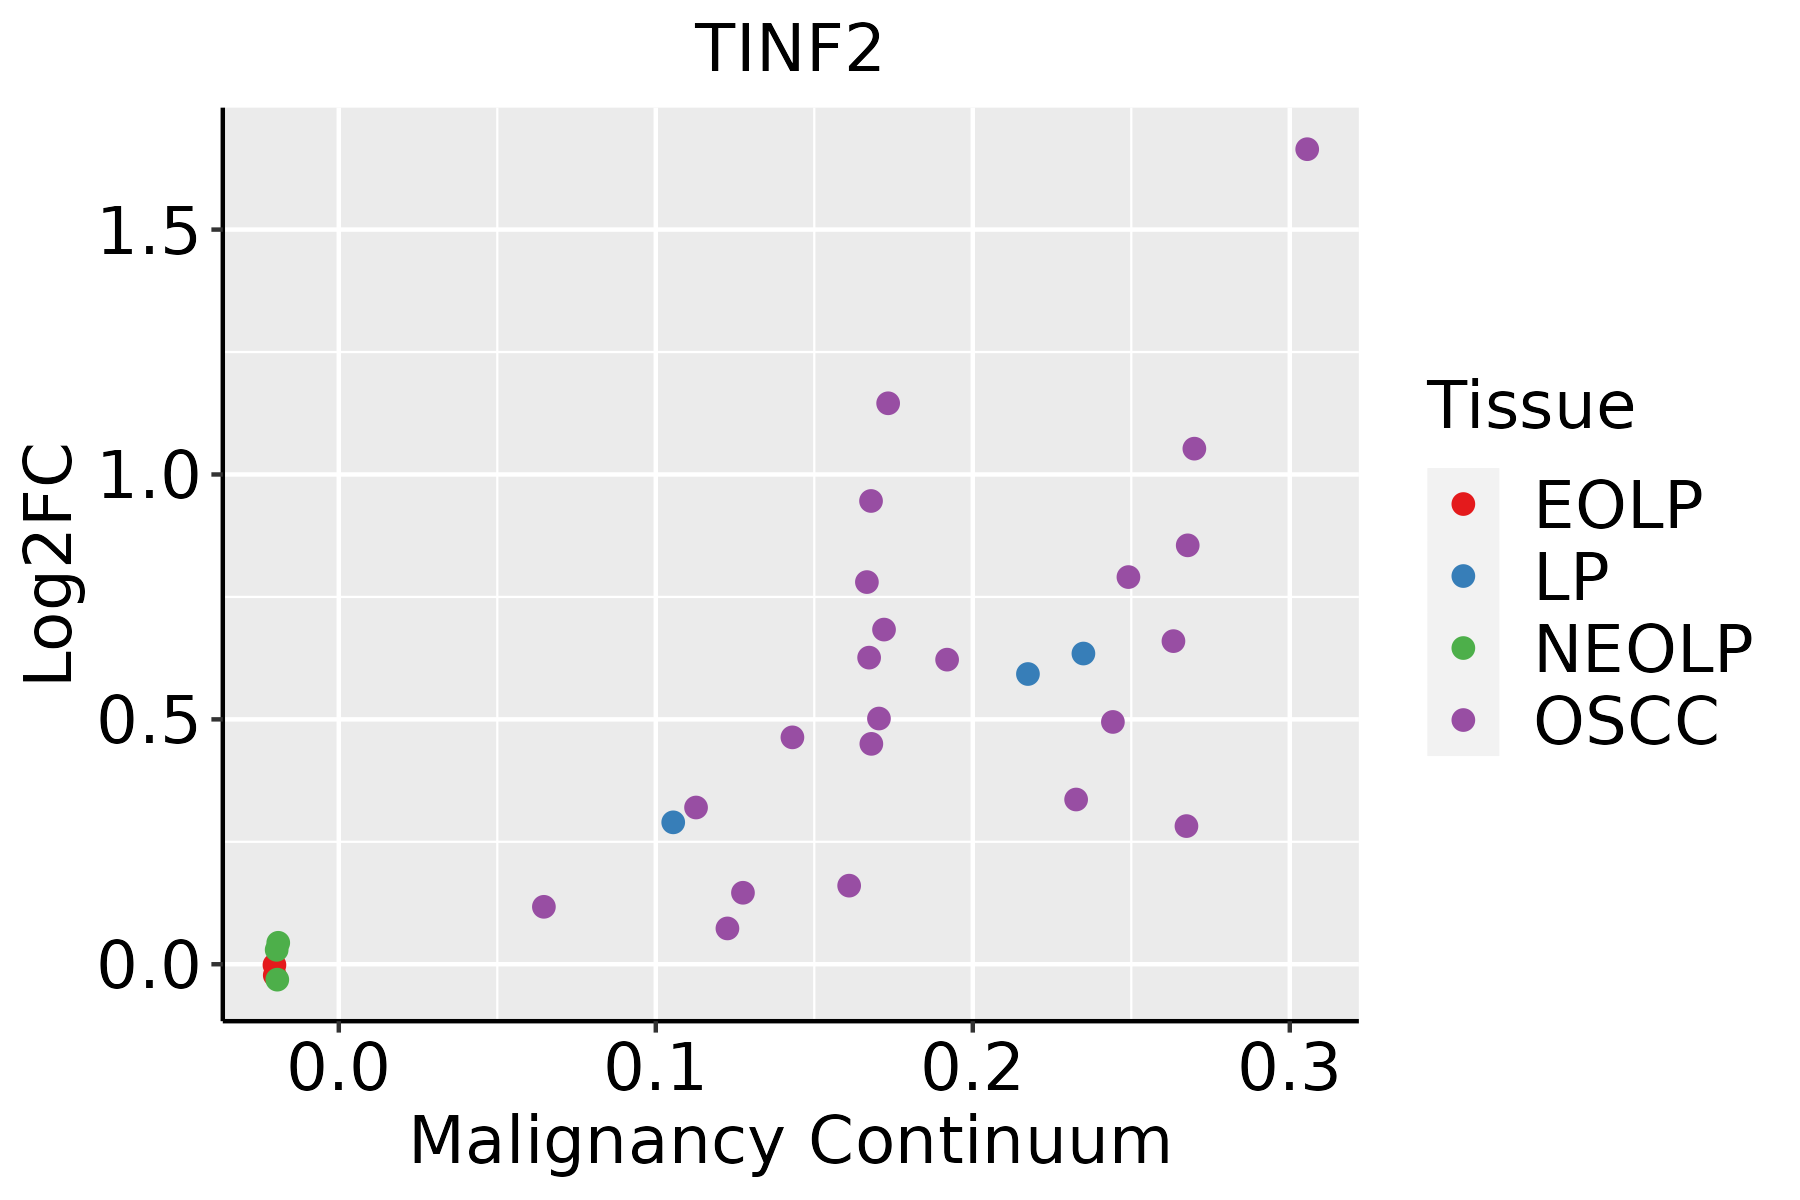
EOLP: Erosive Oral lichen planus
LP: leukoplakia
NEOLP: Non-erosive oral lichen planus
OSCC: Oral squamous cell carcinoma
SkinThe image shows the transcriptomic changes along malignancy continuum.log2FC in expression of this searched gene in stem-like cells from each diseased tissue sample relative to stem-like cells in normal samples in each tissue plotted against the malignancy continuum. Samples are colored based on if they are from different disease stage.
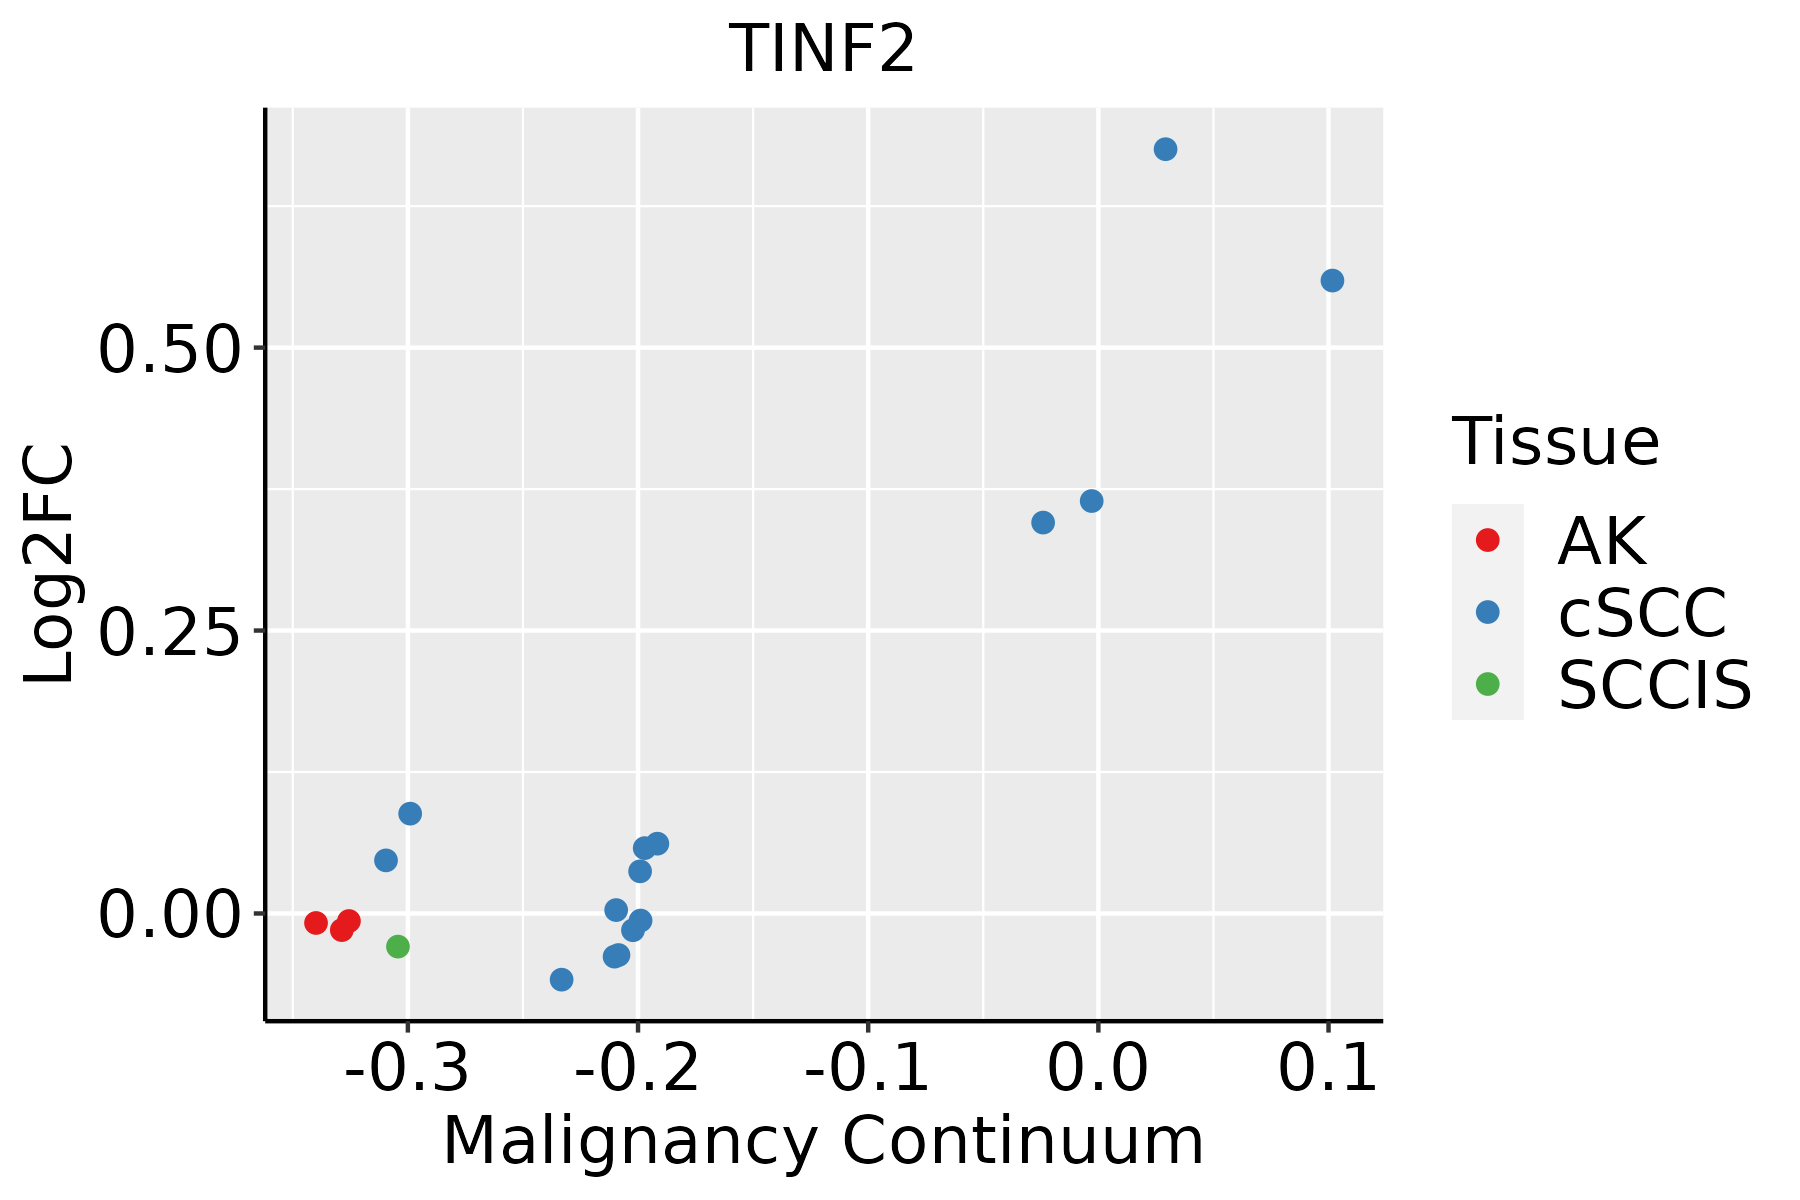
AK: Actinic keratosis
cSCC: Cutaneous squamous cell carcinoma
SCCIS:squamous cell carcinoma in situ
ThyroidThe image shows the transcriptomic changes along malignancy continuum.log2FC in expression of this searched gene in stem-like cells from each diseased tissue sample relative to stem-like cells in normal samples in each tissue plotted against the malignancy continuum. Samples are colored based on if they are from different disease stage.ATC: Anaplastic thyroid cancer
HT: Hashimoto's thyroiditis
PTC: Papillary thyroid cancer
∗log2FC in expression of this searched gene in stem-like cells from each diseased tissue sample relative to stem-like cells in normal samples in each tissue plotted against the malignancy continuum. Samples are colored based on if they are from different disease stage.

Top

Malignant transformation related pathway analysis

check buttonFind out the enriched GO biological processes and KEGG pathways involved in transition from healthy to precancer to cancer
check button Figure of enriched GO biological processes.
TissueDisease StageEnriched GO biological Processes
ColorectumADGO analysis - Figure of enriched GO biological processes: Top 15 enriched GO BP terms are showed in the bar plot of each disease state in each tissue. Each row represents a significant GO biological process which is colored according to the -log10(p.adjust).
ColorectumSERGO analysis - Figure of enriched GO biological processes: Top 15 enriched GO BP terms are showed in the bar plot of each disease state in each tissue. Each row represents a significant GO biological process which is colored according to the -log10(p.adjust).
ColorectumMSSGO analysis - Figure of enriched GO biological processes: Top 15 enriched GO BP terms are showed in the bar plot of each disease state in each tissue. Each row represents a significant GO biological process which is colored according to the -log10(p.adjust).
ColorectumMSI-HGO analysis - Figure of enriched GO biological processes: Top 15 enriched GO BP terms are showed in the bar plot of each disease state in each tissue. Each row represents a significant GO biological process which is colored according to the -log10(p.adjust).
ColorectumFAPGO analysis - Figure of enriched GO biological processes: Top 15 enriched GO BP terms are showed in the bar plot of each disease state in each tissue. Each row represents a significant GO biological process which is colored according to the -log10(p.adjust).
∗Top 15 enriched GO BP terms are showed in the bar plot of each disease state in each tissue. Each row represents a significant GO biological process which is colored according to the -log10(p.adjust).
Page: 1 2 3 4 5 6 7 8 9 

check button Enriched GO biological processes.
GO IDTissueDisease StageDescriptionGene RatioBg Ratiopvaluep.adjustCount
GO:190435618SkincSCCregulation of telomere maintenance via telomere lengthening32/486461/187239.07e-061.19e-0432
GO:00701988SkincSCCprotein localization to chromosome, telomeric region17/486429/187232.00e-041.67e-0317
GO:005067324SkincSCCepithelial cell proliferation144/4864437/187236.07e-044.38e-03144
GO:2000279SkincSCCnegative regulation of DNA biosynthetic process17/486438/187239.41e-034.25e-0217
GO:003304419ThyroidPTCregulation of chromosome organization102/5968187/187231.04e-103.58e-09102
GO:005105218ThyroidPTCregulation of DNA metabolic process171/5968359/187232.52e-108.33e-09171
GO:0032204110ThyroidPTCregulation of telomere maintenance52/596880/187231.15e-093.34e-0852
GO:0010639112ThyroidPTCnegative regulation of organelle organization163/5968348/187233.04e-098.39e-08163
GO:0000723111ThyroidPTCtelomere maintenance74/5968131/187234.85e-091.26e-0774
GO:0007004111ThyroidPTCtelomere maintenance via telomerase43/596869/187231.88e-073.48e-0643
GO:00701989ThyroidPTCprotein localization to chromosome, telomeric region22/596829/187231.44e-062.04e-0522
GO:0010833111ThyroidPTCtelomere maintenance via telomere lengthening46/596881/187233.10e-064.04e-0546
GO:0006278110ThyroidPTCRNA-dependent DNA biosynthetic process43/596875/187234.61e-065.66e-0543
GO:003221010ThyroidPTCregulation of telomere maintenance via telomerase33/596853/187235.10e-066.20e-0533
GO:190435619ThyroidPTCregulation of telomere maintenance via telomere lengthening36/596861/187231.11e-051.22e-0436
GO:2000278112ThyroidPTCregulation of DNA biosynthetic process55/5968106/187231.45e-051.55e-0455
GO:00322009ThyroidPTCtelomere organization74/5968159/187237.46e-056.43e-0474
GO:0071897110ThyroidPTCDNA biosynthetic process82/5968180/187237.98e-056.81e-0482
GO:20012515ThyroidPTCnegative regulation of chromosome organization43/596886/187233.49e-042.40e-0343
GO:00322053ThyroidPTCnegative regulation of telomere maintenance20/596835/187231.75e-039.51e-0320
Page: 1 2 3 4 5 6 7 8 

check button Enriched KEGG pathways.
Pathway IDTissueDisease StageDescriptionGene RatioBg Ratiopvaluep.adjustqvalueCount
Page: 1 

Top

Cell-cell communication analysis

check buttonIdentification of potential cell-cell interactions between two cell types and their ligand-receptor pairs for different disease states
LigandReceptorLRpairPathwayTissueDisease Stage
Page: 1 

Top

Single-cell gene regulatory network inference analysis

check buttonFind out the significant the regulons (TFs) and the target genes of each regulon across cell types for different disease states
TFCell TypeTissueDisease StageTarget GeneRSSRegulon Activity
∗The dot plots of a searched regulon are shown for all cell subpopulations in each disease state of each tissue based on the regulon specific score inferred using pySCENIC and by calculating the average expression.
Page: 1 

Top

Somatic mutation of malignant transformation related genes

check buttonAnnotation of somatic variants for genes involved in malignant transformation
Hugo SymbolVariant ClassVariant ClassificationdbSNP RSHGVScHGVSpHGVSp ShortSWISSPROTBIOTYPESIFTPolyPhenTumor Sample BarcodeTissueHistologySexAgeStageTherapy TypesDrugsOutcome
TINF2SNVMissense_Mutationnovelc.1154N>Gp.Ser385Cysp.S385CQ9BSI4protein_codingdeleterious_low_confidence(0.01)possibly_damaging(0.77)TCGA-AC-A3BB-01Breastbreast invasive carcinomaFemale<65III/IVChemotherapycytoxanCR
TINF2insertionIn_Frame_Insnovelc.204_205insAATCCTCCTCAGCAACAAAGACTAGCAp.Glu68_Leu69insAsnProProGlnGlnGlnArgLeuAlap.E68_L69insNPPQQQRLAQ9BSI4protein_codingTCGA-A7-A0D9-01Breastbreast invasive carcinomaFemale<65I/IIChemotherapytaxotereSD
TINF2insertionFrame_Shift_Insnovelc.660_661insACACACAGAGCp.Gln221ThrfsTer9p.Q221Tfs*9Q9BSI4protein_codingTCGA-A8-A07U-01Breastbreast invasive carcinomaFemale>=65III/IVChemotherapy5-fluorouracilSD
TINF2insertionFrame_Shift_Insnovelc.659_660insAGTTTTCTTCCGAGTAGp.Gln221ValfsTer11p.Q221Vfs*11Q9BSI4protein_codingTCGA-A8-A07U-01Breastbreast invasive carcinomaFemale>=65III/IVChemotherapy5-fluorouracilSD
TINF2insertionIn_Frame_Insnovelc.265_266insCTTCAGGATGTGCTGAGTTGGATGCAGCCTGGAGTCTCTATCp.Glu89delinsAlaSerGlyCysAlaGluLeuAspAlaAlaTrpSerLeuTyrGlnp.E89delinsASGCAELDAAWSLYQQ9BSI4protein_codingTCGA-A8-A07U-01Breastbreast invasive carcinomaFemale>=65III/IVChemotherapy5-fluorouracilSD
TINF2insertionFrame_Shift_Insnovelc.72_73insTCTAAAACCTp.Gly25SerfsTer115p.G25Sfs*115Q9BSI4protein_codingTCGA-A8-A09X-01Breastbreast invasive carcinomaFemale<65III/IVUnknownUnknownSD
TINF2deletionFrame_Shift_Delnovelc.33_36delNNNNp.Leu12AlafsTer49p.L12Afs*49Q9BSI4protein_codingTCGA-AQ-A04J-01Breastbreast invasive carcinomaFemale<65I/IIChemotherapycytoxanSD
TINF2SNVMissense_Mutationrs780611874c.25N>Tp.Pro9Serp.P9SQ9BSI4protein_codingdeleterious(0.04)benign(0.189)TCGA-C5-A1MN-01Cervixcervical & endocervical cancerFemale<65III/IVChemotherapycisplatinSD
TINF2SNVMissense_Mutationc.791N>Ap.Gly264Aspp.G264DQ9BSI4protein_codingdeleterious_low_confidence(0)probably_damaging(1)TCGA-AA-3672-01Colorectumcolon adenocarcinomaFemale>=65III/IVUnknownUnknownSD
TINF2SNVMissense_Mutationc.29N>Tp.Ala10Valp.A10VQ9BSI4protein_codingtolerated(0.05)benign(0.303)TCGA-CK-4951-01Colorectumcolon adenocarcinomaFemale>=65I/IIUnknownUnknownPD
Page: 1 2 3 4 

Top

Related drugs of malignant transformation related genes

check buttonIdentification of chemicals and drugs interact with genes involved in malignant transfromation
(DGIdb 4.0)
Entrez IDSymbolCategoryInteraction TypesDrug Claim NameDrug NamePMIDs
Page: 1