Schematic overview of the cellular and molecular mechanisms involved in the cancer progression, including the proposed cellular and molecular mechanisms in cancer cells trajectory. AT1: alveolar type 1 cells; AT2: alveolar type 2 cells; AAH: atypical adenomatous hyperplasia; AIS: adenocarcinoma in situ; MIA: minimally invasive adenocarcinoma; IA: invasive adenocarcinoma; EMT: epithelial-mesenchymal transition

Home

Download

Statistics

Help

Contact

Center for Computational Systems Medicine
leaf

Gene summary

leaf

Malignant transformation analysis

leaf

Malignant transformation related pathway analysis

leaf

Cell-cell communication analysis

leaf

Single-cell gene regulatory network inference analysis

leaf

Somatic mutation of malignant transformation related genes

leaf

Related drugs of malignant transformation related genes

Gene: TIMM17A

Gene summary for TIMM17A

check button Gene summary.

Gene informationSpeciesHuman
Gene symbol

TIMM17A

Gene ID

10440

Gene nametranslocase of inner mitochondrial membrane 17A
Gene AliasTIM17
Cytomap1q32.1
Gene Typeprotein-coding
GO ID

GO:0006508

UniProtAcc

Q99595


Top

Malignant transformation analysis

check button Identification of the aberrant gene expression in precancerous and cancerous lesions by comparing the gene expression of stem-like cells in diseased tissues with normal stem cells
check button Malignant transformation involving gene list.
Entrez IDSymbolReplicatesSpeciesOrganTissueAdj P-valueLog2FCMalignancy
10440TIMM17ALZE2THumanEsophagusESCC3.13e-041.17e+000.082
10440TIMM17ALZE4THumanEsophagusESCC6.13e-175.45e-010.0811
10440TIMM17ALZE5THumanEsophagusESCC8.79e-033.38e-010.0514
10440TIMM17ALZE7THumanEsophagusESCC1.64e-079.13e-010.0667
10440TIMM17ALZE8THumanEsophagusESCC2.27e-082.59e-010.067
10440TIMM17ALZE20THumanEsophagusESCC2.38e-071.54e-010.0662
10440TIMM17ALZE22D1HumanEsophagusHGIN8.26e-05-3.58e-020.0595
10440TIMM17ALZE24THumanEsophagusESCC8.04e-103.78e-010.0596
10440TIMM17ALZE6THumanEsophagusESCC5.46e-041.46e-010.0845
10440TIMM17AP2T-EHumanEsophagusESCC6.92e-246.27e-010.1177
10440TIMM17AP4T-EHumanEsophagusESCC7.77e-521.40e+000.1323
10440TIMM17AP5T-EHumanEsophagusESCC3.60e-521.39e+000.1327
10440TIMM17AP8T-EHumanEsophagusESCC5.44e-234.57e-010.0889
10440TIMM17AP9T-EHumanEsophagusESCC3.23e-279.10e-010.1131
10440TIMM17AP10T-EHumanEsophagusESCC1.51e-571.13e+000.116
10440TIMM17AP11T-EHumanEsophagusESCC2.54e-138.71e-010.1426
10440TIMM17AP12T-EHumanEsophagusESCC1.06e-154.80e-010.1122
10440TIMM17AP15T-EHumanEsophagusESCC2.46e-277.62e-010.1149
10440TIMM17AP16T-EHumanEsophagusESCC9.20e-288.27e-010.1153
10440TIMM17AP17T-EHumanEsophagusESCC1.36e-084.12e-010.1278
Page: 1 2 3 4 5 6 7 

check button Transcriptomic changes along malignancy continuum.
TissueExpression DynamicsAbbreviation
EsophagusThe image shows the transcriptomic changes along malignancy continuum.log2FC in expression of this searched gene in stem-like cells from each diseased tissue sample relative to stem-like cells in normal samples in each tissue plotted against the malignancy continuum. Samples are colored based on if they are from different disease stage.
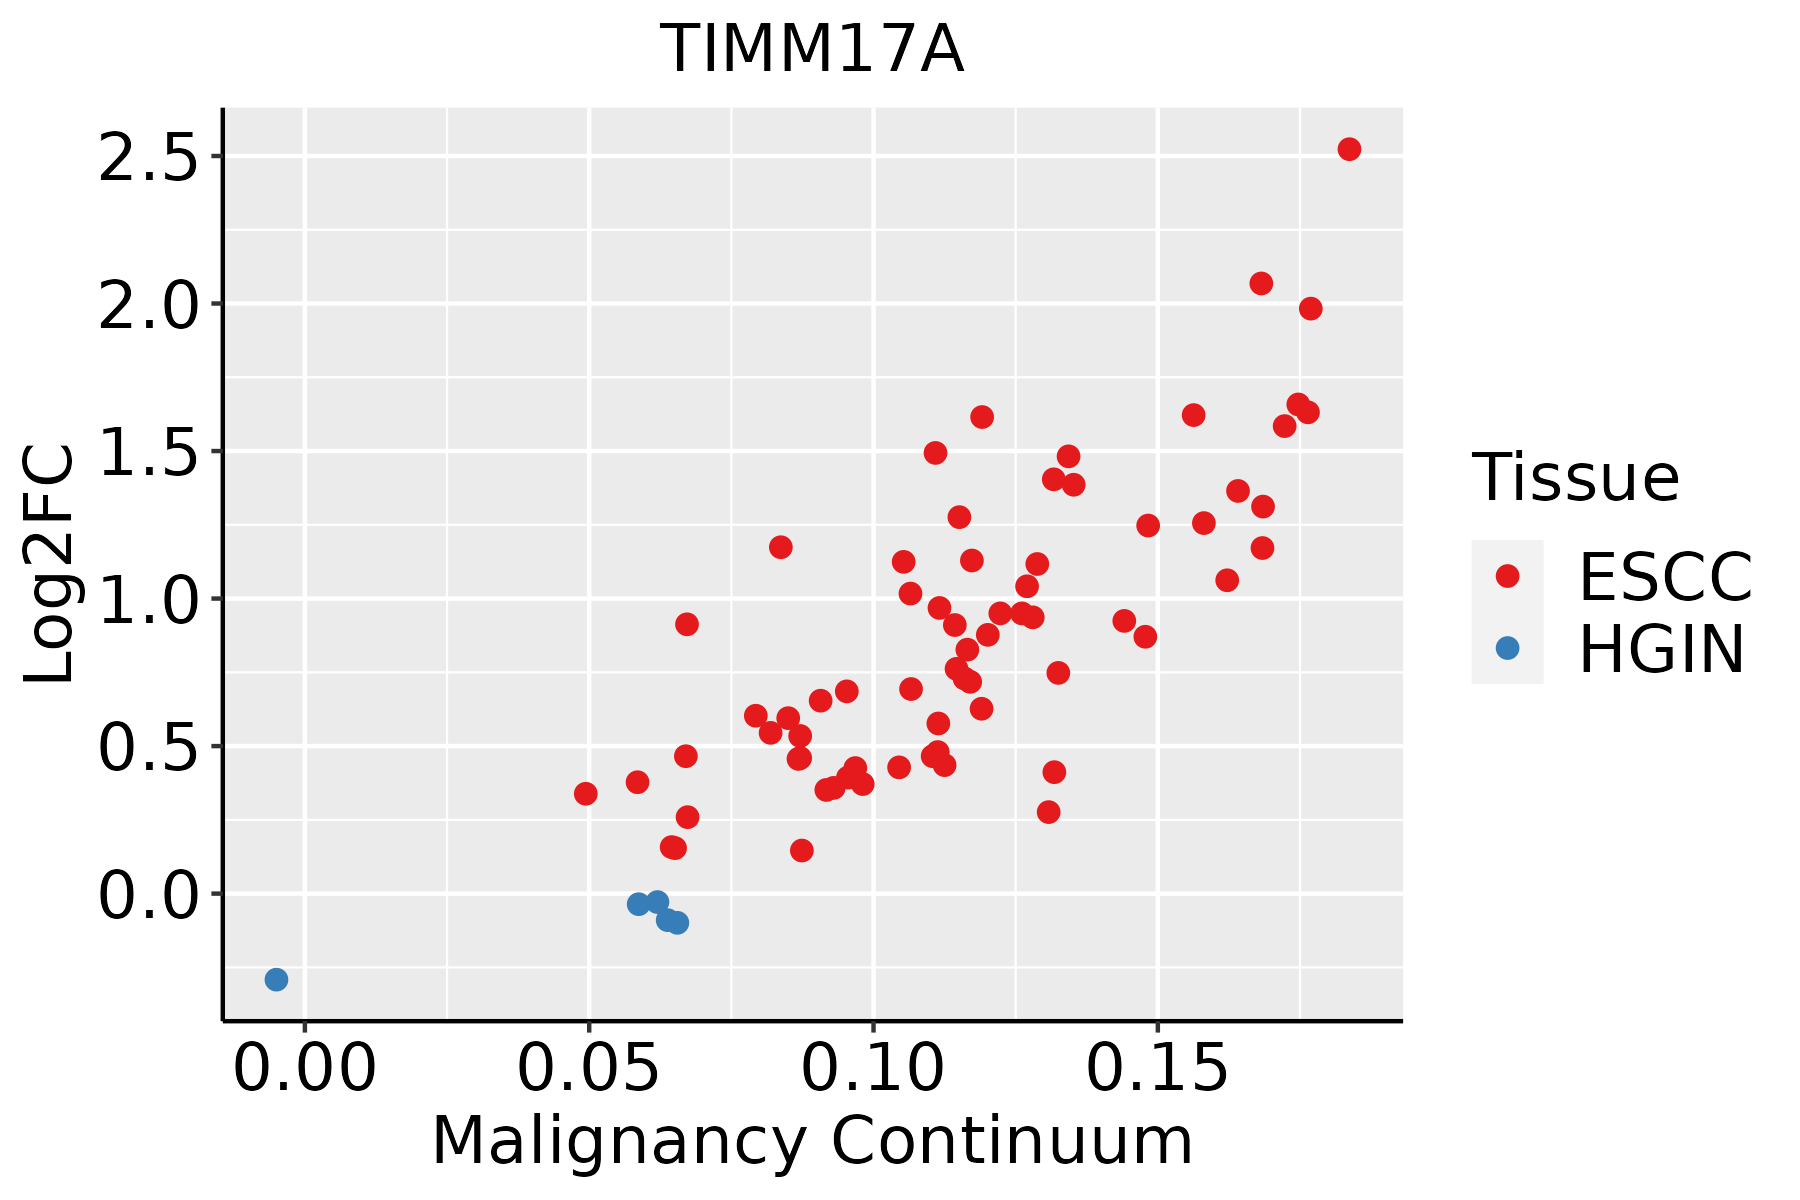
ESCC: Esophageal squamous cell carcinoma
HGIN: High-grade intraepithelial neoplasias
LGIN: Low-grade intraepithelial neoplasias
LiverThe image shows the transcriptomic changes along malignancy continuum.log2FC in expression of this searched gene in stem-like cells from each diseased tissue sample relative to stem-like cells in normal samples in each tissue plotted against the malignancy continuum. Samples are colored based on if they are from different disease stage.
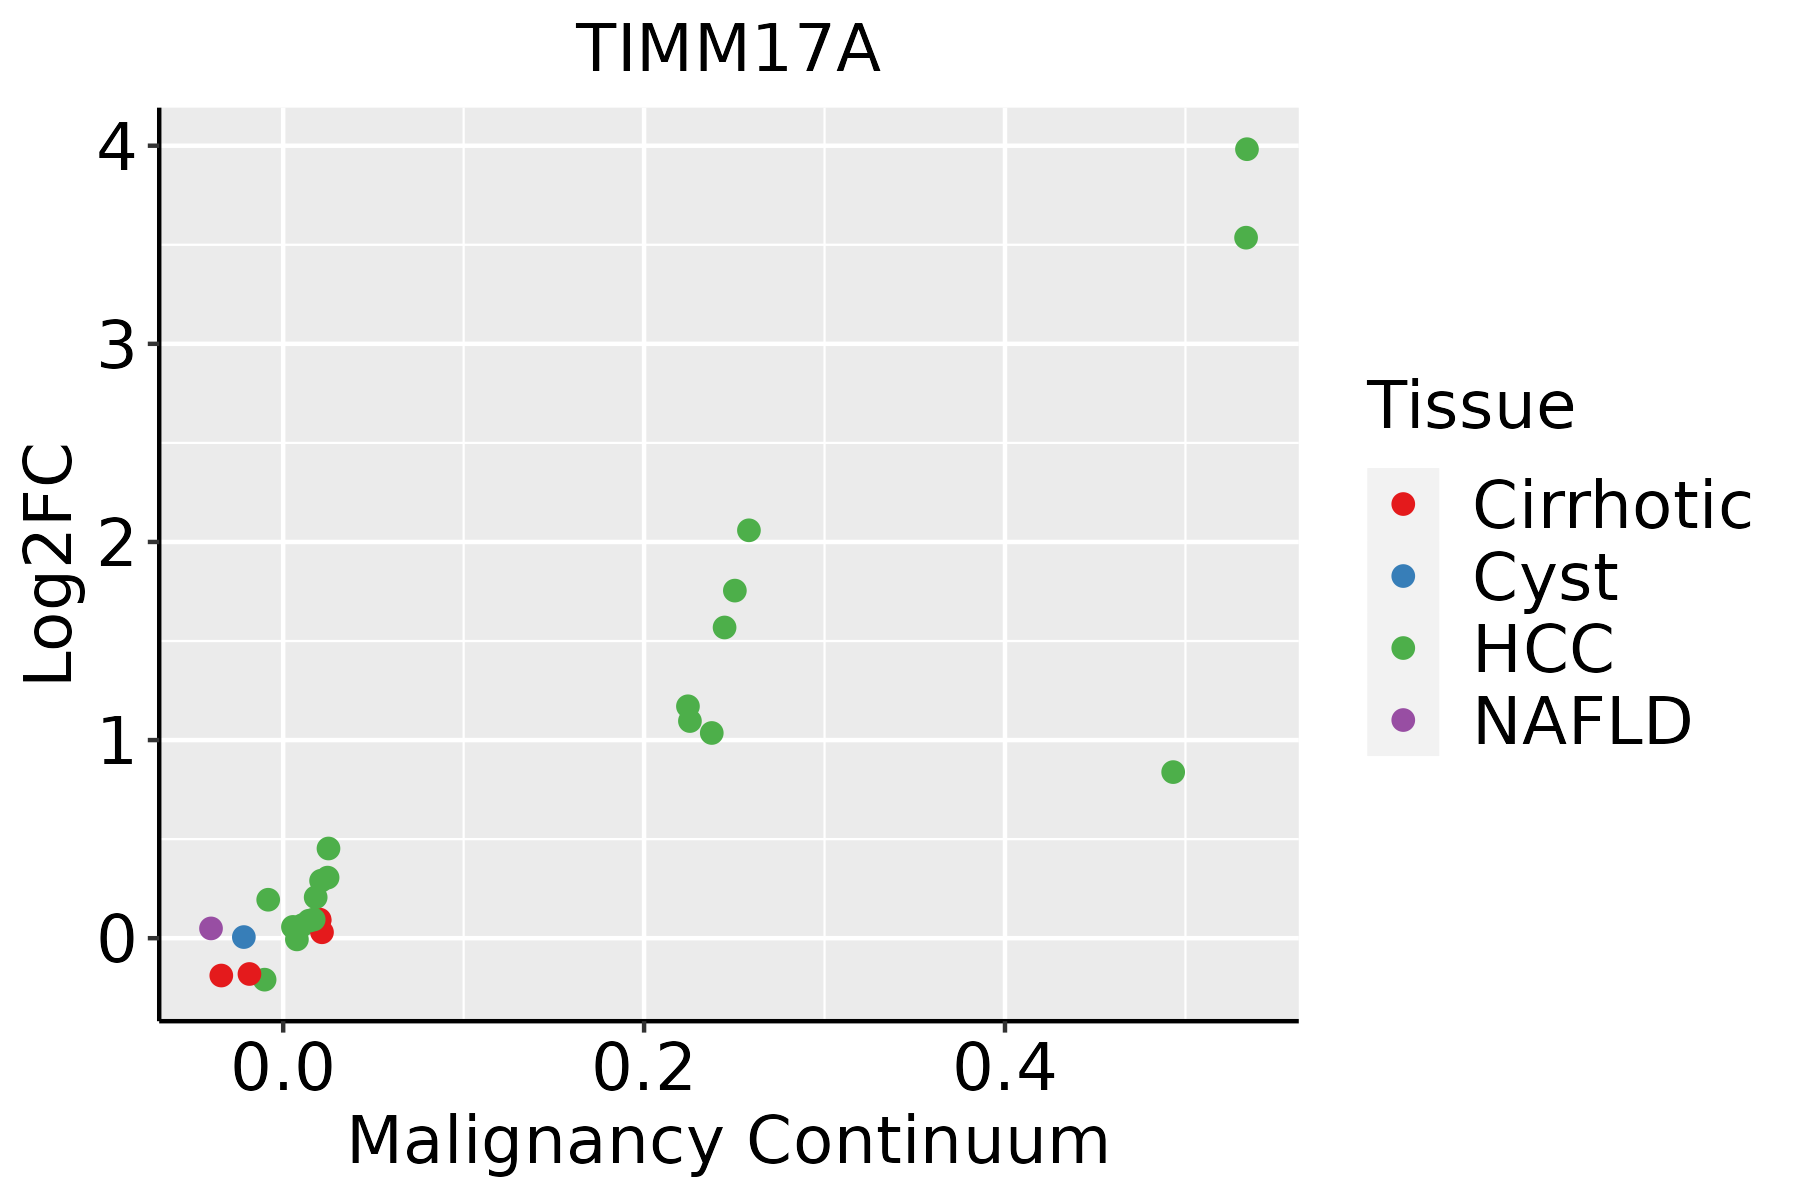
HCC: Hepatocellular carcinoma
NAFLD: Non-alcoholic fatty liver disease
Oral CavityThe image shows the transcriptomic changes along malignancy continuum.log2FC in expression of this searched gene in stem-like cells from each diseased tissue sample relative to stem-like cells in normal samples in each tissue plotted against the malignancy continuum. Samples are colored based on if they are from different disease stage.EOLP: Erosive Oral lichen planus
LP: leukoplakia
NEOLP: Non-erosive oral lichen planus
OSCC: Oral squamous cell carcinoma
ProstateThe image shows the transcriptomic changes along malignancy continuum.log2FC in expression of this searched gene in stem-like cells from each diseased tissue sample relative to stem-like cells in normal samples in each tissue plotted against the malignancy continuum. Samples are colored based on if they are from different disease stage.
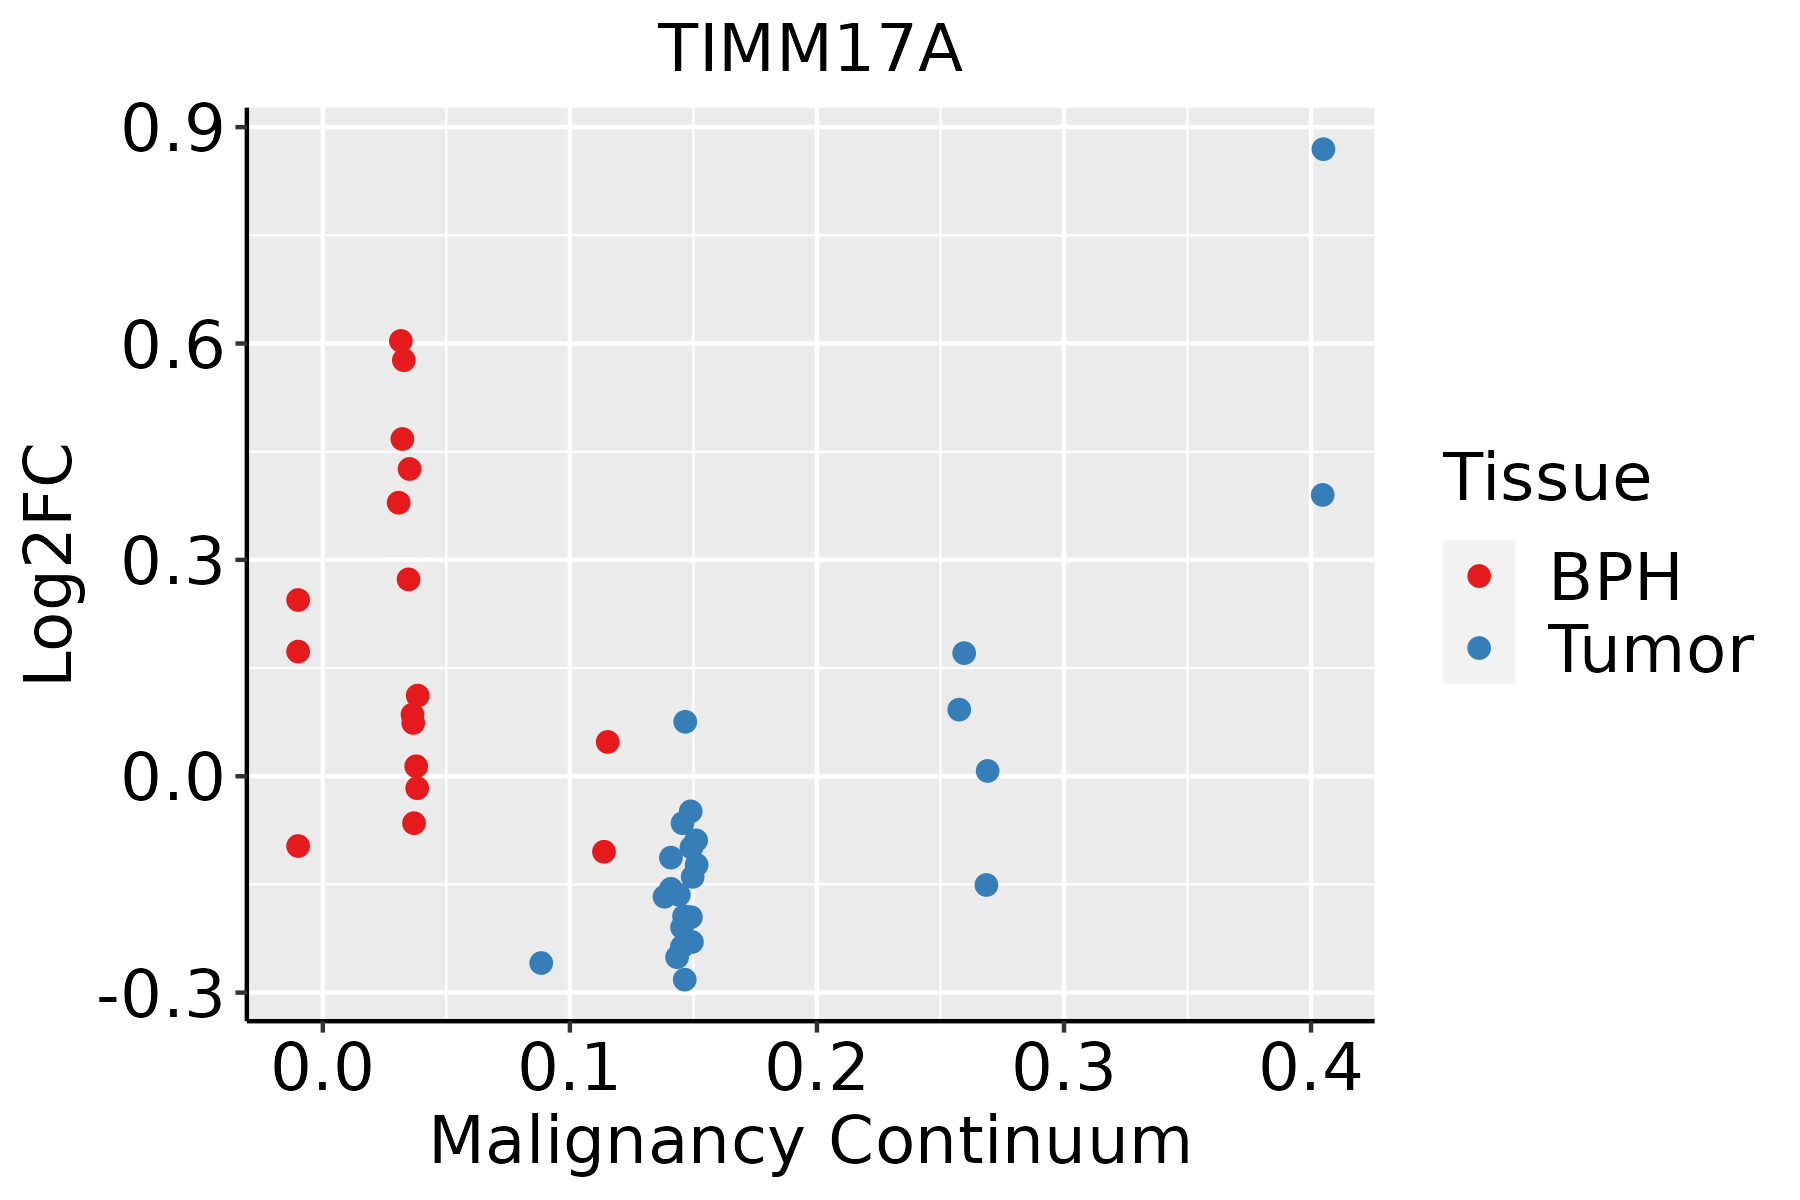
BPH: Benign Prostatic Hyperplasia
SkinThe image shows the transcriptomic changes along malignancy continuum.log2FC in expression of this searched gene in stem-like cells from each diseased tissue sample relative to stem-like cells in normal samples in each tissue plotted against the malignancy continuum. Samples are colored based on if they are from different disease stage.
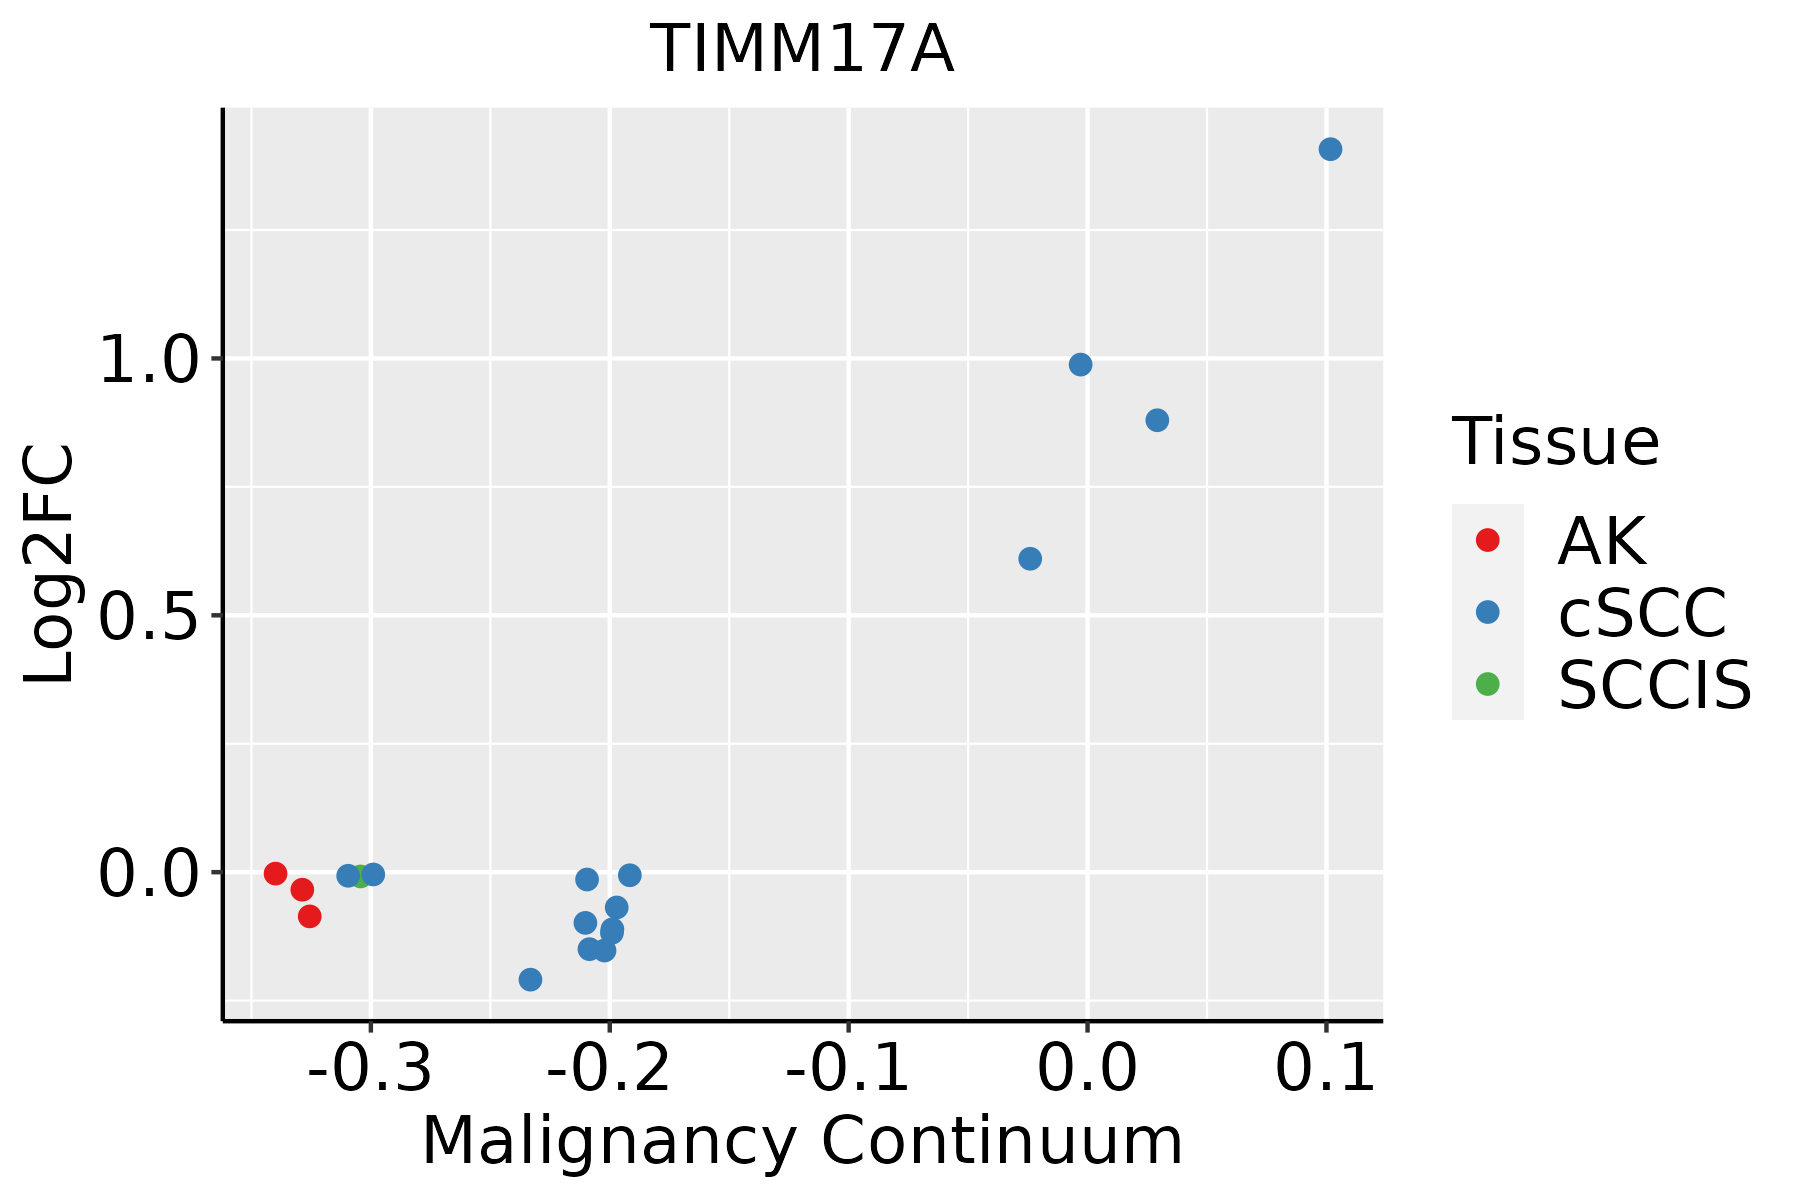
AK: Actinic keratosis
cSCC: Cutaneous squamous cell carcinoma
SCCIS:squamous cell carcinoma in situ
ThyroidThe image shows the transcriptomic changes along malignancy continuum.log2FC in expression of this searched gene in stem-like cells from each diseased tissue sample relative to stem-like cells in normal samples in each tissue plotted against the malignancy continuum. Samples are colored based on if they are from different disease stage.
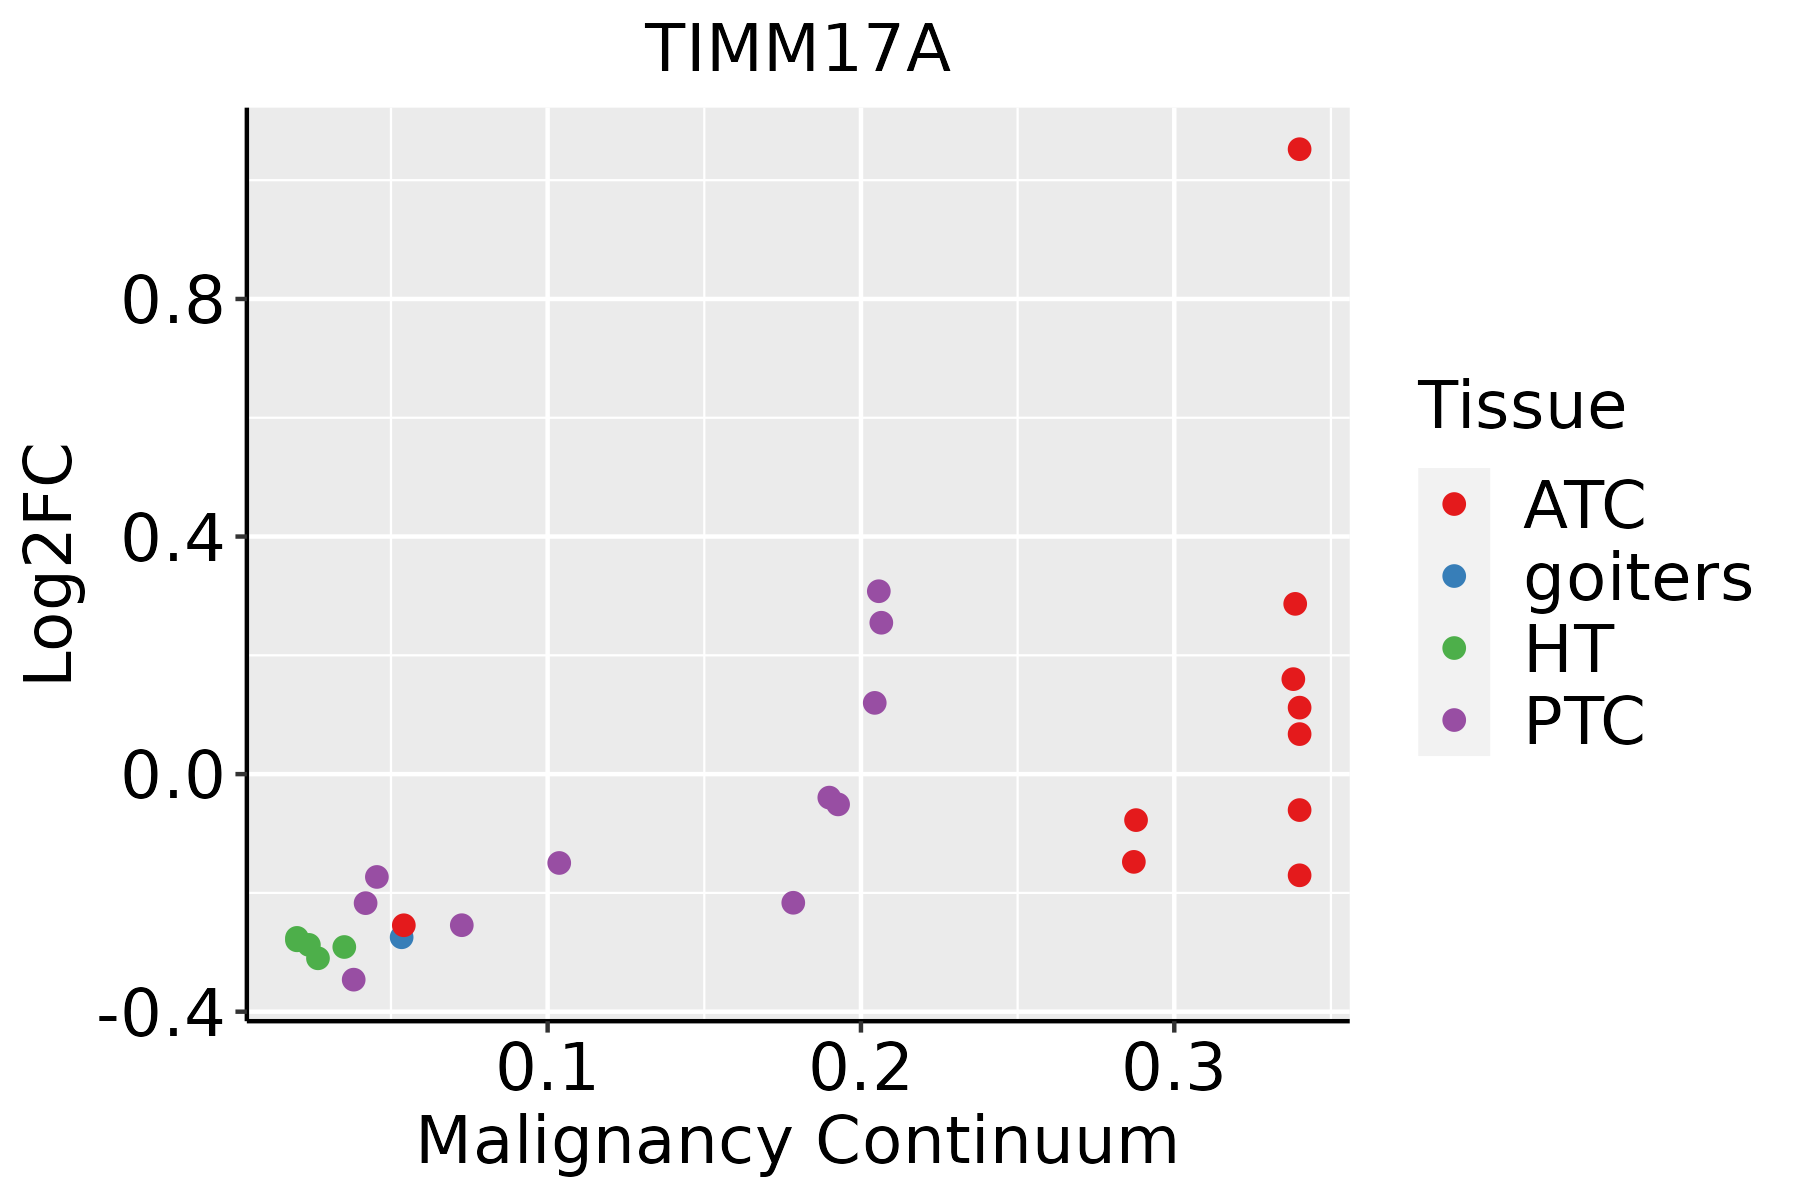
ATC: Anaplastic thyroid cancer
HT: Hashimoto's thyroiditis
PTC: Papillary thyroid cancer
∗log2FC in expression of this searched gene in stem-like cells from each diseased tissue sample relative to stem-like cells in normal samples in each tissue plotted against the malignancy continuum. Samples are colored based on if they are from different disease stage.

Top

Malignant transformation related pathway analysis

check buttonFind out the enriched GO biological processes and KEGG pathways involved in transition from healthy to precancer to cancer
check button Figure of enriched GO biological processes.
TissueDisease StageEnriched GO biological Processes
ColorectumADGO analysis - Figure of enriched GO biological processes: Top 15 enriched GO BP terms are showed in the bar plot of each disease state in each tissue. Each row represents a significant GO biological process which is colored according to the -log10(p.adjust).
ColorectumSERGO analysis - Figure of enriched GO biological processes: Top 15 enriched GO BP terms are showed in the bar plot of each disease state in each tissue. Each row represents a significant GO biological process which is colored according to the -log10(p.adjust).
ColorectumMSSGO analysis - Figure of enriched GO biological processes: Top 15 enriched GO BP terms are showed in the bar plot of each disease state in each tissue. Each row represents a significant GO biological process which is colored according to the -log10(p.adjust).
ColorectumMSI-HGO analysis - Figure of enriched GO biological processes: Top 15 enriched GO BP terms are showed in the bar plot of each disease state in each tissue. Each row represents a significant GO biological process which is colored according to the -log10(p.adjust).
ColorectumFAPGO analysis - Figure of enriched GO biological processes: Top 15 enriched GO BP terms are showed in the bar plot of each disease state in each tissue. Each row represents a significant GO biological process which is colored according to the -log10(p.adjust).
∗Top 15 enriched GO BP terms are showed in the bar plot of each disease state in each tissue. Each row represents a significant GO biological process which is colored according to the -log10(p.adjust).
Page: 1 2 3 4 5 6 7 8 9 

check button Enriched GO biological processes.
GO IDTissueDisease StageDescriptionGene RatioBg Ratiopvaluep.adjustCount
GO:007058516ProstateBPHprotein localization to mitochondrion43/3107125/187239.29e-071.70e-0543
GO:001703810ProstateBPHprotein import62/3107206/187239.72e-071.77e-0562
GO:00516049ProstateBPHprotein maturation80/3107294/187232.64e-064.23e-0580
GO:000662616ProstateBPHprotein targeting to mitochondrion34/3107100/187231.64e-052.05e-0434
GO:00164855ProstateBPHprotein processing62/3107225/187232.22e-052.67e-0462
GO:199054210ProstateBPHmitochondrial transmembrane transport34/3107102/187232.63e-053.10e-0434
GO:00718067ProstateBPHprotein transmembrane transport19/310759/187232.37e-031.29e-0219
GO:00650024ProstateBPHintracellular protein transmembrane transport16/310751/187236.72e-033.02e-0216
GO:007259417ProstateTumorestablishment of protein localization to organelle151/3246422/187233.19e-202.83e-17151
GO:004586219ProstateTumorpositive regulation of proteolysis124/3246372/187233.46e-144.31e-12124
GO:000660519ProstateTumorprotein targeting109/3246314/187236.11e-147.30e-12109
GO:000683917ProstateTumormitochondrial transport84/3246254/187237.17e-103.57e-0884
GO:007058517ProstateTumorprotein localization to mitochondrion47/3246125/187235.20e-081.58e-0647
GO:007265517ProstateTumorestablishment of protein localization to mitochondrion45/3246120/187231.09e-072.89e-0645
GO:001703814ProstateTumorprotein import66/3246206/187231.78e-074.38e-0666
GO:000662617ProstateTumorprotein targeting to mitochondrion37/3246100/187232.07e-063.56e-0537
GO:005160415ProstateTumorprotein maturation81/3246294/187237.58e-061.13e-0481
GO:199054217ProstateTumormitochondrial transmembrane transport36/3246102/187239.84e-061.43e-0436
GO:001648512ProstateTumorprotein processing63/3246225/187234.40e-054.98e-0463
GO:007180614ProstateTumorprotein transmembrane transport19/324659/187233.94e-032.00e-0219
Page: 1 2 3 4 5 6 7 8 9 

check button Enriched KEGG pathways.
Pathway IDTissueDisease StageDescriptionGene RatioBg Ratiopvaluep.adjustqvalueCount
Page: 1 

Top

Cell-cell communication analysis

check buttonIdentification of potential cell-cell interactions between two cell types and their ligand-receptor pairs for different disease states
LigandReceptorLRpairPathwayTissueDisease Stage
Page: 1 

Top

Single-cell gene regulatory network inference analysis

check buttonFind out the significant the regulons (TFs) and the target genes of each regulon across cell types for different disease states
TFCell TypeTissueDisease StageTarget GeneRSSRegulon Activity
∗The dot plots of a searched regulon are shown for all cell subpopulations in each disease state of each tissue based on the regulon specific score inferred using pySCENIC and by calculating the average expression.
Page: 1 

Top

Somatic mutation of malignant transformation related genes

check buttonAnnotation of somatic variants for genes involved in malignant transformation
Hugo SymbolVariant ClassVariant ClassificationdbSNP RSHGVScHGVSpHGVSp ShortSWISSPROTBIOTYPESIFTPolyPhenTumor Sample BarcodeTissueHistologySexAgeStageTherapy TypesDrugsOutcome
TIMM17ASNVMissense_Mutationrs750416279c.253G>Ap.Gly85Argp.G85RQ99595protein_codingtolerated(0.36)benign(0.113)TCGA-AC-A23H-01Breastbreast invasive carcinomaFemale>=65I/IIUnknownUnknownPD
TIMM17ASNVMissense_Mutationc.17N>Cp.Arg6Prop.R6PQ99595protein_codingdeleterious(0.01)possibly_damaging(0.747)TCGA-BH-A18K-01Breastbreast invasive carcinomaFemale<65I/IIUnknownUnknownPD
TIMM17ASNVMissense_Mutationrs756338629c.112C>Tp.Arg38Cysp.R38CQ99595protein_codingdeleterious(0)probably_damaging(1)TCGA-2W-A8YY-01Cervixcervical & endocervical cancerFemale<65I/IIChemotherapycisplatinCR
TIMM17ASNVMissense_Mutationc.119N>Ap.Ser40Tyrp.S40YQ99595protein_codingdeleterious(0)possibly_damaging(0.815)TCGA-AP-A059-01Endometriumuterine corpus endometrioid carcinomaFemale>=65I/IIUnknownUnknownSD
TIMM17ASNVMissense_Mutationc.98N>Tp.Ala33Valp.A33VQ99595protein_codingtolerated(0.48)possibly_damaging(0.744)TCGA-AP-A0LM-01Endometriumuterine corpus endometrioid carcinomaFemale<65III/IVChemotherapycisplatinSD
TIMM17ASNVMissense_Mutationrs202092277c.386N>Tp.Ala129Valp.A129VQ99595protein_codingtolerated(1)benign(0.017)TCGA-AP-A1DK-01Endometriumuterine corpus endometrioid carcinomaFemale<65I/IIUnknownUnknownSD
TIMM17ASNVMissense_Mutationnovelc.140G>Tp.Arg47Ilep.R47IQ99595protein_codingdeleterious(0.01)probably_damaging(0.987)TCGA-AX-A2HC-01Endometriumuterine corpus endometrioid carcinomaFemale<65III/IVChemotherapypaclitaxelPD
TIMM17ASNVMissense_Mutationnovelc.209N>Ap.Gly70Glup.G70EQ99595protein_codingdeleterious(0)probably_damaging(0.998)TCGA-B5-A0JU-01Endometriumuterine corpus endometrioid carcinomaFemale<65I/IIUnknownUnknownSD
TIMM17ASNVMissense_Mutationrs756338629c.112N>Tp.Arg38Cysp.R38CQ99595protein_codingdeleterious(0)probably_damaging(1)TCGA-B5-A1MR-01Endometriumuterine corpus endometrioid carcinomaFemale>=65III/IVUnknownUnknownSD
TIMM17ASNVMissense_Mutationrs757756350c.88N>Gp.Ile30Valp.I30VQ99595protein_codingtolerated(0.78)benign(0.026)TCGA-B5-A3FA-01Endometriumuterine corpus endometrioid carcinomaFemale>=65I/IIUnknownUnknownSD
Page: 1 2 

Top

Related drugs of malignant transformation related genes

check buttonIdentification of chemicals and drugs interact with genes involved in malignant transfromation
(DGIdb 4.0)
Entrez IDSymbolCategoryInteraction TypesDrug Claim NameDrug NamePMIDs
Page: 1