
|
|||||
|
 | |
| |
| |
| |
| |
| |
|
Gene: TGFA |
Gene summary for TGFA |
| Gene information | Species | Human | Gene symbol | TGFA | Gene ID | 7039 |
| Gene name | transforming growth factor alpha | |
| Gene Alias | TFGA | |
| Cytomap | 2p13.3 | |
| Gene Type | protein-coding | GO ID | GO:0000165 | UniProtAcc | P01135 |
Top |
Malignant transformation analysis |
| Identification of the aberrant gene expression in precancerous and cancerous lesions by comparing the gene expression of stem-like cells in diseased tissues with normal stem cells |
| Entrez ID | Symbol | Replicates | Species | Organ | Tissue | Adj P-value | Log2FC | Malignancy |
| 7039 | TGFA | LZE4T | Human | Esophagus | ESCC | 3.42e-06 | 1.76e-01 | 0.0811 |
| 7039 | TGFA | LZE5T | Human | Esophagus | ESCC | 1.99e-04 | 1.93e-01 | 0.0514 |
| 7039 | TGFA | LZE24T | Human | Esophagus | ESCC | 5.82e-07 | 3.32e-01 | 0.0596 |
| 7039 | TGFA | P1T-E | Human | Esophagus | ESCC | 8.51e-05 | 6.07e-01 | 0.0875 |
| 7039 | TGFA | P2T-E | Human | Esophagus | ESCC | 2.84e-26 | 8.98e-01 | 0.1177 |
| 7039 | TGFA | P4T-E | Human | Esophagus | ESCC | 4.52e-06 | 3.38e-02 | 0.1323 |
| 7039 | TGFA | P5T-E | Human | Esophagus | ESCC | 1.04e-11 | 2.26e-01 | 0.1327 |
| 7039 | TGFA | P8T-E | Human | Esophagus | ESCC | 2.31e-16 | 1.75e-01 | 0.0889 |
| 7039 | TGFA | P9T-E | Human | Esophagus | ESCC | 2.09e-04 | 7.13e-02 | 0.1131 |
| 7039 | TGFA | P11T-E | Human | Esophagus | ESCC | 3.02e-07 | 3.69e-01 | 0.1426 |
| 7039 | TGFA | P12T-E | Human | Esophagus | ESCC | 2.24e-12 | 2.51e-01 | 0.1122 |
| 7039 | TGFA | P15T-E | Human | Esophagus | ESCC | 2.66e-12 | 2.75e-01 | 0.1149 |
| 7039 | TGFA | P16T-E | Human | Esophagus | ESCC | 3.46e-46 | 1.22e+00 | 0.1153 |
| 7039 | TGFA | P20T-E | Human | Esophagus | ESCC | 1.93e-08 | 9.86e-02 | 0.1124 |
| 7039 | TGFA | P21T-E | Human | Esophagus | ESCC | 3.87e-22 | 6.91e-01 | 0.1617 |
| 7039 | TGFA | P22T-E | Human | Esophagus | ESCC | 1.33e-07 | -9.72e-02 | 0.1236 |
| 7039 | TGFA | P23T-E | Human | Esophagus | ESCC | 8.79e-03 | 2.38e-01 | 0.108 |
| 7039 | TGFA | P26T-E | Human | Esophagus | ESCC | 1.96e-20 | 4.28e-01 | 0.1276 |
| 7039 | TGFA | P27T-E | Human | Esophagus | ESCC | 8.70e-07 | 3.66e-01 | 0.1055 |
| 7039 | TGFA | P28T-E | Human | Esophagus | ESCC | 4.50e-17 | 3.81e-01 | 0.1149 |
| Page: 1 2 3 4 |
| Tissue | Expression Dynamics | Abbreviation |
| Esophagus |  | ESCC: Esophageal squamous cell carcinoma |
| HGIN: High-grade intraepithelial neoplasias | ||
| LGIN: Low-grade intraepithelial neoplasias | ||
| Oral Cavity |  | EOLP: Erosive Oral lichen planus |
| LP: leukoplakia | ||
| NEOLP: Non-erosive oral lichen planus | ||
| OSCC: Oral squamous cell carcinoma | ||
| Skin | 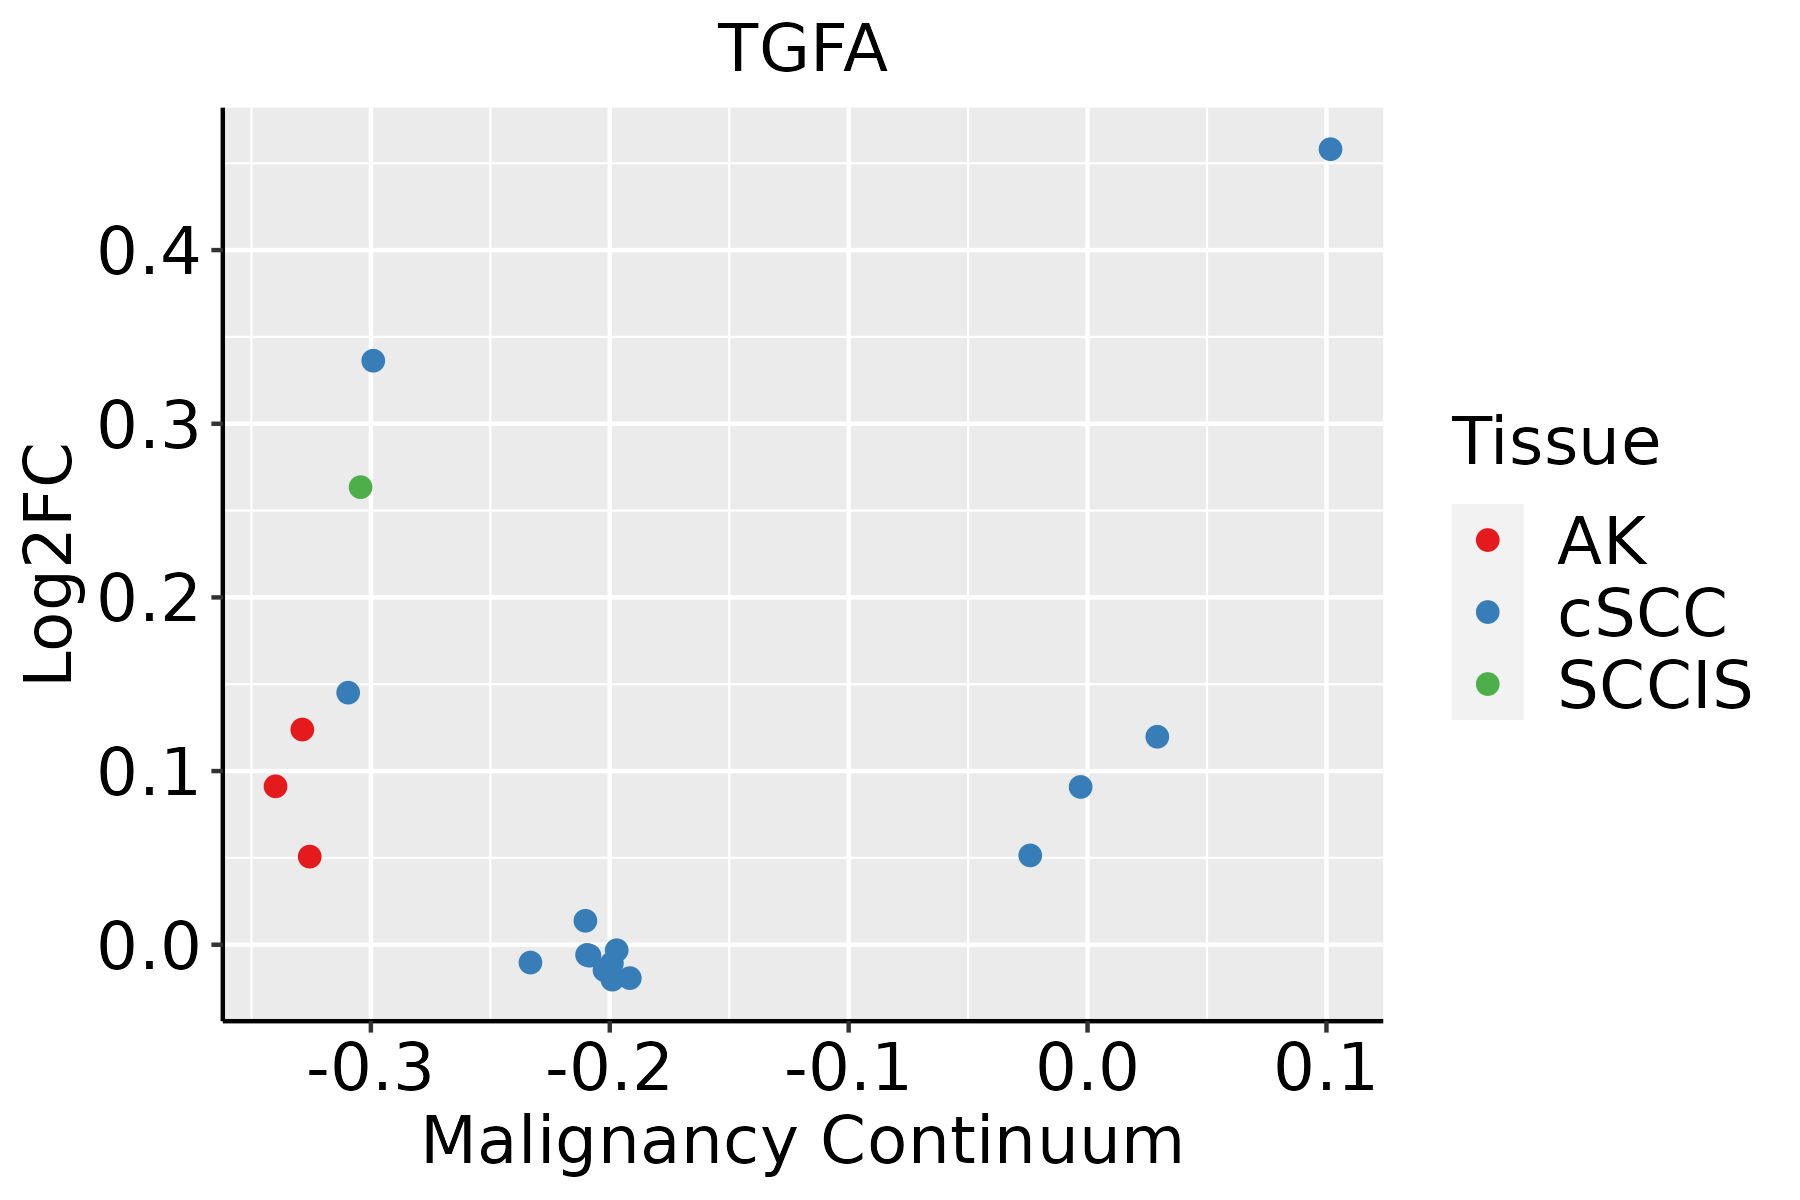 | AK: Actinic keratosis |
| cSCC: Cutaneous squamous cell carcinoma | ||
| SCCIS:squamous cell carcinoma in situ | ||
| Thyroid | 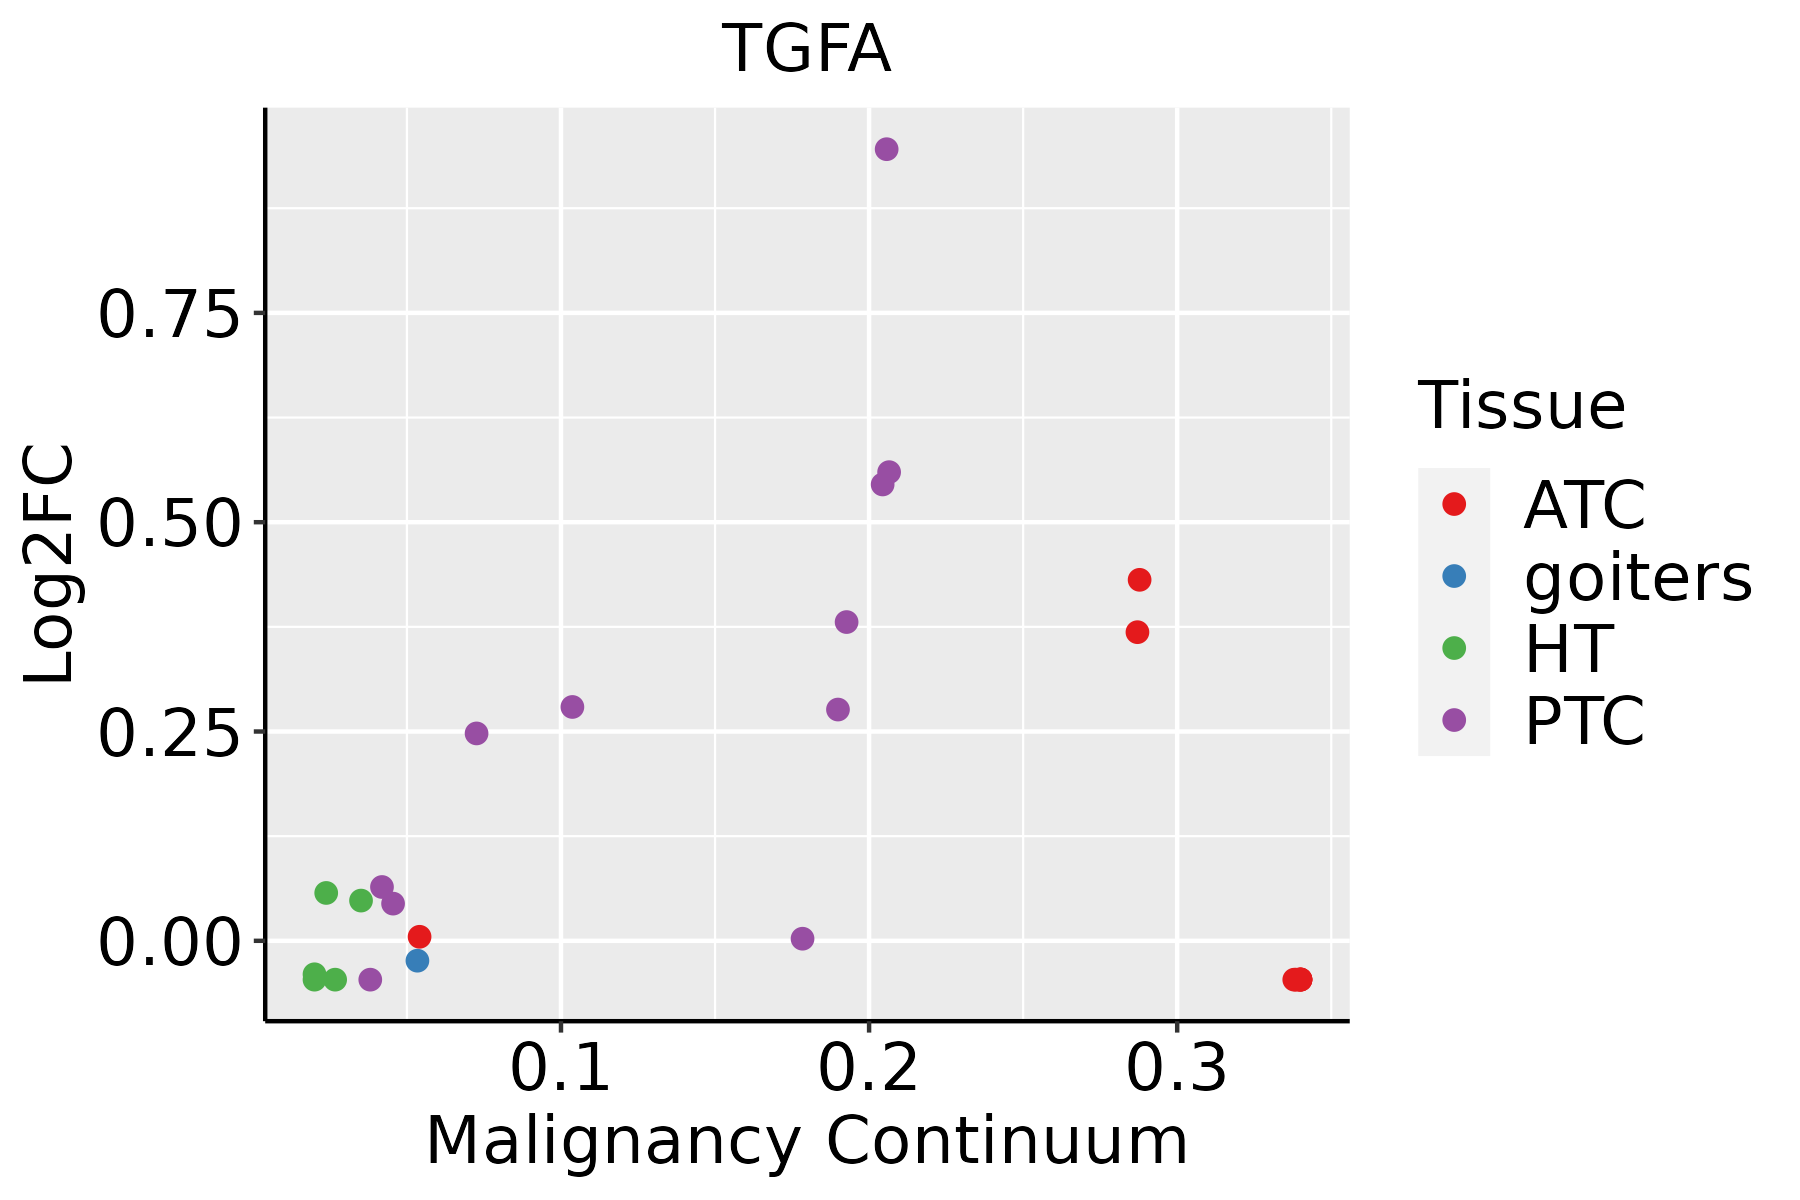 | ATC: Anaplastic thyroid cancer |
| HT: Hashimoto's thyroiditis | ||
| PTC: Papillary thyroid cancer |
| ∗log2FC in expression of this searched gene in stem-like cells from each diseased tissue sample relative to stem-like cells in normal samples in each tissue plotted against the malignancy continuum. Samples are colored based on if they are from different disease stage. |
Top |
Malignant transformation related pathway analysis |
| Find out the enriched GO biological processes and KEGG pathways involved in transition from healthy to precancer to cancer |
| Tissue | Disease Stage | Enriched GO biological Processes |
| Colorectum | AD |  |
| Colorectum | SER |  |
| Colorectum | MSS |  |
| Colorectum | MSI-H |  |
| Colorectum | FAP |  |
| ∗Top 15 enriched GO BP terms are showed in the bar plot of each disease state in each tissue. Each row represents a significant GO biological process which is colored according to the -log10(p.adjust). |
| Page: 1 2 3 4 5 6 7 8 9 |
| GO ID | Tissue | Disease Stage | Description | Gene Ratio | Bg Ratio | pvalue | p.adjust | Count |
| GO:004206029 | Skin | cSCC | wound healing | 152/4864 | 422/18723 | 2.66e-06 | 4.26e-05 | 152 |
| GO:003812724 | Skin | cSCC | ERBB signaling pathway | 55/4864 | 121/18723 | 2.77e-06 | 4.38e-05 | 55 |
| GO:009006815 | Skin | cSCC | positive regulation of cell cycle process | 92/4864 | 236/18723 | 7.33e-06 | 1.01e-04 | 92 |
| GO:000717323 | Skin | cSCC | epidermal growth factor receptor signaling pathway | 48/4864 | 108/18723 | 2.42e-05 | 2.76e-04 | 48 |
| GO:007190024 | Skin | cSCC | regulation of protein serine/threonine kinase activity | 123/4864 | 359/18723 | 2.70e-04 | 2.17e-03 | 123 |
| GO:005067324 | Skin | cSCC | epithelial cell proliferation | 144/4864 | 437/18723 | 6.07e-04 | 4.38e-03 | 144 |
| GO:0009410110 | Skin | cSCC | response to xenobiotic stimulus | 151/4864 | 462/18723 | 6.76e-04 | 4.82e-03 | 151 |
| GO:004205813 | Skin | cSCC | regulation of epidermal growth factor receptor signaling pathway | 32/4864 | 73/18723 | 6.98e-04 | 4.97e-03 | 32 |
| GO:003087922 | Skin | cSCC | mammary gland development | 53/4864 | 137/18723 | 7.21e-04 | 5.05e-03 | 53 |
| GO:190118414 | Skin | cSCC | regulation of ERBB signaling pathway | 34/4864 | 79/18723 | 7.23e-04 | 5.06e-03 | 34 |
| GO:000717612 | Skin | cSCC | regulation of epidermal growth factor-activated receptor activity | 16/4864 | 30/18723 | 1.27e-03 | 8.19e-03 | 16 |
| GO:002261221 | Skin | cSCC | gland morphogenesis | 45/4864 | 118/18723 | 2.43e-03 | 1.39e-02 | 45 |
| GO:006109721 | Skin | cSCC | regulation of protein tyrosine kinase activity | 36/4864 | 90/18723 | 2.48e-03 | 1.42e-02 | 36 |
| GO:003367425 | Skin | cSCC | positive regulation of kinase activity | 148/4864 | 467/18723 | 3.00e-03 | 1.66e-02 | 148 |
| GO:004586025 | Skin | cSCC | positive regulation of protein kinase activity | 123/4864 | 386/18723 | 5.23e-03 | 2.64e-02 | 123 |
| GO:00513026 | Skin | cSCC | regulation of cell division | 61/4864 | 177/18723 | 7.34e-03 | 3.47e-02 | 61 |
| GO:000734619 | Thyroid | PTC | regulation of mitotic cell cycle | 212/5968 | 457/18723 | 4.03e-11 | 1.44e-09 | 212 |
| GO:0042060112 | Thyroid | PTC | wound healing | 190/5968 | 422/18723 | 7.72e-09 | 1.92e-07 | 190 |
| GO:0045860111 | Thyroid | PTC | positive regulation of protein kinase activity | 176/5968 | 386/18723 | 8.89e-09 | 2.17e-07 | 176 |
| GO:0071900110 | Thyroid | PTC | regulation of protein serine/threonine kinase activity | 164/5968 | 359/18723 | 2.41e-08 | 5.43e-07 | 164 |
| Page: 1 2 3 4 5 6 7 8 9 |
| Pathway ID | Tissue | Disease Stage | Description | Gene Ratio | Bg Ratio | pvalue | p.adjust | qvalue | Count |
| hsa0521020 | Esophagus | ESCC | Colorectal cancer | 69/4205 | 86/8465 | 4.06e-09 | 4.13e-08 | 2.11e-08 | 69 |
| hsa0521216 | Esophagus | ESCC | Pancreatic cancer | 62/4205 | 76/8465 | 7.37e-09 | 6.85e-08 | 3.51e-08 | 62 |
| hsa0521516 | Esophagus | ESCC | Prostate cancer | 72/4205 | 97/8465 | 6.12e-07 | 4.10e-06 | 2.10e-06 | 72 |
| hsa0521118 | Esophagus | ESCC | Renal cell carcinoma | 51/4205 | 69/8465 | 3.29e-05 | 1.53e-04 | 7.83e-05 | 51 |
| hsa0522518 | Esophagus | ESCC | Hepatocellular carcinoma | 109/4205 | 168/8465 | 4.27e-05 | 1.88e-04 | 9.64e-05 | 109 |
| hsa0152110 | Esophagus | ESCC | EGFR tyrosine kinase inhibitor resistance | 55/4205 | 79/8465 | 2.44e-04 | 8.78e-04 | 4.50e-04 | 55 |
| hsa0521417 | Esophagus | ESCC | Glioma | 52/4205 | 75/8465 | 4.20e-04 | 1.45e-03 | 7.43e-04 | 52 |
| hsa0401218 | Esophagus | ESCC | ErbB signaling pathway | 56/4205 | 85/8465 | 1.78e-03 | 5.24e-03 | 2.68e-03 | 56 |
| hsa052237 | Esophagus | ESCC | Non-small cell lung cancer | 48/4205 | 72/8465 | 2.57e-03 | 7.05e-03 | 3.61e-03 | 48 |
| hsa041517 | Esophagus | ESCC | PI3K-Akt signaling pathway | 197/4205 | 354/8465 | 1.24e-02 | 2.83e-02 | 1.45e-02 | 197 |
| hsa05210110 | Esophagus | ESCC | Colorectal cancer | 69/4205 | 86/8465 | 4.06e-09 | 4.13e-08 | 2.11e-08 | 69 |
| hsa0521217 | Esophagus | ESCC | Pancreatic cancer | 62/4205 | 76/8465 | 7.37e-09 | 6.85e-08 | 3.51e-08 | 62 |
| hsa0521517 | Esophagus | ESCC | Prostate cancer | 72/4205 | 97/8465 | 6.12e-07 | 4.10e-06 | 2.10e-06 | 72 |
| hsa0521119 | Esophagus | ESCC | Renal cell carcinoma | 51/4205 | 69/8465 | 3.29e-05 | 1.53e-04 | 7.83e-05 | 51 |
| hsa0522519 | Esophagus | ESCC | Hepatocellular carcinoma | 109/4205 | 168/8465 | 4.27e-05 | 1.88e-04 | 9.64e-05 | 109 |
| hsa0152115 | Esophagus | ESCC | EGFR tyrosine kinase inhibitor resistance | 55/4205 | 79/8465 | 2.44e-04 | 8.78e-04 | 4.50e-04 | 55 |
| hsa0521418 | Esophagus | ESCC | Glioma | 52/4205 | 75/8465 | 4.20e-04 | 1.45e-03 | 7.43e-04 | 52 |
| hsa0401219 | Esophagus | ESCC | ErbB signaling pathway | 56/4205 | 85/8465 | 1.78e-03 | 5.24e-03 | 2.68e-03 | 56 |
| hsa0522316 | Esophagus | ESCC | Non-small cell lung cancer | 48/4205 | 72/8465 | 2.57e-03 | 7.05e-03 | 3.61e-03 | 48 |
| hsa0415114 | Esophagus | ESCC | PI3K-Akt signaling pathway | 197/4205 | 354/8465 | 1.24e-02 | 2.83e-02 | 1.45e-02 | 197 |
| Page: 1 2 3 |
Top |
Cell-cell communication analysis |
| Identification of potential cell-cell interactions between two cell types and their ligand-receptor pairs for different disease states |
| Ligand | Receptor | LRpair | Pathway | Tissue | Disease Stage |
| TGFA | EGFR | TGFA_EGFR | EGF | CRC | AD |
| TGFA | EGFR_ERBB2 | TGFA_EGFR_ERBB2 | EGF | CRC | AD |
| TGFA | EGFR | TGFA_EGFR | EGF | CRC | ADJ |
| TGFA | EGFR_ERBB2 | TGFA_EGFR_ERBB2 | EGF | CRC | ADJ |
| TGFA | EGFR | TGFA_EGFR | EGF | CRC | Healthy |
| TGFA | EGFR | TGFA_EGFR | EGF | CRC | MSI-H |
| TGFA | EGFR_ERBB2 | TGFA_EGFR_ERBB2 | EGF | CRC | MSI-H |
| TGFA | EGFR | TGFA_EGFR | EGF | CRC | SER |
| TGFA | EGFR_ERBB2 | TGFA_EGFR_ERBB2 | EGF | CRC | SER |
| TGFA | EGFR | TGFA_EGFR | EGF | Esophagus | ESCC |
| TGFA | EGFR_ERBB2 | TGFA_EGFR_ERBB2 | EGF | Esophagus | ESCC |
| TGFA | EGFR | TGFA_EGFR | EGF | HNSCC | ADJ |
| TGFA | EGFR_ERBB2 | TGFA_EGFR_ERBB2 | EGF | HNSCC | ADJ |
| TGFA | EGFR | TGFA_EGFR | EGF | HNSCC | OSCC |
| TGFA | EGFR_ERBB2 | TGFA_EGFR_ERBB2 | EGF | HNSCC | OSCC |
| TGFA | EGFR | TGFA_EGFR | EGF | HNSCC | Precancer |
| TGFA | EGFR_ERBB2 | TGFA_EGFR_ERBB2 | EGF | HNSCC | Precancer |
| TGFA | EGFR | TGFA_EGFR | EGF | Liver | Healthy |
| Page: 1 |
Top |
Single-cell gene regulatory network inference analysis |
| Find out the significant the regulons (TFs) and the target genes of each regulon across cell types for different disease states |
| TF | Cell Type | Tissue | Disease Stage | Target Gene | RSS | Regulon Activity |
| ∗The dot plots of a searched regulon are shown for all cell subpopulations in each disease state of each tissue based on the regulon specific score inferred using pySCENIC and by calculating the average expression. |
| Page: 1 |
Top |
Somatic mutation of malignant transformation related genes |
| Annotation of somatic variants for genes involved in malignant transformation |
| Hugo Symbol | Variant Class | Variant Classification | dbSNP RS | HGVSc | HGVSp | HGVSp Short | SWISSPROT | BIOTYPE | SIFT | PolyPhen | Tumor Sample Barcode | Tissue | Histology | Sex | Age | Stage | Therapy Types | Drugs | Outcome |
| TGFA | SNV | Missense_Mutation | c.91N>G | p.Asn31Asp | p.N31D | protein_coding | deleterious(0.05) | probably_damaging(0.987) | TCGA-AN-A0AS-01 | Breast | breast invasive carcinoma | Female | >=65 | III/IV | Unknown | Unknown | SD | ||
| TGFA | insertion | Frame_Shift_Ins | novel | c.92_93insAGTCTTGAAATCTCTTCTCTTAAAATGTCATGCTG | p.Asn31LysfsTer18 | p.N31Kfs*18 | protein_coding | TCGA-A8-A07R-01 | Breast | breast invasive carcinoma | Female | >=65 | III/IV | Ancillary | zoledronic | SD | |||
| TGFA | insertion | Frame_Shift_Ins | novel | c.93_94insTGCTTTTTAAGCTCAAATGTTGGGGCTGTGCATT | p.Ser32CysfsTer12 | p.S32Cfs*12 | protein_coding | TCGA-A8-A09X-01 | Breast | breast invasive carcinoma | Female | <65 | III/IV | Unknown | Unknown | SD | |||
| TGFA | SNV | Missense_Mutation | novel | c.163N>A | p.Asp55Asn | p.D55N | protein_coding | deleterious(0) | probably_damaging(0.944) | TCGA-VS-A9UJ-01 | Cervix | cervical & endocervical cancer | Female | <65 | I/II | Unknown | Unknown | PD | |
| TGFA | SNV | Missense_Mutation | novel | c.353N>T | p.Ala118Val | p.A118V | protein_coding | tolerated(1) | benign(0.005) | TCGA-F5-6814-01 | Colorectum | rectum adenocarcinoma | Male | <65 | I/II | Unknown | Unknown | SD | |
| TGFA | SNV | Missense_Mutation | rs372158742 | c.419N>A | p.Arg140Gln | p.R140Q | protein_coding | tolerated(0.13) | benign(0.007) | TCGA-A5-A0G2-01 | Endometrium | uterine corpus endometrioid carcinoma | Female | <65 | III/IV | Unknown | Unknown | SD | |
| TGFA | SNV | Missense_Mutation | novel | c.436N>T | p.His146Tyr | p.H146Y | protein_coding | tolerated(0.1) | possibly_damaging(0.794) | TCGA-AP-A1DK-01 | Endometrium | uterine corpus endometrioid carcinoma | Female | <65 | I/II | Unknown | Unknown | SD | |
| TGFA | SNV | Missense_Mutation | c.101C>T | p.Ser34Phe | p.S34F | protein_coding | tolerated(0.48) | probably_damaging(0.961) | TCGA-FI-A2D5-01 | Endometrium | uterine corpus endometrioid carcinoma | Female | <65 | III/IV | Chemotherapy | carboplatinum | PD | ||
| TGFA | SNV | Missense_Mutation | novel | c.437N>G | p.His146Arg | p.H146R | protein_coding | tolerated(0.13) | possibly_damaging(0.494) | TCGA-78-8662-01 | Lung | lung adenocarcinoma | Female | <65 | I/II | Unknown | Unknown | PD | |
| TGFA | SNV | Missense_Mutation | rs782074408 | c.74C>T | p.Ala25Val | p.A25V | protein_coding | tolerated(1) | benign(0) | TCGA-18-4083-01 | Lung | lung squamous cell carcinoma | Male | <65 | I/II | Chemotherapy | cisplatin | SD |
| Page: 1 2 |
Top |
Related drugs of malignant transformation related genes |
| Identification of chemicals and drugs interact with genes involved in malignant transfromation |
| (DGIdb 4.0) |
| Entrez ID | Symbol | Category | Interaction Types | Drug Claim Name | Drug Name | PMIDs |
| 7039 | TGFA | CELL SURFACE, GROWTH FACTOR, DRUGGABLE GENOME | panitumumab | PANITUMUMAB | ||
| 7039 | TGFA | CELL SURFACE, GROWTH FACTOR, DRUGGABLE GENOME | LY3016859 | |||
| 7039 | TGFA | CELL SURFACE, GROWTH FACTOR, DRUGGABLE GENOME | cetuximab | CETUXIMAB |
| Page: 1 |

Copyright 2023-Present -The University of Texas Health Science Center at Houston |