| Tissue | Expression Dynamics | Abbreviation |
| Cervix | 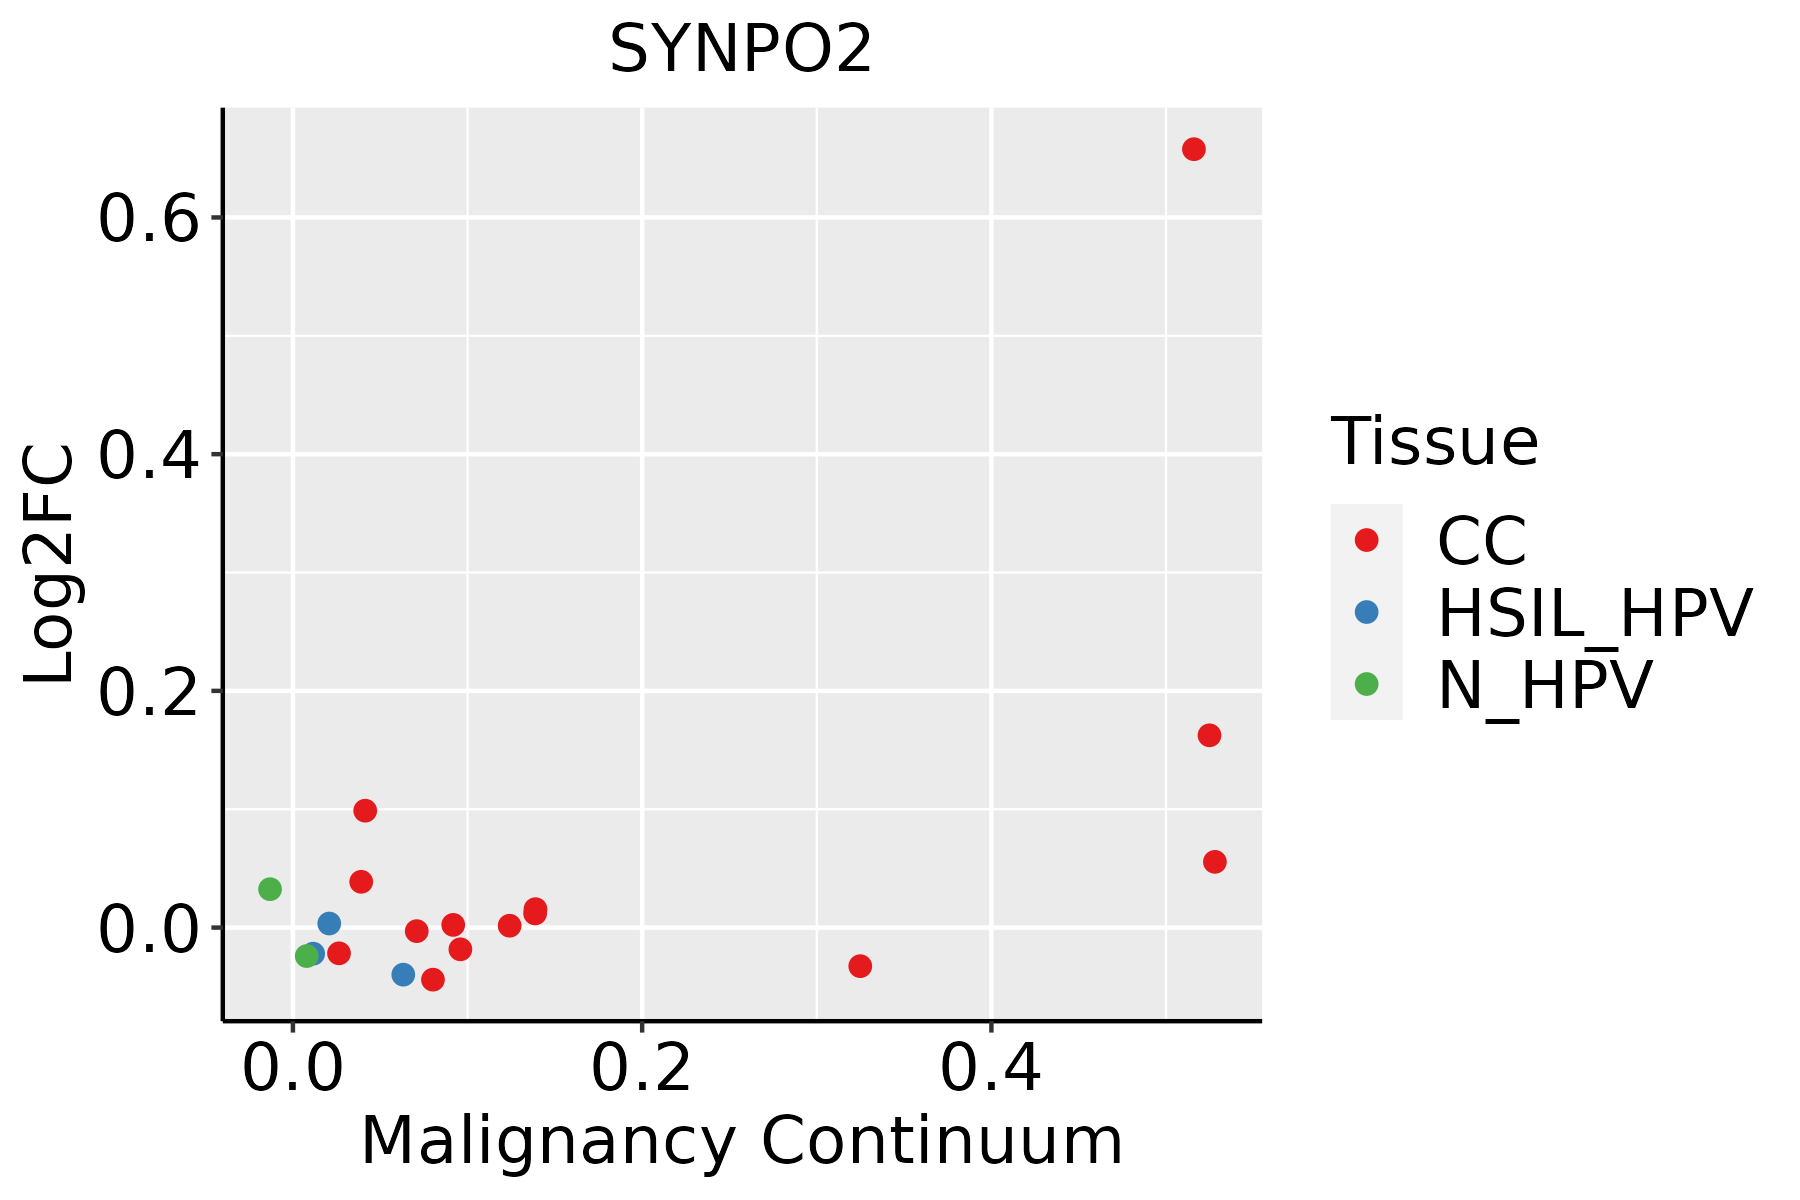 | CC: Cervix cancer |
| HSIL_HPV: HPV-infected high-grade squamous intraepithelial lesions |
| N_HPV: HPV-infected normal cervix |
| Esophagus | 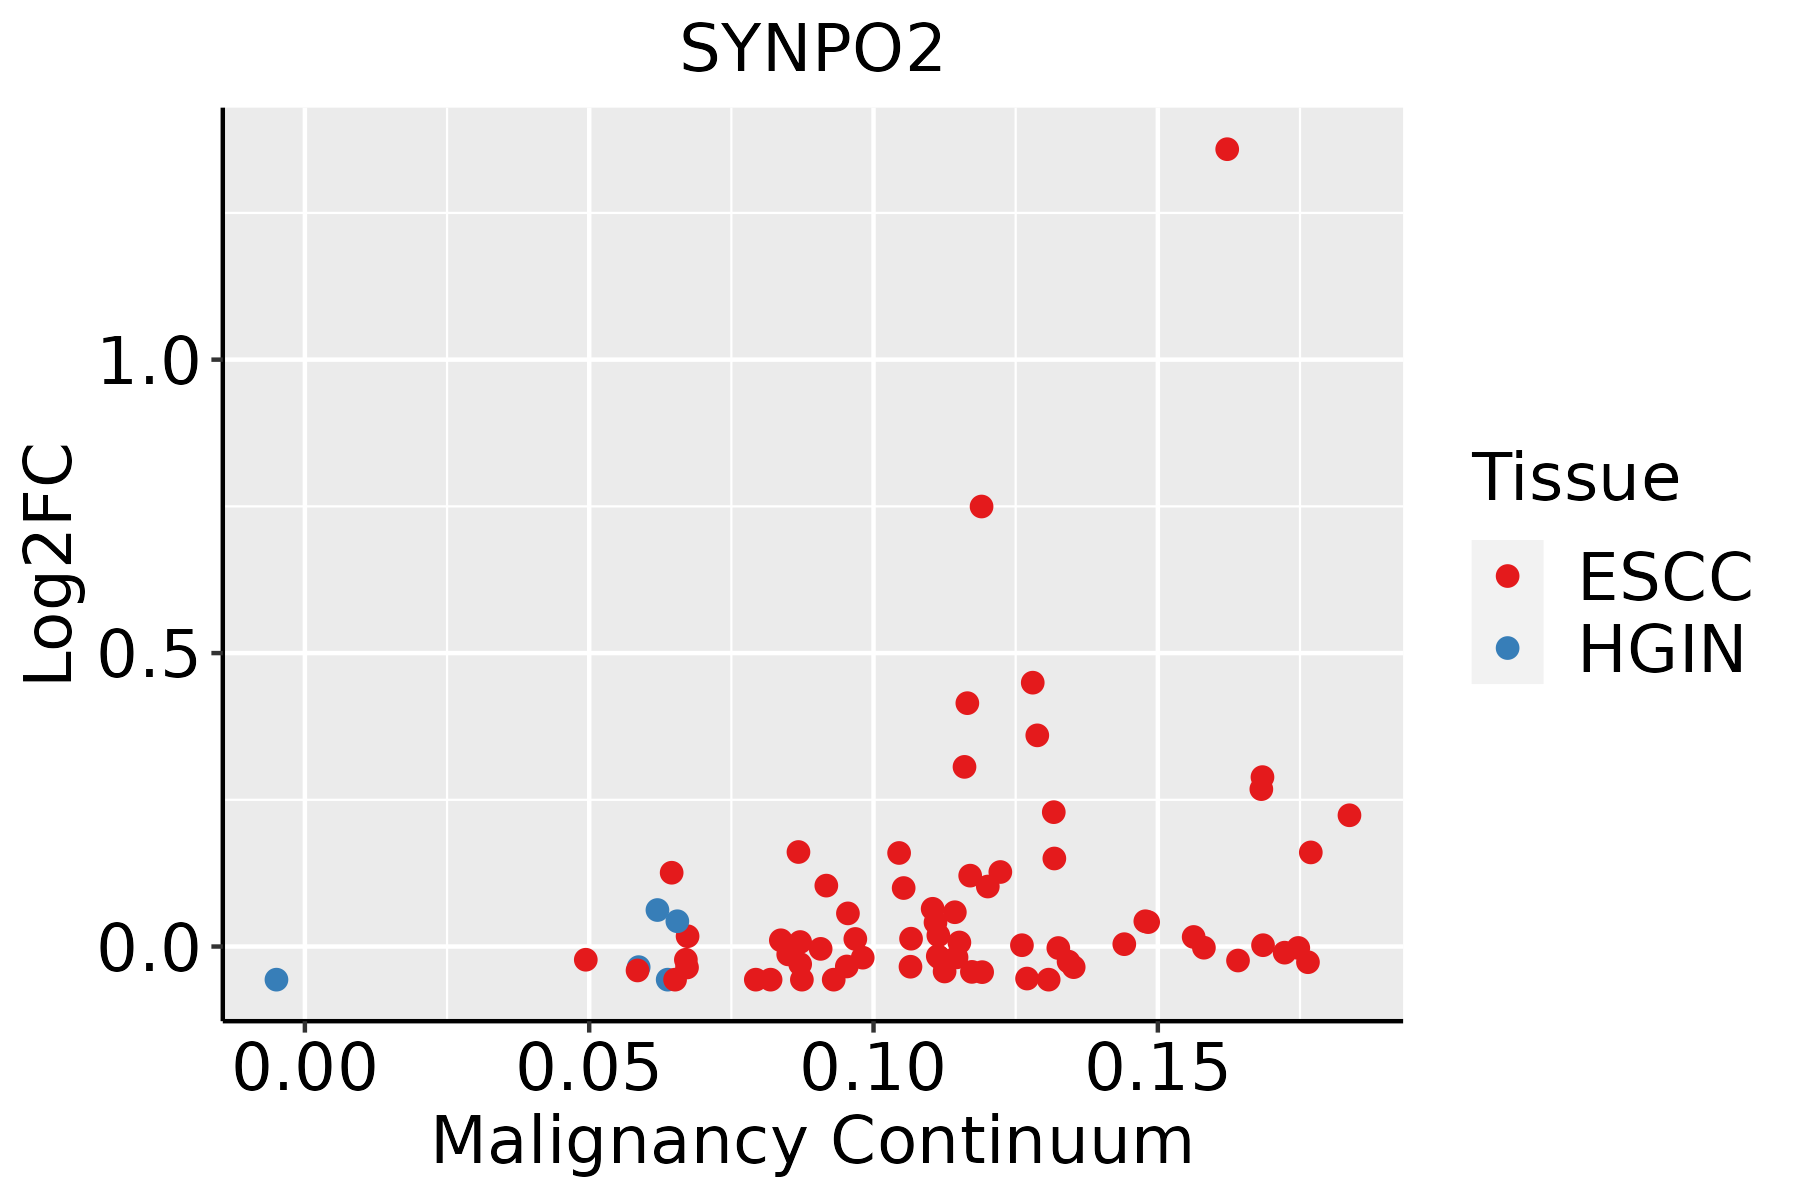 | ESCC: Esophageal squamous cell carcinoma |
| HGIN: High-grade intraepithelial neoplasias |
| LGIN: Low-grade intraepithelial neoplasias |
| Oral Cavity |  | EOLP: Erosive Oral lichen planus |
| LP: leukoplakia |
| NEOLP: Non-erosive oral lichen planus |
| OSCC: Oral squamous cell carcinoma |
| Prostate | 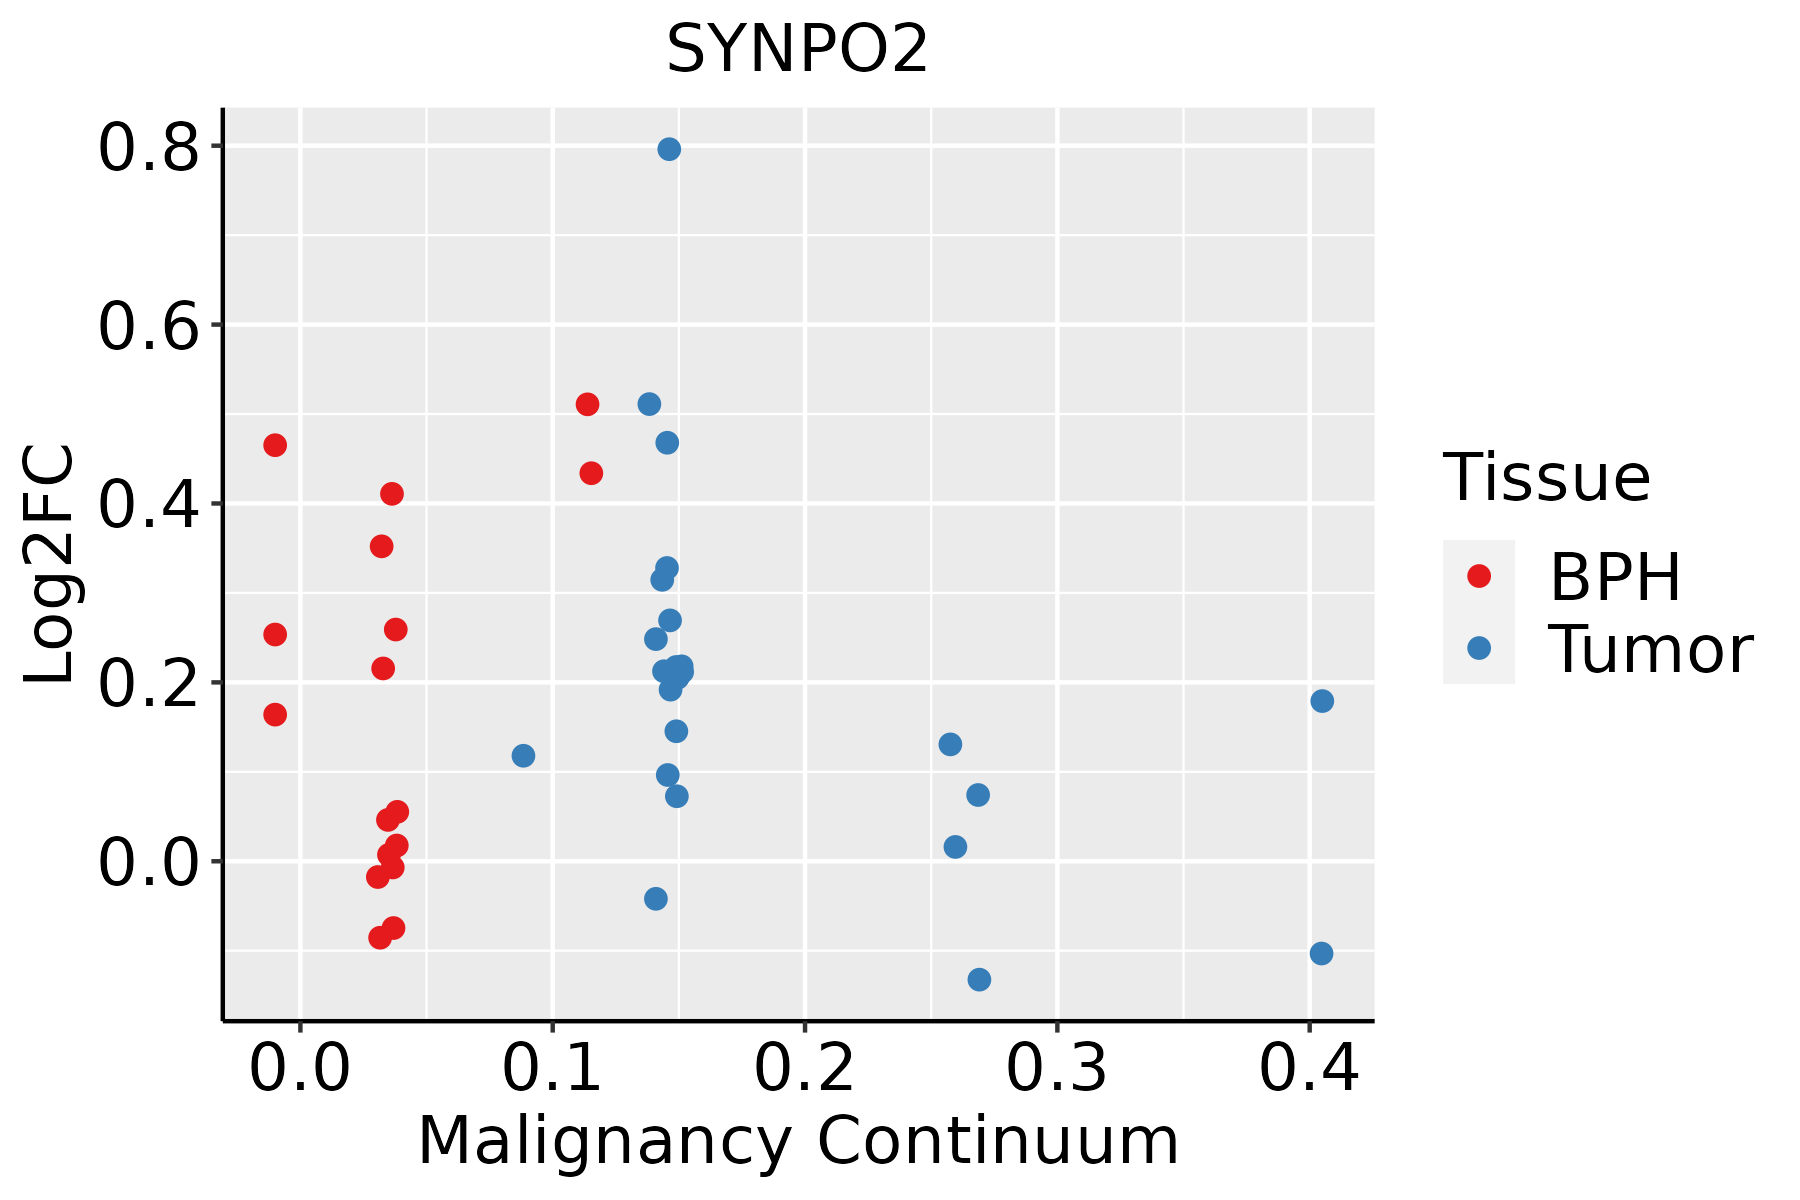 | BPH: Benign Prostatic Hyperplasia |
| Skin | 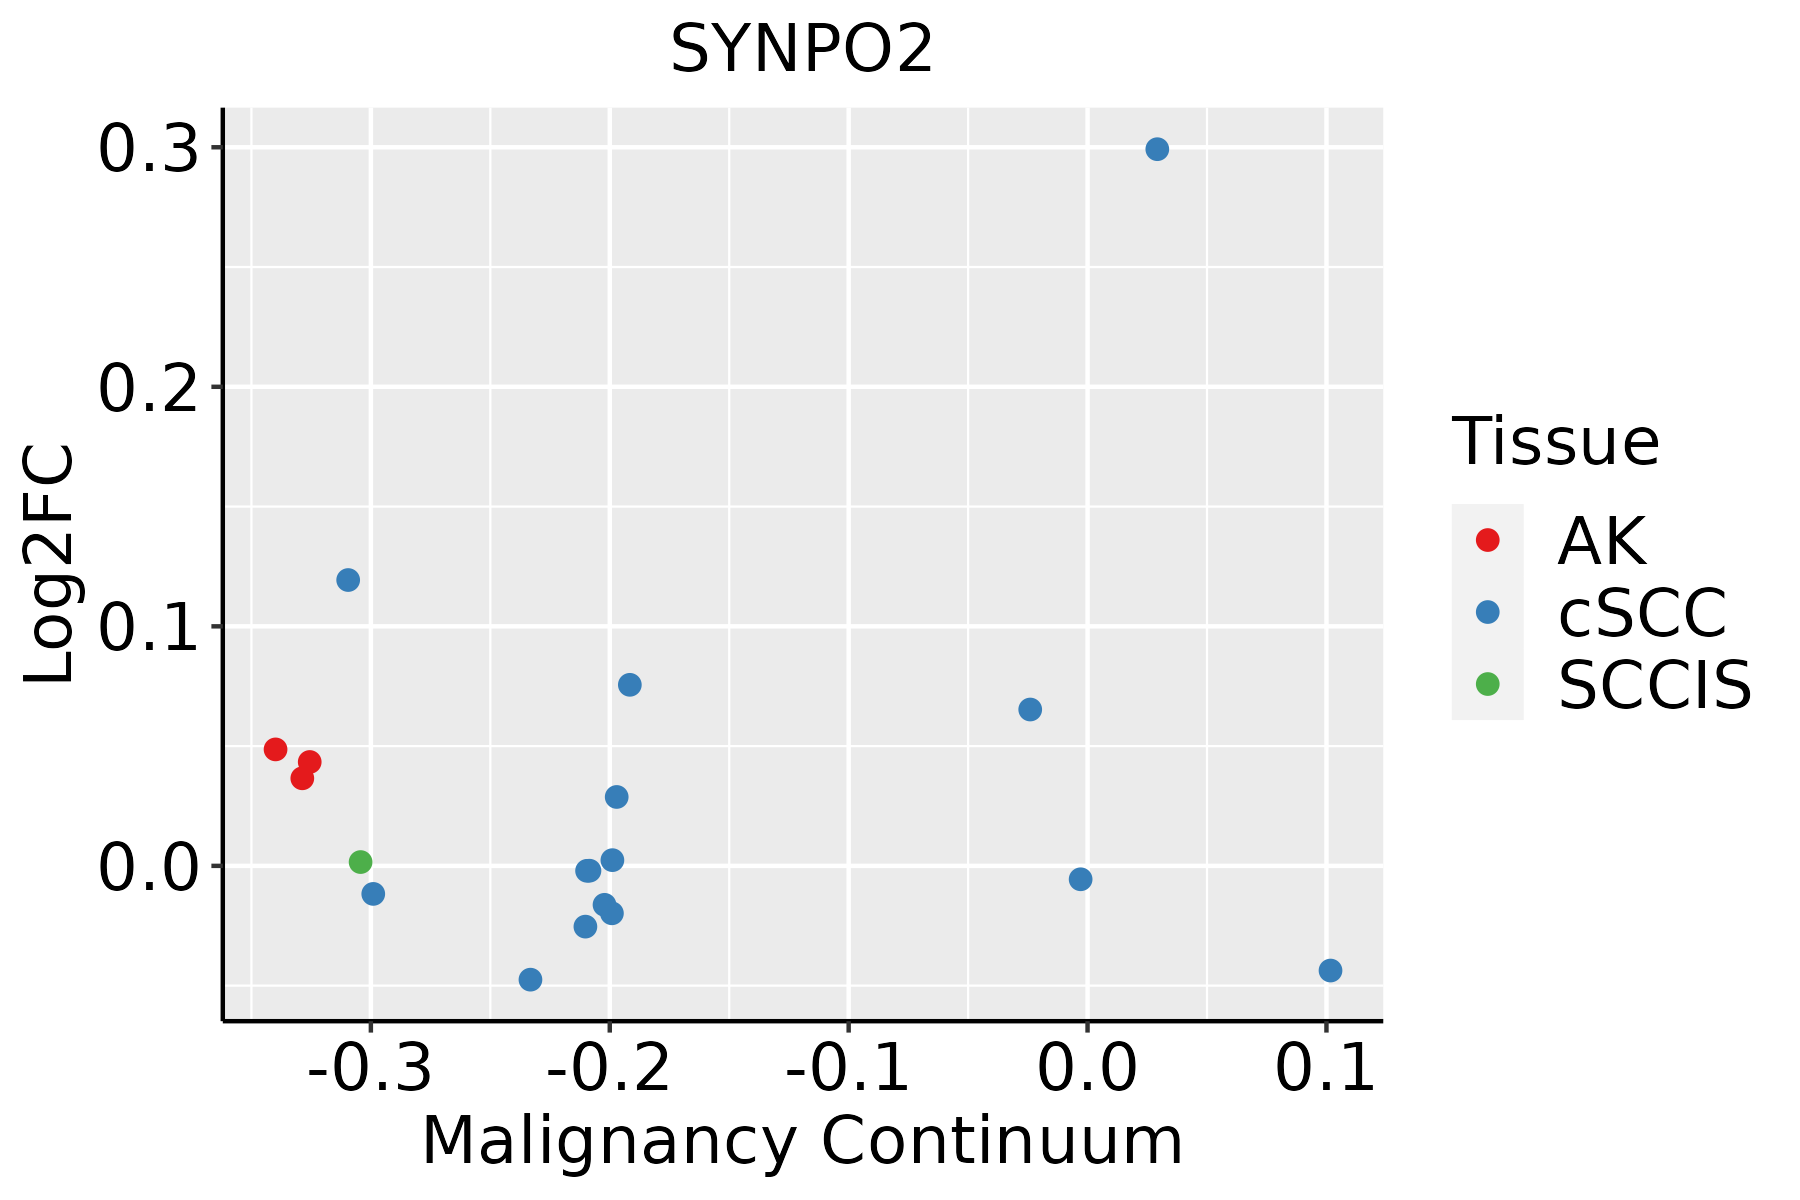 | AK: Actinic keratosis |
| cSCC: Cutaneous squamous cell carcinoma |
| SCCIS:squamous cell carcinoma in situ |
| Thyroid |  | ATC: Anaplastic thyroid cancer |
| HT: Hashimoto's thyroiditis |
| PTC: Papillary thyroid cancer |
| GO ID | Tissue | Disease Stage | Description | Gene Ratio | Bg Ratio | pvalue | p.adjust | Count |
| GO:005101719 | Prostate | Tumor | actin filament bundle assembly | 63/3246 | 157/18723 | 1.18e-11 | 9.07e-10 | 63 |
| GO:011005319 | Prostate | Tumor | regulation of actin filament organization | 94/3246 | 278/18723 | 1.77e-11 | 1.25e-09 | 94 |
| GO:006157219 | Prostate | Tumor | actin filament bundle organization | 63/3246 | 161/18723 | 4.23e-11 | 2.82e-09 | 63 |
| GO:005149517 | Prostate | Tumor | positive regulation of cytoskeleton organization | 78/3246 | 226/18723 | 3.05e-10 | 1.65e-08 | 78 |
| GO:001623614 | Prostate | Tumor | macroautophagy | 87/3246 | 291/18723 | 7.82e-08 | 2.16e-06 | 87 |
| GO:003223118 | Prostate | Tumor | regulation of actin filament bundle assembly | 40/3246 | 105/18723 | 3.34e-07 | 7.55e-06 | 40 |
| GO:003223316 | Prostate | Tumor | positive regulation of actin filament bundle assembly | 25/3246 | 63/18723 | 2.28e-05 | 2.88e-04 | 25 |
| GO:000703312 | Prostate | Tumor | vacuole organization | 47/3246 | 180/18723 | 1.95e-03 | 1.13e-02 | 47 |
| GO:006168414 | Prostate | Tumor | chaperone-mediated autophagy | 8/3246 | 16/18723 | 2.78e-03 | 1.51e-02 | 8 |
| GO:000004511 | Prostate | Tumor | autophagosome assembly | 27/3246 | 99/18723 | 8.94e-03 | 3.87e-02 | 27 |
| GO:001623619 | Skin | cSCC | macroautophagy | 136/4864 | 291/18723 | 1.36e-14 | 9.78e-13 | 136 |
| GO:190290329 | Skin | cSCC | regulation of supramolecular fiber organization | 145/4864 | 383/18723 | 1.67e-07 | 3.71e-06 | 145 |
| GO:00070337 | Skin | cSCC | vacuole organization | 77/4864 | 180/18723 | 6.65e-07 | 1.26e-05 | 77 |
| GO:000701529 | Skin | cSCC | actin filament organization | 156/4864 | 442/18723 | 7.37e-06 | 1.02e-04 | 156 |
| GO:003297029 | Skin | cSCC | regulation of actin filament-based process | 142/4864 | 397/18723 | 8.50e-06 | 1.13e-04 | 142 |
| GO:1902905112 | Skin | cSCC | positive regulation of supramolecular fiber organization | 83/4864 | 209/18723 | 8.87e-06 | 1.17e-04 | 83 |
| GO:0110053111 | Skin | cSCC | regulation of actin filament organization | 103/4864 | 278/18723 | 2.78e-05 | 3.12e-04 | 103 |
| GO:003295629 | Skin | cSCC | regulation of actin cytoskeleton organization | 127/4864 | 358/18723 | 3.83e-05 | 4.13e-04 | 127 |
| GO:0051495110 | Skin | cSCC | positive regulation of cytoskeleton organization | 86/4864 | 226/18723 | 4.08e-05 | 4.34e-04 | 86 |
| GO:00000456 | Skin | cSCC | autophagosome assembly | 44/4864 | 99/18723 | 5.18e-05 | 5.30e-04 | 44 |
| Hugo Symbol | Variant Class | Variant Classification | dbSNP RS | HGVSc | HGVSp | HGVSp Short | SWISSPROT | BIOTYPE | SIFT | PolyPhen | Tumor Sample Barcode | Tissue | Histology | Sex | Age | Stage | Therapy Types | Drugs | Outcome |
| SYNPO2 | SNV | Missense_Mutation | | c.3222N>G | p.Phe1074Leu | p.F1074L | Q9UMS6 | protein_coding | deleterious(0) | probably_damaging(0.997) | TCGA-A2-A0YK-01 | Breast | breast invasive carcinoma | Female | <65 | I/II | Chemotherapy | cytoxan | SD |
| SYNPO2 | SNV | Missense_Mutation | rs778638880 | c.532G>A | p.Val178Met | p.V178M | Q9UMS6 | protein_coding | tolerated(0.23) | benign(0.001) | TCGA-A7-A0CE-01 | Breast | breast invasive carcinoma | Female | <65 | I/II | Chemotherapy | adriamycin | SD |
| SYNPO2 | SNV | Missense_Mutation | | c.1988C>T | p.Ser663Leu | p.S663L | Q9UMS6 | protein_coding | deleterious(0.02) | benign(0.084) | TCGA-AN-A046-01 | Breast | breast invasive carcinoma | Female | >=65 | I/II | Unknown | Unknown | SD |
| SYNPO2 | SNV | Missense_Mutation | | c.1372N>A | p.Gln458Lys | p.Q458K | Q9UMS6 | protein_coding | tolerated(0.55) | benign(0.012) | TCGA-AR-A256-01 | Breast | breast invasive carcinoma | Female | <65 | I/II | Chemotherapy | doxorubicin | PD |
| SYNPO2 | SNV | Missense_Mutation | novel | c.1342G>A | p.Glu448Lys | p.E448K | Q9UMS6 | protein_coding | deleterious(0.02) | possibly_damaging(0.6) | TCGA-BH-A2L8-01 | Breast | breast invasive carcinoma | Female | <65 | I/II | Chemotherapy | cytoxan | CR |
| SYNPO2 | SNV | Missense_Mutation | | c.2069G>A | p.Arg690Lys | p.R690K | Q9UMS6 | protein_coding | tolerated(0.2) | probably_damaging(0.996) | TCGA-D8-A27G-01 | Breast | breast invasive carcinoma | Female | >=65 | I/II | Unknown | Unknown | SD |
| SYNPO2 | insertion | Frame_Shift_Ins | novel | c.2573_2574insCAGCAAGATAATCCAG | p.Val859SerfsTer11 | p.V859Sfs*11 | Q9UMS6 | protein_coding | | | TCGA-AO-A03R-01 | Breast | breast invasive carcinoma | Female | <65 | I/II | Chemotherapy | doxorubicin | SD |
| SYNPO2 | deletion | Frame_Shift_Del | novel | c.1869delN | p.Ala624GlnfsTer44 | p.A624Qfs*44 | Q9UMS6 | protein_coding | | | TCGA-D8-A27V-01 | Breast | breast invasive carcinoma | Female | <65 | I/II | Hormone Therapy | tamoxiphen | SD |
| SYNPO2 | deletion | Frame_Shift_Del | novel | c.1332delN | p.Val445TrpfsTer16 | p.V445Wfs*16 | Q9UMS6 | protein_coding | | | TCGA-EW-A2FV-01 | Breast | breast invasive carcinoma | Female | <65 | III/IV | Chemotherapy | docetaxel | SD |
| SYNPO2 | SNV | Missense_Mutation | novel | c.3305N>A | p.Ser1102Tyr | p.S1102Y | Q9UMS6 | protein_coding | tolerated(0.08) | possibly_damaging(0.9) | TCGA-C5-A1MJ-01 | Cervix | cervical & endocervical cancer | Female | <65 | I/II | Unknown | Unknown | SD |


