
|
|||||
|
 | |
| |
| |
| |
| |
| |
|
Gene: STXBP1 |
Gene summary for STXBP1 |
| Gene information | Species | Human | Gene symbol | STXBP1 | Gene ID | 6812 |
| Gene name | syntaxin binding protein 1 | |
| Gene Alias | DEE4 | |
| Cytomap | 9q34.11 | |
| Gene Type | protein-coding | GO ID | GO:0000003 | UniProtAcc | P61764 |
Top |
Malignant transformation analysis |
| Identification of the aberrant gene expression in precancerous and cancerous lesions by comparing the gene expression of stem-like cells in diseased tissues with normal stem cells |
| Entrez ID | Symbol | Replicates | Species | Organ | Tissue | Adj P-value | Log2FC | Malignancy |
| 6812 | STXBP1 | HTA11_1938_2000001011 | Human | Colorectum | AD | 4.00e-03 | 1.57e-01 | -0.0811 |
| 6812 | STXBP1 | HTA11_78_2000001011 | Human | Colorectum | AD | 6.68e-05 | 1.70e-01 | -0.1088 |
| 6812 | STXBP1 | HTA11_696_2000001011 | Human | Colorectum | AD | 3.83e-12 | 2.70e-01 | -0.1464 |
| 6812 | STXBP1 | HTA11_866_2000001011 | Human | Colorectum | AD | 3.85e-03 | 1.13e-01 | -0.1001 |
| 6812 | STXBP1 | HTA11_546_2000001011 | Human | Colorectum | AD | 7.78e-03 | 1.62e-01 | -0.0842 |
| 6812 | STXBP1 | HTA11_866_3004761011 | Human | Colorectum | AD | 5.92e-06 | 1.60e-01 | 0.096 |
| 6812 | STXBP1 | HTA11_11156_2000001011 | Human | Colorectum | AD | 3.72e-03 | 3.06e-01 | 0.0397 |
| 6812 | STXBP1 | HTA11_6818_2000001021 | Human | Colorectum | AD | 3.40e-07 | 2.13e-01 | 0.0588 |
| 6812 | STXBP1 | HTA11_99999970781_79442 | Human | Colorectum | MSS | 4.93e-21 | 4.31e-01 | 0.294 |
| 6812 | STXBP1 | HTA11_99999965062_69753 | Human | Colorectum | MSI-H | 2.60e-16 | 1.40e+00 | 0.3487 |
| 6812 | STXBP1 | HTA11_99999965104_69814 | Human | Colorectum | MSS | 9.27e-16 | 4.59e-01 | 0.281 |
| 6812 | STXBP1 | HTA11_99999971662_82457 | Human | Colorectum | MSS | 3.81e-24 | 5.41e-01 | 0.3859 |
| 6812 | STXBP1 | HTA11_99999974143_84620 | Human | Colorectum | MSS | 4.28e-10 | 2.00e-01 | 0.3005 |
| 6812 | STXBP1 | A001-C-119 | Human | Colorectum | FAP | 4.39e-03 | 2.40e-01 | -0.1557 |
| 6812 | STXBP1 | A002-C-021 | Human | Colorectum | FAP | 4.07e-04 | 1.43e-01 | 0.1171 |
| 6812 | STXBP1 | A001-C-104 | Human | Colorectum | FAP | 3.61e-02 | 1.17e-01 | 0.0184 |
| 6812 | STXBP1 | A015-C-006 | Human | Colorectum | FAP | 2.31e-05 | 3.64e-01 | -0.0994 |
| 6812 | STXBP1 | A001-C-007 | Human | Colorectum | CRC | 4.57e-06 | 3.03e-01 | 0.1899 |
| 6812 | STXBP1 | CRC-1-8810 | Human | Colorectum | CRC | 3.19e-14 | 4.09e-01 | 0.6257 |
| 6812 | STXBP1 | CRC-3-11773 | Human | Colorectum | CRC | 1.92e-04 | 2.09e-01 | 0.2564 |
| Page: 1 2 3 4 5 |
| Tissue | Expression Dynamics | Abbreviation |
| Colorectum (GSE201348) |  | FAP: Familial adenomatous polyposis |
| CRC: Colorectal cancer | ||
| Colorectum (HTA11) |  | AD: Adenomas |
| SER: Sessile serrated lesions | ||
| MSI-H: Microsatellite-high colorectal cancer | ||
| MSS: Microsatellite stable colorectal cancer | ||
| Esophagus |  | ESCC: Esophageal squamous cell carcinoma |
| HGIN: High-grade intraepithelial neoplasias | ||
| LGIN: Low-grade intraepithelial neoplasias | ||
| Liver | 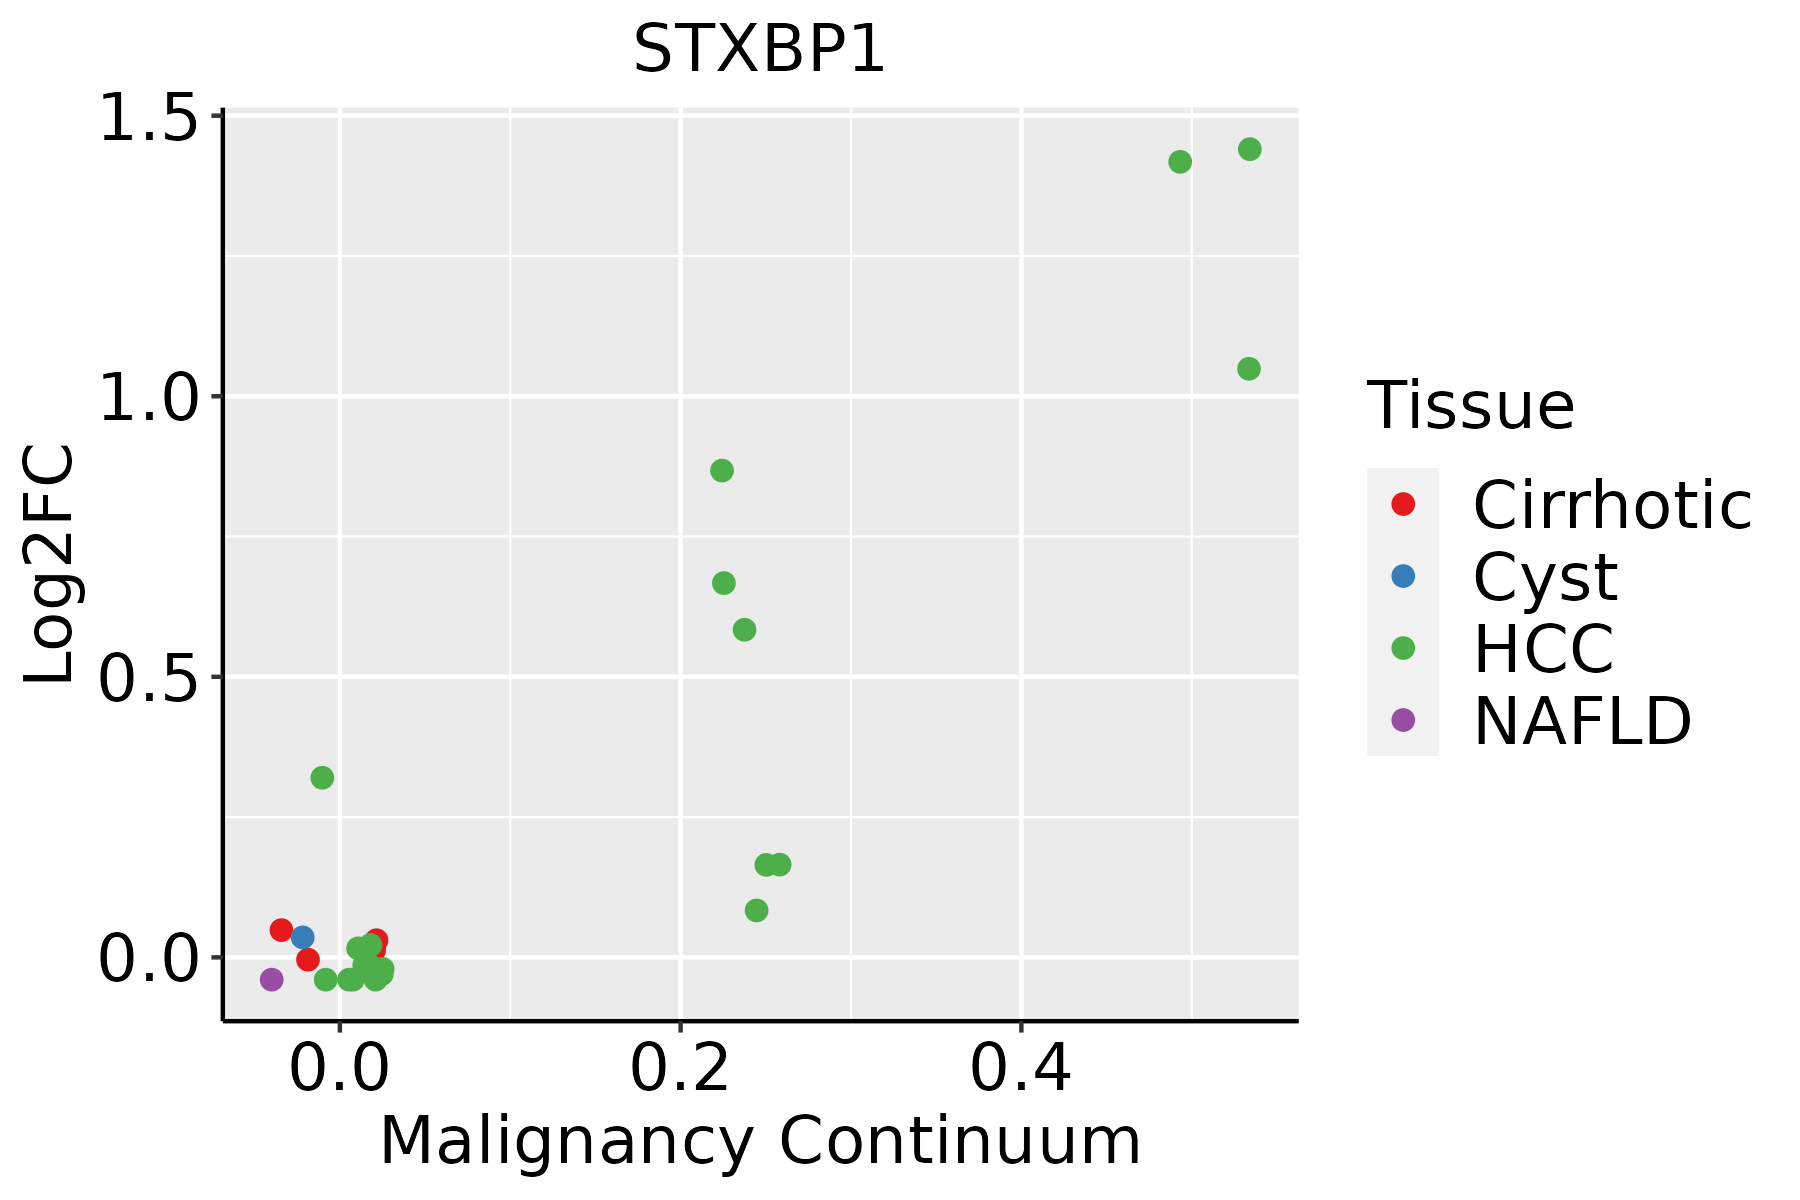 | HCC: Hepatocellular carcinoma |
| NAFLD: Non-alcoholic fatty liver disease |
| ∗log2FC in expression of this searched gene in stem-like cells from each diseased tissue sample relative to stem-like cells in normal samples in each tissue plotted against the malignancy continuum. Samples are colored based on if they are from different disease stage. |
Top |
Malignant transformation related pathway analysis |
| Find out the enriched GO biological processes and KEGG pathways involved in transition from healthy to precancer to cancer |
| Tissue | Disease Stage | Enriched GO biological Processes |
| Colorectum | AD |  |
| Colorectum | SER |  |
| Colorectum | MSS |  |
| Colorectum | MSI-H |  |
| Colorectum | FAP |  |
| ∗Top 15 enriched GO BP terms are showed in the bar plot of each disease state in each tissue. Each row represents a significant GO biological process which is colored according to the -log10(p.adjust). |
| Page: 1 2 3 4 5 6 7 8 9 |
| GO ID | Tissue | Disease Stage | Description | Gene Ratio | Bg Ratio | pvalue | p.adjust | Count |
| GO:00726595 | Colorectum | CRC | protein localization to plasma membrane | 80/2078 | 284/18723 | 1.36e-15 | 4.07e-12 | 80 |
| GO:19907785 | Colorectum | CRC | protein localization to cell periphery | 85/2078 | 333/18723 | 8.75e-14 | 1.05e-10 | 85 |
| GO:00432545 | Colorectum | CRC | regulation of protein-containing complex assembly | 87/2078 | 428/18723 | 1.38e-08 | 2.67e-06 | 87 |
| GO:00074094 | Colorectum | CRC | axonogenesis | 81/2078 | 418/18723 | 3.60e-07 | 2.99e-05 | 81 |
| GO:00516564 | Colorectum | CRC | establishment of organelle localization | 76/2078 | 390/18723 | 6.53e-07 | 4.50e-05 | 76 |
| GO:00420605 | Colorectum | CRC | wound healing | 80/2078 | 422/18723 | 1.06e-06 | 6.54e-05 | 80 |
| GO:00615644 | Colorectum | CRC | axon development | 86/2078 | 467/18723 | 1.48e-06 | 8.12e-05 | 86 |
| GO:00508215 | Colorectum | CRC | protein stabilization | 44/2078 | 191/18723 | 1.77e-06 | 8.92e-05 | 44 |
| GO:00990033 | Colorectum | CRC | vesicle-mediated transport in synapse | 45/2078 | 200/18723 | 2.67e-06 | 1.25e-04 | 45 |
| GO:00316475 | Colorectum | CRC | regulation of protein stability | 58/2078 | 298/18723 | 1.38e-05 | 4.37e-04 | 58 |
| GO:00341095 | Colorectum | CRC | homotypic cell-cell adhesion | 24/2078 | 90/18723 | 3.19e-05 | 8.20e-04 | 24 |
| GO:00160504 | Colorectum | CRC | vesicle organization | 57/2078 | 300/18723 | 3.36e-05 | 8.57e-04 | 57 |
| GO:00995042 | Colorectum | CRC | synaptic vesicle cycle | 39/2078 | 181/18723 | 3.43e-05 | 8.71e-04 | 39 |
| GO:00709975 | Colorectum | CRC | neuron death | 65/2078 | 361/18723 | 5.55e-05 | 1.26e-03 | 65 |
| GO:00313335 | Colorectum | CRC | negative regulation of protein-containing complex assembly | 31/2078 | 141/18723 | 1.42e-04 | 2.62e-03 | 31 |
| GO:19012154 | Colorectum | CRC | negative regulation of neuron death | 41/2078 | 208/18723 | 1.79e-04 | 3.17e-03 | 41 |
| GO:19012145 | Colorectum | CRC | regulation of neuron death | 57/2078 | 319/18723 | 1.90e-04 | 3.30e-03 | 57 |
| GO:00508785 | Colorectum | CRC | regulation of body fluid levels | 65/2078 | 379/18723 | 2.38e-04 | 3.96e-03 | 65 |
| GO:00514025 | Colorectum | CRC | neuron apoptotic process | 45/2078 | 246/18723 | 5.12e-04 | 7.21e-03 | 45 |
| GO:00224064 | Colorectum | CRC | membrane docking | 20/2078 | 86/18723 | 9.78e-04 | 1.17e-02 | 20 |
| Page: 1 2 3 4 5 6 7 8 9 10 |
| Pathway ID | Tissue | Disease Stage | Description | Gene Ratio | Bg Ratio | pvalue | p.adjust | qvalue | Count |
| Page: 1 |
Top |
Cell-cell communication analysis |
| Identification of potential cell-cell interactions between two cell types and their ligand-receptor pairs for different disease states |
| Ligand | Receptor | LRpair | Pathway | Tissue | Disease Stage |
| Page: 1 |
Top |
Single-cell gene regulatory network inference analysis |
| Find out the significant the regulons (TFs) and the target genes of each regulon across cell types for different disease states |
| TF | Cell Type | Tissue | Disease Stage | Target Gene | RSS | Regulon Activity |
| ∗The dot plots of a searched regulon are shown for all cell subpopulations in each disease state of each tissue based on the regulon specific score inferred using pySCENIC and by calculating the average expression. |
| Page: 1 |
Top |
Somatic mutation of malignant transformation related genes |
| Annotation of somatic variants for genes involved in malignant transformation |
| Hugo Symbol | Variant Class | Variant Classification | dbSNP RS | HGVSc | HGVSp | HGVSp Short | SWISSPROT | BIOTYPE | SIFT | PolyPhen | Tumor Sample Barcode | Tissue | Histology | Sex | Age | Stage | Therapy Types | Drugs | Outcome |
| STXBP1 | SNV | Missense_Mutation | novel | c.605N>A | p.Ala202Asp | p.A202D | P61764 | protein_coding | deleterious(0) | possibly_damaging(0.816) | TCGA-AN-A046-01 | Breast | breast invasive carcinoma | Female | >=65 | I/II | Unknown | Unknown | SD |
| STXBP1 | SNV | Missense_Mutation | c.406G>A | p.Ala136Thr | p.A136T | P61764 | protein_coding | deleterious(0.01) | probably_damaging(0.996) | TCGA-BH-A0AW-01 | Breast | breast invasive carcinoma | Female | <65 | I/II | Chemotherapy | carboplatin | SD | |
| STXBP1 | SNV | Missense_Mutation | c.821N>T | p.Ala274Val | p.A274V | P61764 | protein_coding | tolerated(0.23) | benign(0.005) | TCGA-C8-A131-01 | Breast | breast invasive carcinoma | Female | >=65 | III/IV | Chemotherapy | 5-fluorouracil | CR | |
| STXBP1 | insertion | Frame_Shift_Ins | novel | c.1327_1328insTCATATT | p.Met443IlefsTer51 | p.M443Ifs*51 | P61764 | protein_coding | TCGA-AN-A0FX-01 | Breast | breast invasive carcinoma | Female | <65 | I/II | Unknown | Unknown | SD | ||
| STXBP1 | insertion | Nonsense_Mutation | novel | c.1329_1330insTCCGTGCCAGGTTTTTAATTGGTTTCCATTTTT | p.Met443_Ala444insSerValProGlyPheTerLeuValSerIlePhe | p.M443_A444insSVPGF*LVSIF | P61764 | protein_coding | TCGA-AN-A0FX-01 | Breast | breast invasive carcinoma | Female | <65 | I/II | Unknown | Unknown | SD | ||
| STXBP1 | insertion | In_Frame_Ins | novel | c.1646_1647insCCTTCTCAT | p.Glu549delinsAspLeuLeuMet | p.E549delinsDLLM | P61764 | protein_coding | TCGA-BH-A0AY-01 | Breast | breast invasive carcinoma | Female | <65 | I/II | Chemotherapy | SD | |||
| STXBP1 | insertion | In_Frame_Ins | novel | c.1647_1648insGCAGCAGAGGTAAAACGTTTTTTGCCAAAT | p.Glu549_Met550insAlaAlaGluValLysArgPheLeuProAsn | p.E549_M550insAAEVKRFLPN | P61764 | protein_coding | TCGA-BH-A0AY-01 | Breast | breast invasive carcinoma | Female | <65 | I/II | Chemotherapy | SD | |||
| STXBP1 | SNV | Missense_Mutation | novel | c.278N>G | p.Asp93Gly | p.D93G | P61764 | protein_coding | tolerated(0.65) | benign(0.009) | TCGA-2W-A8YY-01 | Cervix | cervical & endocervical cancer | Female | <65 | I/II | Chemotherapy | cisplatin | CR |
| STXBP1 | SNV | Missense_Mutation | novel | c.495N>T | p.Lys165Asn | p.K165N | P61764 | protein_coding | deleterious(0.04) | possibly_damaging(0.572) | TCGA-2W-A8YY-01 | Cervix | cervical & endocervical cancer | Female | <65 | I/II | Chemotherapy | cisplatin | CR |
| STXBP1 | SNV | Missense_Mutation | rs794727970 | c.704N>A | p.Arg235Gln | p.R235Q | P61764 | protein_coding | deleterious(0.01) | probably_damaging(1) | TCGA-C5-A1BK-01 | Cervix | cervical & endocervical cancer | Female | <65 | I/II | Unknown | Unknown | SD |
| Page: 1 2 3 4 5 6 7 8 |
Top |
Related drugs of malignant transformation related genes |
| Identification of chemicals and drugs interact with genes involved in malignant transfromation |
| (DGIdb 4.0) |
| Entrez ID | Symbol | Category | Interaction Types | Drug Claim Name | Drug Name | PMIDs |
| Page: 1 |

Copyright 2023-Present -The University of Texas Health Science Center at Houston |