
|
|||||
|
 | |
| |
| |
| |
| |
| |
|
Gene: STC1 |
Gene summary for STC1 |
| Gene information | Species | Human | Gene symbol | STC1 | Gene ID | 6781 |
| Gene name | stanniocalcin 1 | |
| Gene Alias | STC | |
| Cytomap | 8p21.2 | |
| Gene Type | protein-coding | GO ID | GO:0000003 | UniProtAcc | P52823 |
Top |
Malignant transformation analysis |
| Identification of the aberrant gene expression in precancerous and cancerous lesions by comparing the gene expression of stem-like cells in diseased tissues with normal stem cells |
| Entrez ID | Symbol | Replicates | Species | Organ | Tissue | Adj P-value | Log2FC | Malignancy |
| 6781 | STC1 | GSM4909291 | Human | Breast | IDC | 7.08e-12 | 4.35e-01 | 0.1753 |
| 6781 | STC1 | GSM4909296 | Human | Breast | IDC | 1.57e-03 | -1.37e-01 | 0.1524 |
| 6781 | STC1 | GSM4909308 | Human | Breast | IDC | 6.60e-14 | 3.30e-01 | 0.158 |
| 6781 | STC1 | GSM4909319 | Human | Breast | IDC | 1.12e-09 | 1.92e-01 | 0.1563 |
| 6781 | STC1 | brca1 | Human | Breast | Precancer | 3.51e-04 | -1.34e-01 | -0.0338 |
| 6781 | STC1 | brca10 | Human | Breast | Precancer | 4.77e-05 | 2.51e-01 | -0.0029 |
| 6781 | STC1 | DCIS2 | Human | Breast | DCIS | 9.19e-26 | 5.55e-01 | 0.0085 |
| 6781 | STC1 | LZE8T | Human | Esophagus | ESCC | 2.15e-05 | 5.99e-01 | 0.067 |
| 6781 | STC1 | LZE6T | Human | Esophagus | ESCC | 2.10e-16 | 7.35e-01 | 0.0845 |
| 6781 | STC1 | P2T-E | Human | Esophagus | ESCC | 1.14e-08 | 3.62e-01 | 0.1177 |
| 6781 | STC1 | P4T-E | Human | Esophagus | ESCC | 4.08e-04 | 2.26e-01 | 0.1323 |
| 6781 | STC1 | P16T-E | Human | Esophagus | ESCC | 7.06e-05 | 2.27e-01 | 0.1153 |
| 6781 | STC1 | P19T-E | Human | Esophagus | ESCC | 4.19e-02 | 7.63e-01 | 0.1662 |
| 6781 | STC1 | P26T-E | Human | Esophagus | ESCC | 8.40e-11 | 4.66e-01 | 0.1276 |
| 6781 | STC1 | P36T-E | Human | Esophagus | ESCC | 1.17e-15 | 2.00e+00 | 0.1187 |
| 6781 | STC1 | P37T-E | Human | Esophagus | ESCC | 1.13e-13 | 6.07e-01 | 0.1371 |
| 6781 | STC1 | P56T-E | Human | Esophagus | ESCC | 1.43e-06 | 6.77e-01 | 0.1613 |
| 6781 | STC1 | P76T-E | Human | Esophagus | ESCC | 8.69e-04 | 4.93e-01 | 0.1207 |
| 6781 | STC1 | P89T-E | Human | Esophagus | ESCC | 1.03e-10 | 2.42e+00 | 0.1752 |
| 6781 | STC1 | P107T-E | Human | Esophagus | ESCC | 3.38e-06 | 4.27e-01 | 0.171 |
| Page: 1 2 3 |
| Tissue | Expression Dynamics | Abbreviation |
| Breast | 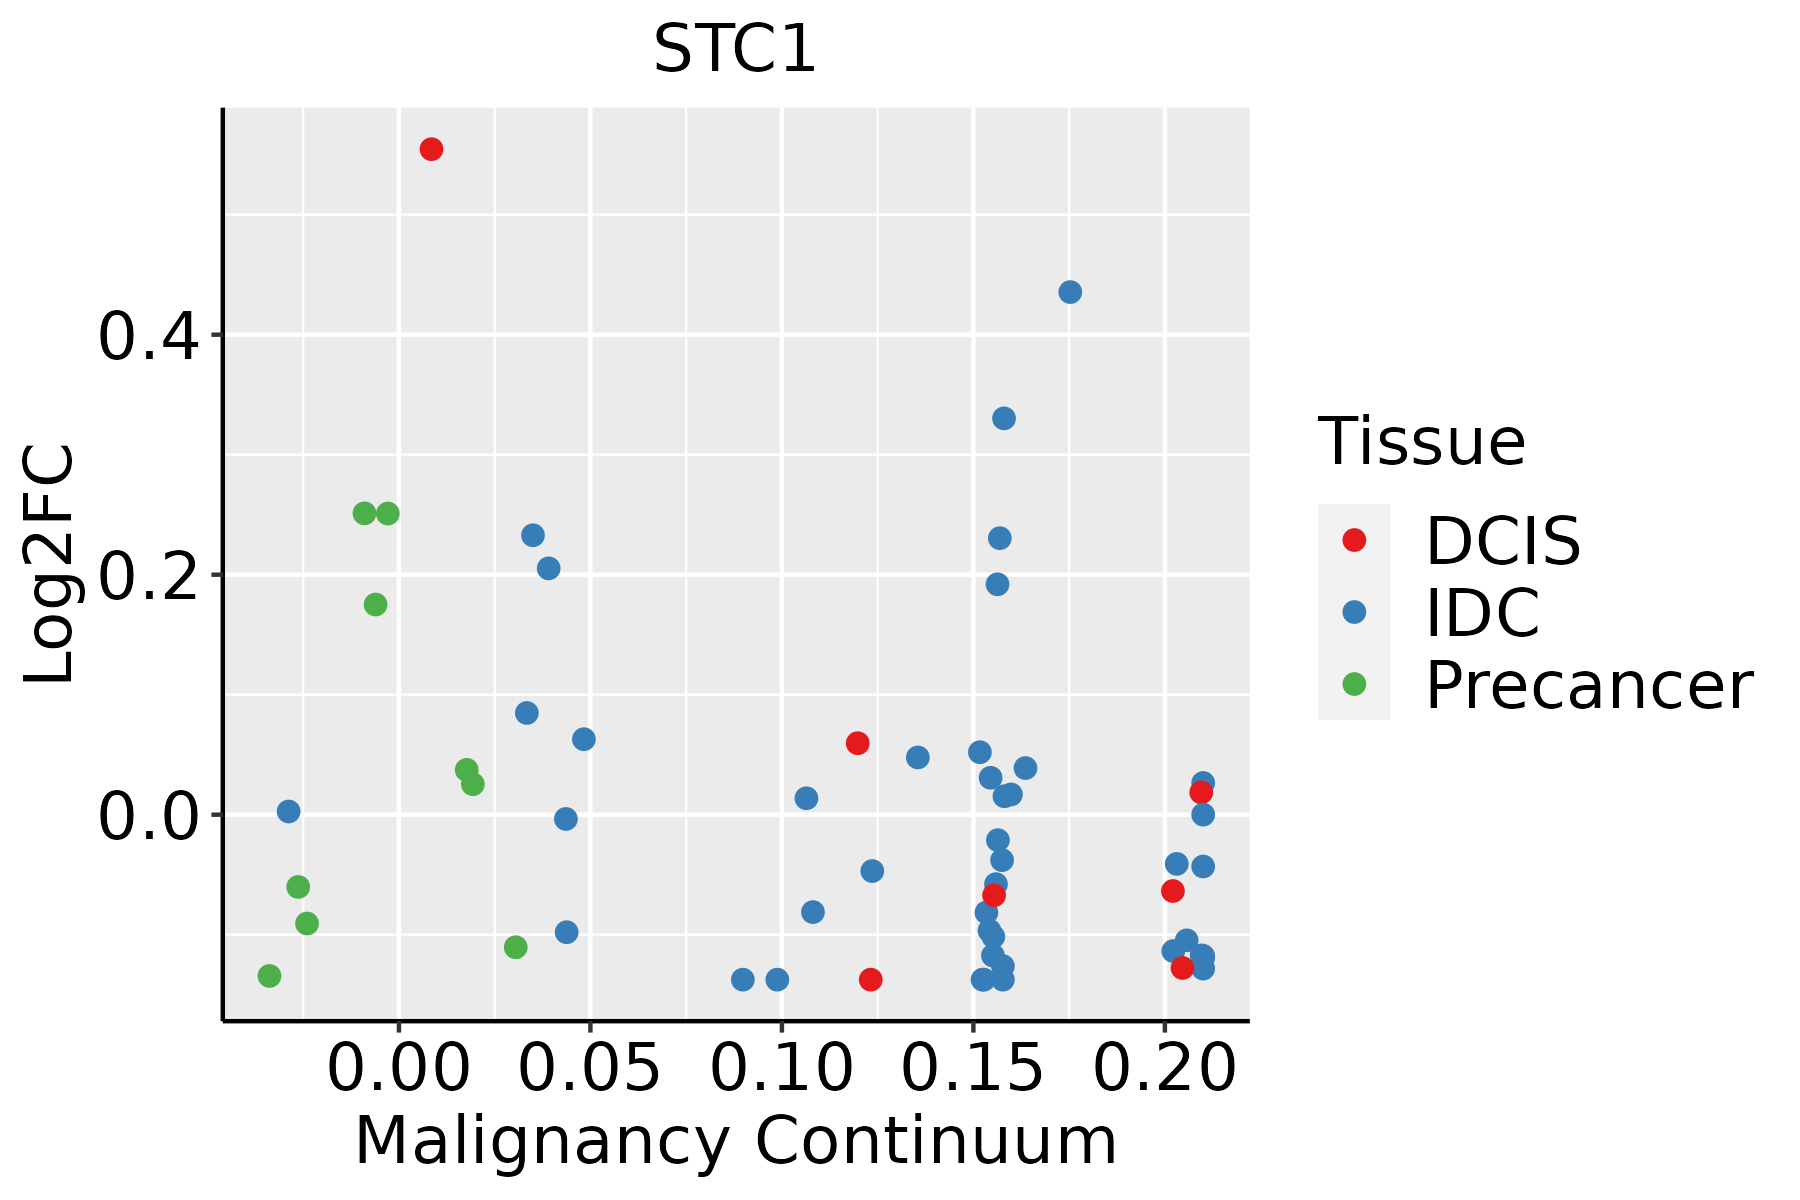 | IDC: Invasive ductal carcinoma |
| DCIS: Ductal carcinoma in situ | ||
| Precancer(BRCA1-mut): Precancerous lesion from BRCA1 mutation carriers | ||
| Esophagus | 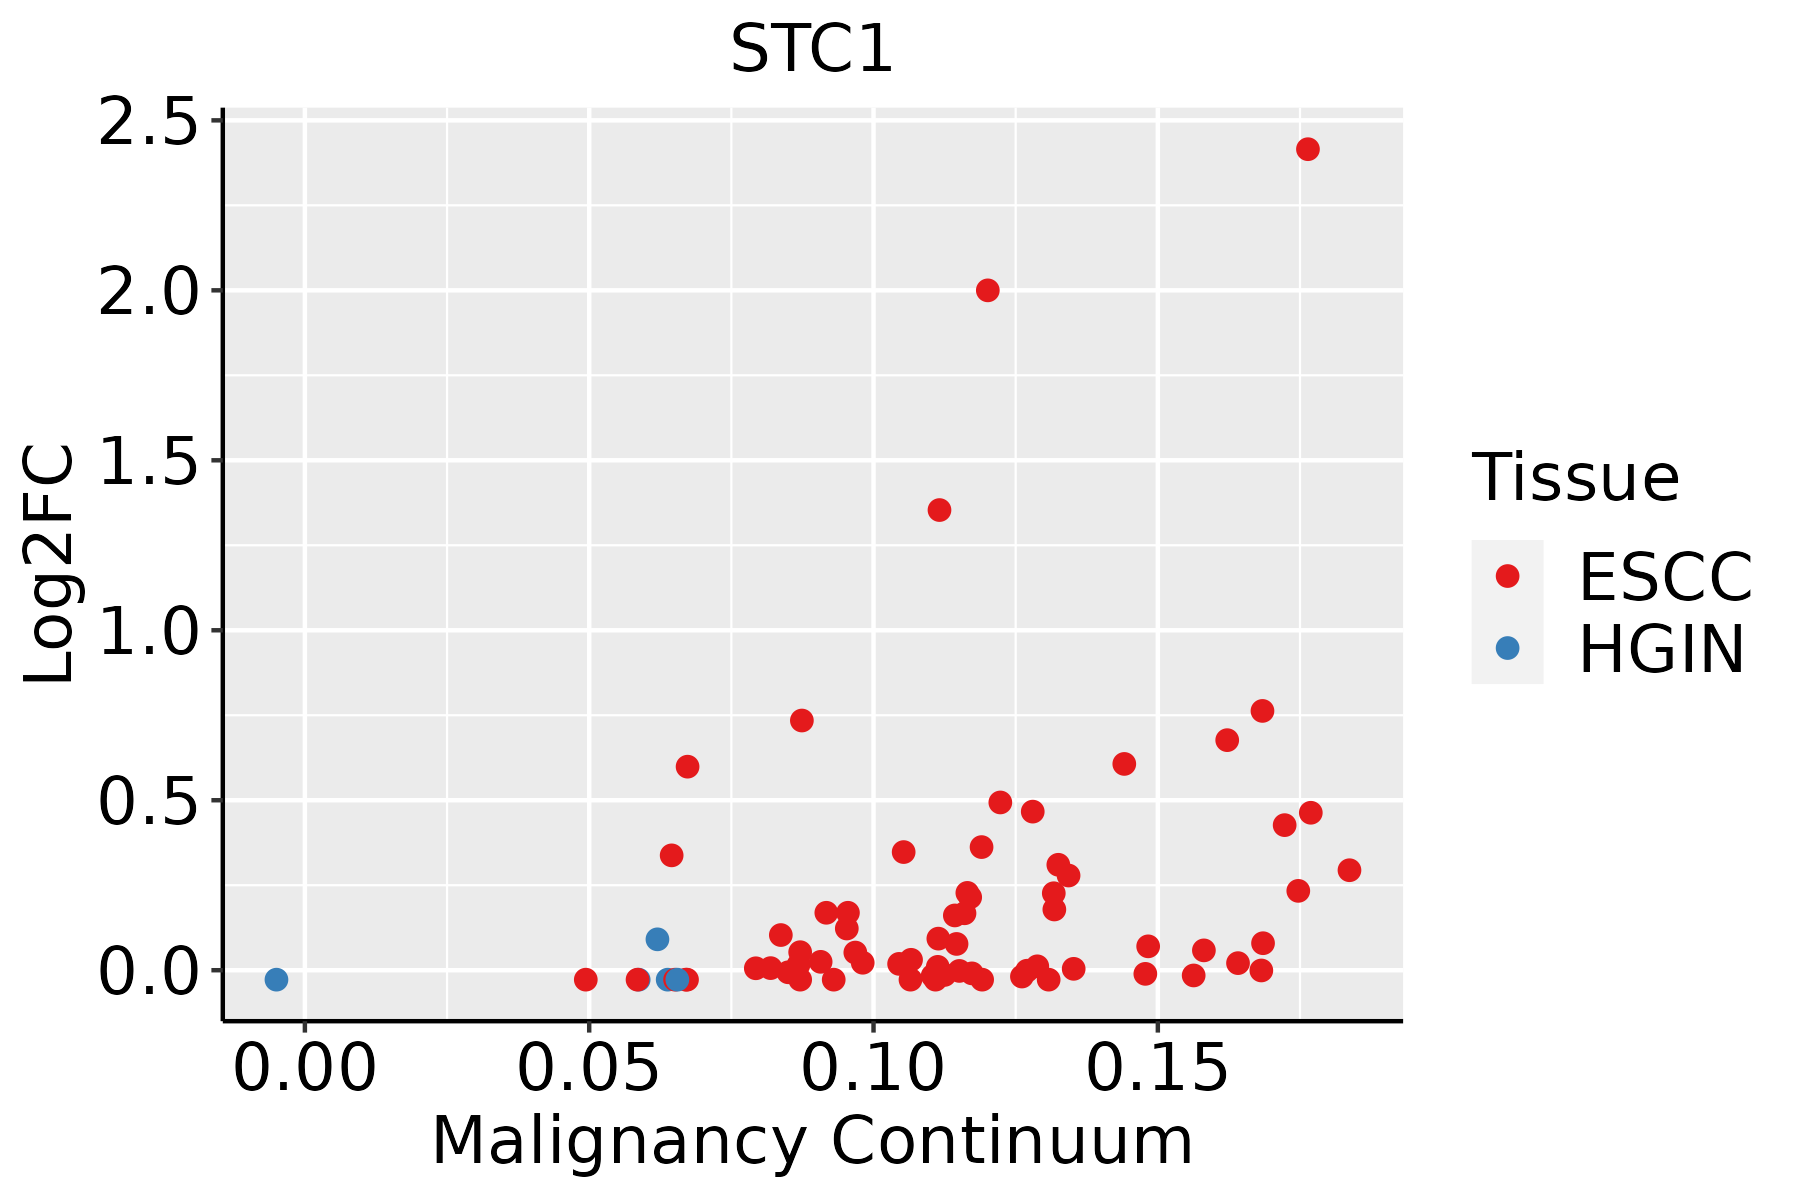 | ESCC: Esophageal squamous cell carcinoma |
| HGIN: High-grade intraepithelial neoplasias | ||
| LGIN: Low-grade intraepithelial neoplasias | ||
| Liver | 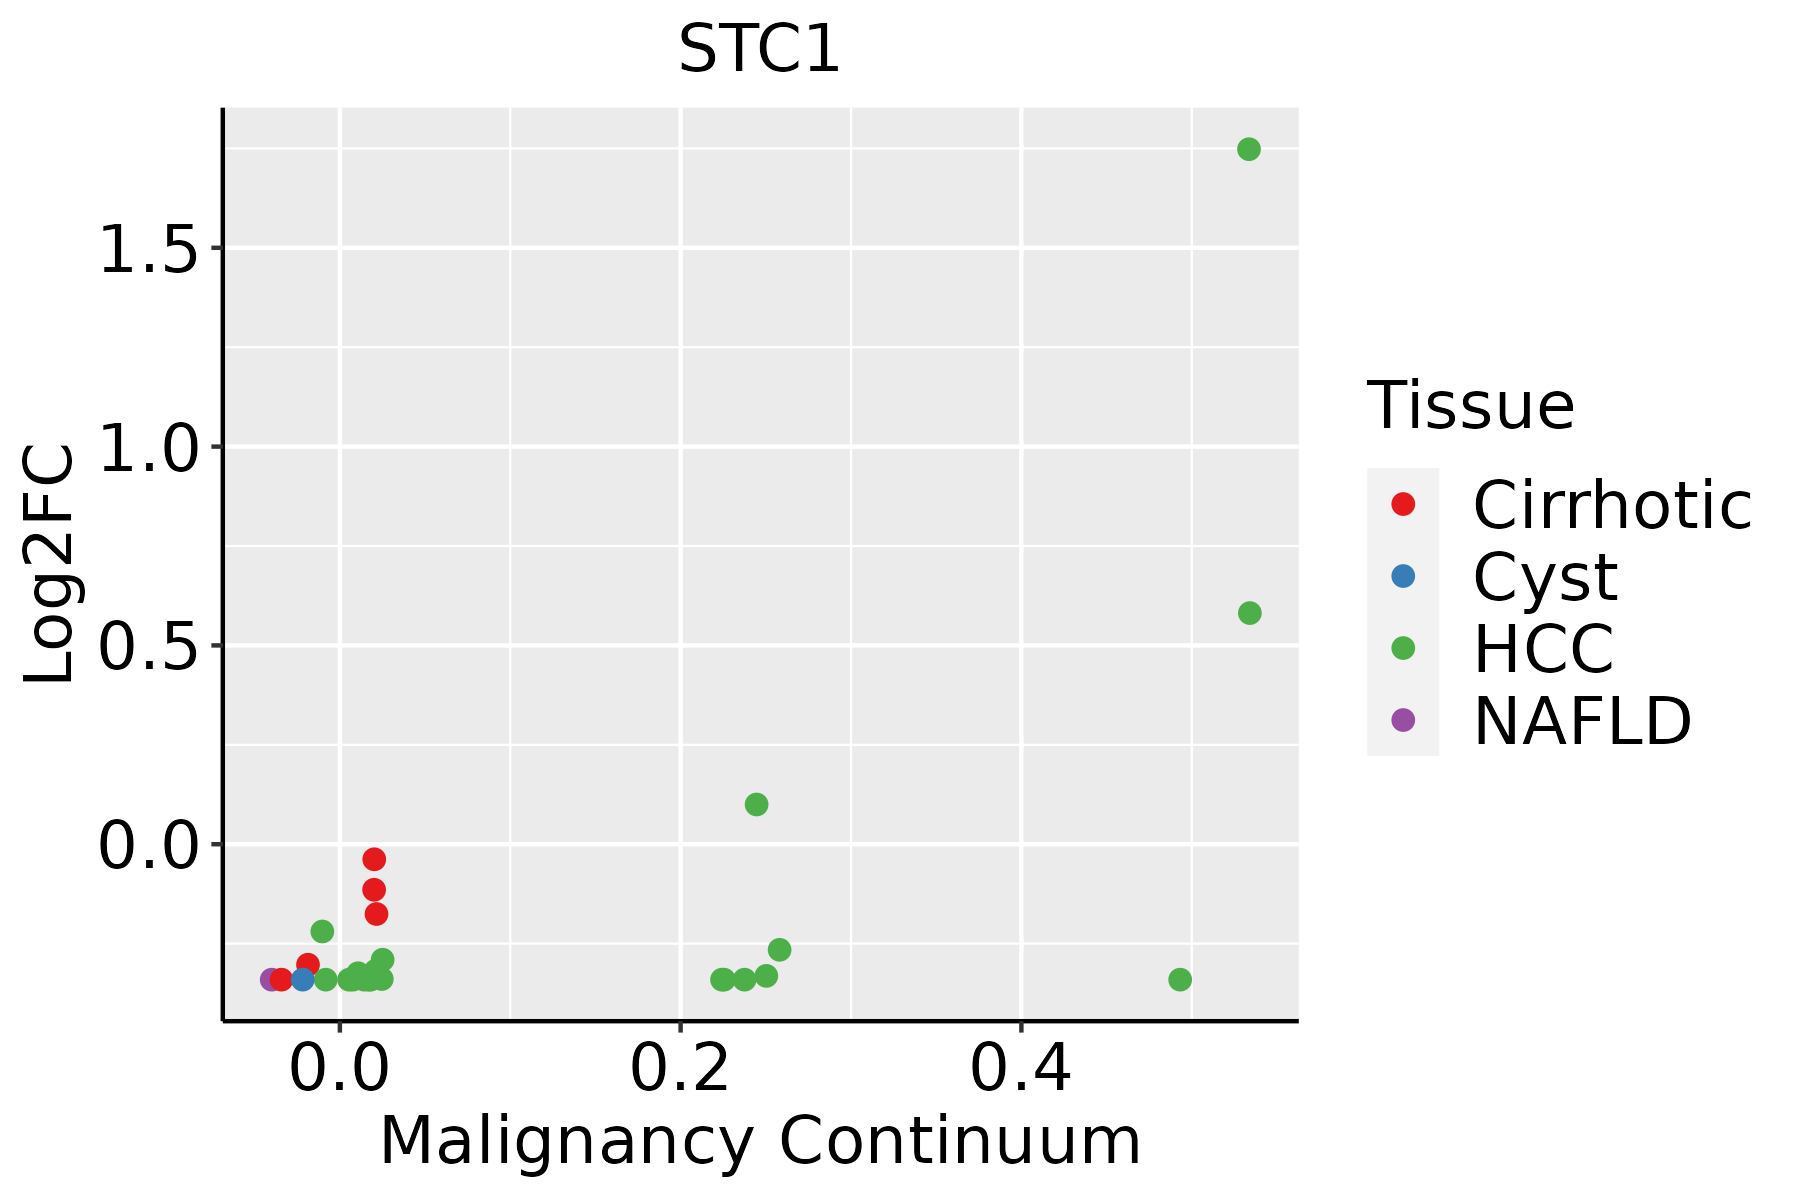 | HCC: Hepatocellular carcinoma |
| NAFLD: Non-alcoholic fatty liver disease | ||
| Thyroid |  | ATC: Anaplastic thyroid cancer |
| HT: Hashimoto's thyroiditis | ||
| PTC: Papillary thyroid cancer |
| ∗log2FC in expression of this searched gene in stem-like cells from each diseased tissue sample relative to stem-like cells in normal samples in each tissue plotted against the malignancy continuum. Samples are colored based on if they are from different disease stage. |
Top |
Malignant transformation related pathway analysis |
| Find out the enriched GO biological processes and KEGG pathways involved in transition from healthy to precancer to cancer |
| Tissue | Disease Stage | Enriched GO biological Processes |
| Colorectum | AD |  |
| Colorectum | SER |  |
| Colorectum | MSS |  |
| Colorectum | MSI-H |  |
| Colorectum | FAP |  |
| ∗Top 15 enriched GO BP terms are showed in the bar plot of each disease state in each tissue. Each row represents a significant GO biological process which is colored according to the -log10(p.adjust). |
| Page: 1 2 3 4 5 6 7 8 9 |
| GO ID | Tissue | Disease Stage | Description | Gene Ratio | Bg Ratio | pvalue | p.adjust | Count |
| GO:001063221 | Breast | DCIS | regulation of epithelial cell migration | 43/1390 | 292/18723 | 1.23e-05 | 3.13e-04 | 43 |
| GO:006013511 | Breast | DCIS | maternal process involved in female pregnancy | 15/1390 | 62/18723 | 3.55e-05 | 7.70e-04 | 15 |
| GO:005159123 | Breast | DCIS | response to cAMP | 19/1390 | 93/18723 | 4.43e-05 | 9.29e-04 | 19 |
| GO:004354221 | Breast | DCIS | endothelial cell migration | 40/1390 | 279/18723 | 4.54e-05 | 9.49e-04 | 40 |
| GO:000189022 | Breast | DCIS | placenta development | 25/1390 | 144/18723 | 5.57e-05 | 1.13e-03 | 25 |
| GO:005127111 | Breast | DCIS | negative regulation of cellular component movement | 48/1390 | 367/18723 | 8.97e-05 | 1.69e-03 | 48 |
| GO:00075662 | Breast | DCIS | embryo implantation | 13/1390 | 53/18723 | 1.00e-04 | 1.82e-03 | 13 |
| GO:003166723 | Breast | DCIS | response to nutrient levels | 58/1390 | 474/18723 | 1.16e-04 | 2.03e-03 | 58 |
| GO:000189311 | Breast | DCIS | maternal placenta development | 10/1390 | 35/18723 | 1.62e-04 | 2.71e-03 | 10 |
| GO:200014611 | Breast | DCIS | negative regulation of cell motility | 46/1390 | 359/18723 | 2.01e-04 | 3.23e-03 | 46 |
| GO:000758422 | Breast | DCIS | response to nutrient | 27/1390 | 174/18723 | 2.05e-04 | 3.28e-03 | 27 |
| GO:00105942 | Breast | DCIS | regulation of endothelial cell migration | 33/1390 | 232/18723 | 2.35e-04 | 3.70e-03 | 33 |
| GO:004668322 | Breast | DCIS | response to organophosphorus | 22/1390 | 131/18723 | 2.49e-04 | 3.86e-03 | 22 |
| GO:001095921 | Breast | DCIS | regulation of metal ion transport | 50/1390 | 406/18723 | 2.86e-04 | 4.22e-03 | 50 |
| GO:00466971 | Breast | DCIS | decidualization | 8/1390 | 26/18723 | 4.21e-04 | 5.66e-03 | 8 |
| GO:003033611 | Breast | DCIS | negative regulation of cell migration | 43/1390 | 344/18723 | 5.41e-04 | 6.96e-03 | 43 |
| GO:001407422 | Breast | DCIS | response to purine-containing compound | 23/1390 | 148/18723 | 5.74e-04 | 7.34e-03 | 23 |
| GO:004001311 | Breast | DCIS | negative regulation of locomotion | 47/1390 | 391/18723 | 7.30e-04 | 8.69e-03 | 47 |
| GO:007138422 | Breast | DCIS | cellular response to corticosteroid stimulus | 12/1390 | 61/18723 | 1.54e-03 | 1.54e-02 | 12 |
| GO:004327011 | Breast | DCIS | positive regulation of ion transport | 34/1390 | 275/18723 | 2.35e-03 | 2.13e-02 | 34 |
| Page: 1 2 3 4 5 6 7 8 9 10 11 12 13 14 15 16 17 18 |
| Pathway ID | Tissue | Disease Stage | Description | Gene Ratio | Bg Ratio | pvalue | p.adjust | qvalue | Count |
| Page: 1 |
Top |
Cell-cell communication analysis |
| Identification of potential cell-cell interactions between two cell types and their ligand-receptor pairs for different disease states |
| Ligand | Receptor | LRpair | Pathway | Tissue | Disease Stage |
| Page: 1 |
Top |
Single-cell gene regulatory network inference analysis |
| Find out the significant the regulons (TFs) and the target genes of each regulon across cell types for different disease states |
| TF | Cell Type | Tissue | Disease Stage | Target Gene | RSS | Regulon Activity |
| ∗The dot plots of a searched regulon are shown for all cell subpopulations in each disease state of each tissue based on the regulon specific score inferred using pySCENIC and by calculating the average expression. |
| Page: 1 |
Top |
Somatic mutation of malignant transformation related genes |
| Annotation of somatic variants for genes involved in malignant transformation |
| Hugo Symbol | Variant Class | Variant Classification | dbSNP RS | HGVSc | HGVSp | HGVSp Short | SWISSPROT | BIOTYPE | SIFT | PolyPhen | Tumor Sample Barcode | Tissue | Histology | Sex | Age | Stage | Therapy Types | Drugs | Outcome |
| STC1 | SNV | Missense_Mutation | c.368A>G | p.Glu123Gly | p.E123G | P52823 | protein_coding | deleterious(0) | possibly_damaging(0.478) | TCGA-BH-A18G-01 | Breast | breast invasive carcinoma | Female | >=65 | I/II | Unknown | Unknown | SD | |
| STC1 | SNV | Missense_Mutation | c.299C>T | p.Ala100Val | p.A100V | P52823 | protein_coding | deleterious(0.03) | benign(0.225) | TCGA-S3-A6ZG-01 | Breast | breast invasive carcinoma | Female | >=65 | I/II | Chemotherapy | doxorubicin | CR | |
| STC1 | SNV | Missense_Mutation | rs758995378 | c.274N>A | p.Val92Ile | p.V92I | P52823 | protein_coding | tolerated(0.58) | probably_damaging(0.988) | TCGA-BI-A0VR-01 | Cervix | cervical & endocervical cancer | Female | <65 | III/IV | Unknown | Unknown | SD |
| STC1 | SNV | Missense_Mutation | novel | c.441G>T | p.Glu147Asp | p.E147D | P52823 | protein_coding | tolerated(0.07) | probably_damaging(0.992) | TCGA-DS-A3LQ-01 | Cervix | cervical & endocervical cancer | Female | <65 | III/IV | Chemotherapy | cisplatin | SD |
| STC1 | SNV | Missense_Mutation | novel | c.603C>A | p.His201Gln | p.H201Q | P52823 | protein_coding | tolerated(0.33) | benign(0.093) | TCGA-AA-3877-01 | Colorectum | colon adenocarcinoma | Female | >=65 | I/II | Unknown | Unknown | SD |
| STC1 | SNV | Missense_Mutation | c.280N>C | p.Glu94Gln | p.E94Q | P52823 | protein_coding | deleterious(0.01) | probably_damaging(0.927) | TCGA-AA-A02O-01 | Colorectum | colon adenocarcinoma | Male | >=65 | I/II | Unknown | Unknown | SD | |
| STC1 | SNV | Missense_Mutation | c.284N>A | p.Ser95Asn | p.S95N | P52823 | protein_coding | deleterious(0.03) | benign(0.153) | TCGA-AA-A02R-01 | Colorectum | colon adenocarcinoma | Female | >=65 | I/II | Unknown | Unknown | PD | |
| STC1 | SNV | Missense_Mutation | rs139152218 | c.445N>A | p.Val149Ile | p.V149I | P52823 | protein_coding | tolerated(0.89) | benign(0.011) | TCGA-CM-6165-01 | Colorectum | colon adenocarcinoma | Male | >=65 | I/II | Unknown | Unknown | SD |
| STC1 | SNV | Missense_Mutation | novel | c.497G>A | p.Ser166Asn | p.S166N | P52823 | protein_coding | deleterious(0.04) | possibly_damaging(0.738) | TCGA-A5-A0G2-01 | Endometrium | uterine corpus endometrioid carcinoma | Female | <65 | III/IV | Unknown | Unknown | SD |
| STC1 | SNV | Missense_Mutation | rs765625301 | c.656C>T | p.Pro219Leu | p.P219L | P52823 | protein_coding | deleterious(0.01) | probably_damaging(0.995) | TCGA-A5-A2K3-01 | Endometrium | uterine corpus endometrioid carcinoma | Female | >=65 | I/II | Chemotherapy | carboplatin | SD |
| Page: 1 2 3 4 |
Top |
Related drugs of malignant transformation related genes |
| Identification of chemicals and drugs interact with genes involved in malignant transfromation |
| (DGIdb 4.0) |
| Entrez ID | Symbol | Category | Interaction Types | Drug Claim Name | Drug Name | PMIDs |
| Page: 1 |

Copyright 2023-Present -The University of Texas Health Science Center at Houston |