
|
|||||
|
 | |
| |
| |
| |
| |
| |
|
Gene: SRP54 |
Gene summary for SRP54 |
| Gene information | Species | Human | Gene symbol | SRP54 | Gene ID | 6729 |
| Gene name | signal recognition particle 54 | |
| Gene Alias | SCN8 | |
| Cytomap | 14q13.2 | |
| Gene Type | protein-coding | GO ID | GO:0002376 | UniProtAcc | P61011 |
Top |
Malignant transformation analysis |
| Identification of the aberrant gene expression in precancerous and cancerous lesions by comparing the gene expression of stem-like cells in diseased tissues with normal stem cells |
| Entrez ID | Symbol | Replicates | Species | Organ | Tissue | Adj P-value | Log2FC | Malignancy |
| 6729 | SRP54 | LZE4T | Human | Esophagus | ESCC | 3.81e-18 | 5.13e-01 | 0.0811 |
| 6729 | SRP54 | LZE5T | Human | Esophagus | ESCC | 3.03e-11 | 9.01e-01 | 0.0514 |
| 6729 | SRP54 | LZE7T | Human | Esophagus | ESCC | 1.62e-06 | 4.90e-01 | 0.0667 |
| 6729 | SRP54 | LZE8T | Human | Esophagus | ESCC | 2.05e-08 | 1.84e-01 | 0.067 |
| 6729 | SRP54 | LZE20T | Human | Esophagus | ESCC | 7.11e-13 | 4.35e-01 | 0.0662 |
| 6729 | SRP54 | LZE22T | Human | Esophagus | ESCC | 9.04e-05 | 6.15e-01 | 0.068 |
| 6729 | SRP54 | LZE24T | Human | Esophagus | ESCC | 2.12e-25 | 4.51e-01 | 0.0596 |
| 6729 | SRP54 | LZE6T | Human | Esophagus | ESCC | 4.61e-07 | 5.25e-01 | 0.0845 |
| 6729 | SRP54 | P1T-E | Human | Esophagus | ESCC | 4.50e-07 | 7.73e-01 | 0.0875 |
| 6729 | SRP54 | P2T-E | Human | Esophagus | ESCC | 2.53e-38 | 5.17e-01 | 0.1177 |
| 6729 | SRP54 | P4T-E | Human | Esophagus | ESCC | 8.13e-35 | 7.87e-01 | 0.1323 |
| 6729 | SRP54 | P5T-E | Human | Esophagus | ESCC | 8.46e-30 | 5.29e-01 | 0.1327 |
| 6729 | SRP54 | P8T-E | Human | Esophagus | ESCC | 5.93e-78 | 1.38e+00 | 0.0889 |
| 6729 | SRP54 | P9T-E | Human | Esophagus | ESCC | 1.31e-13 | 3.12e-01 | 0.1131 |
| 6729 | SRP54 | P10T-E | Human | Esophagus | ESCC | 8.39e-37 | 7.03e-01 | 0.116 |
| 6729 | SRP54 | P11T-E | Human | Esophagus | ESCC | 3.11e-17 | 8.26e-01 | 0.1426 |
| 6729 | SRP54 | P12T-E | Human | Esophagus | ESCC | 1.15e-101 | 2.50e+00 | 0.1122 |
| 6729 | SRP54 | P15T-E | Human | Esophagus | ESCC | 1.20e-55 | 1.01e+00 | 0.1149 |
| 6729 | SRP54 | P16T-E | Human | Esophagus | ESCC | 3.58e-26 | 4.33e-01 | 0.1153 |
| 6729 | SRP54 | P17T-E | Human | Esophagus | ESCC | 1.09e-14 | 5.54e-01 | 0.1278 |
| Page: 1 2 3 4 5 6 7 |
| Tissue | Expression Dynamics | Abbreviation |
| Esophagus | 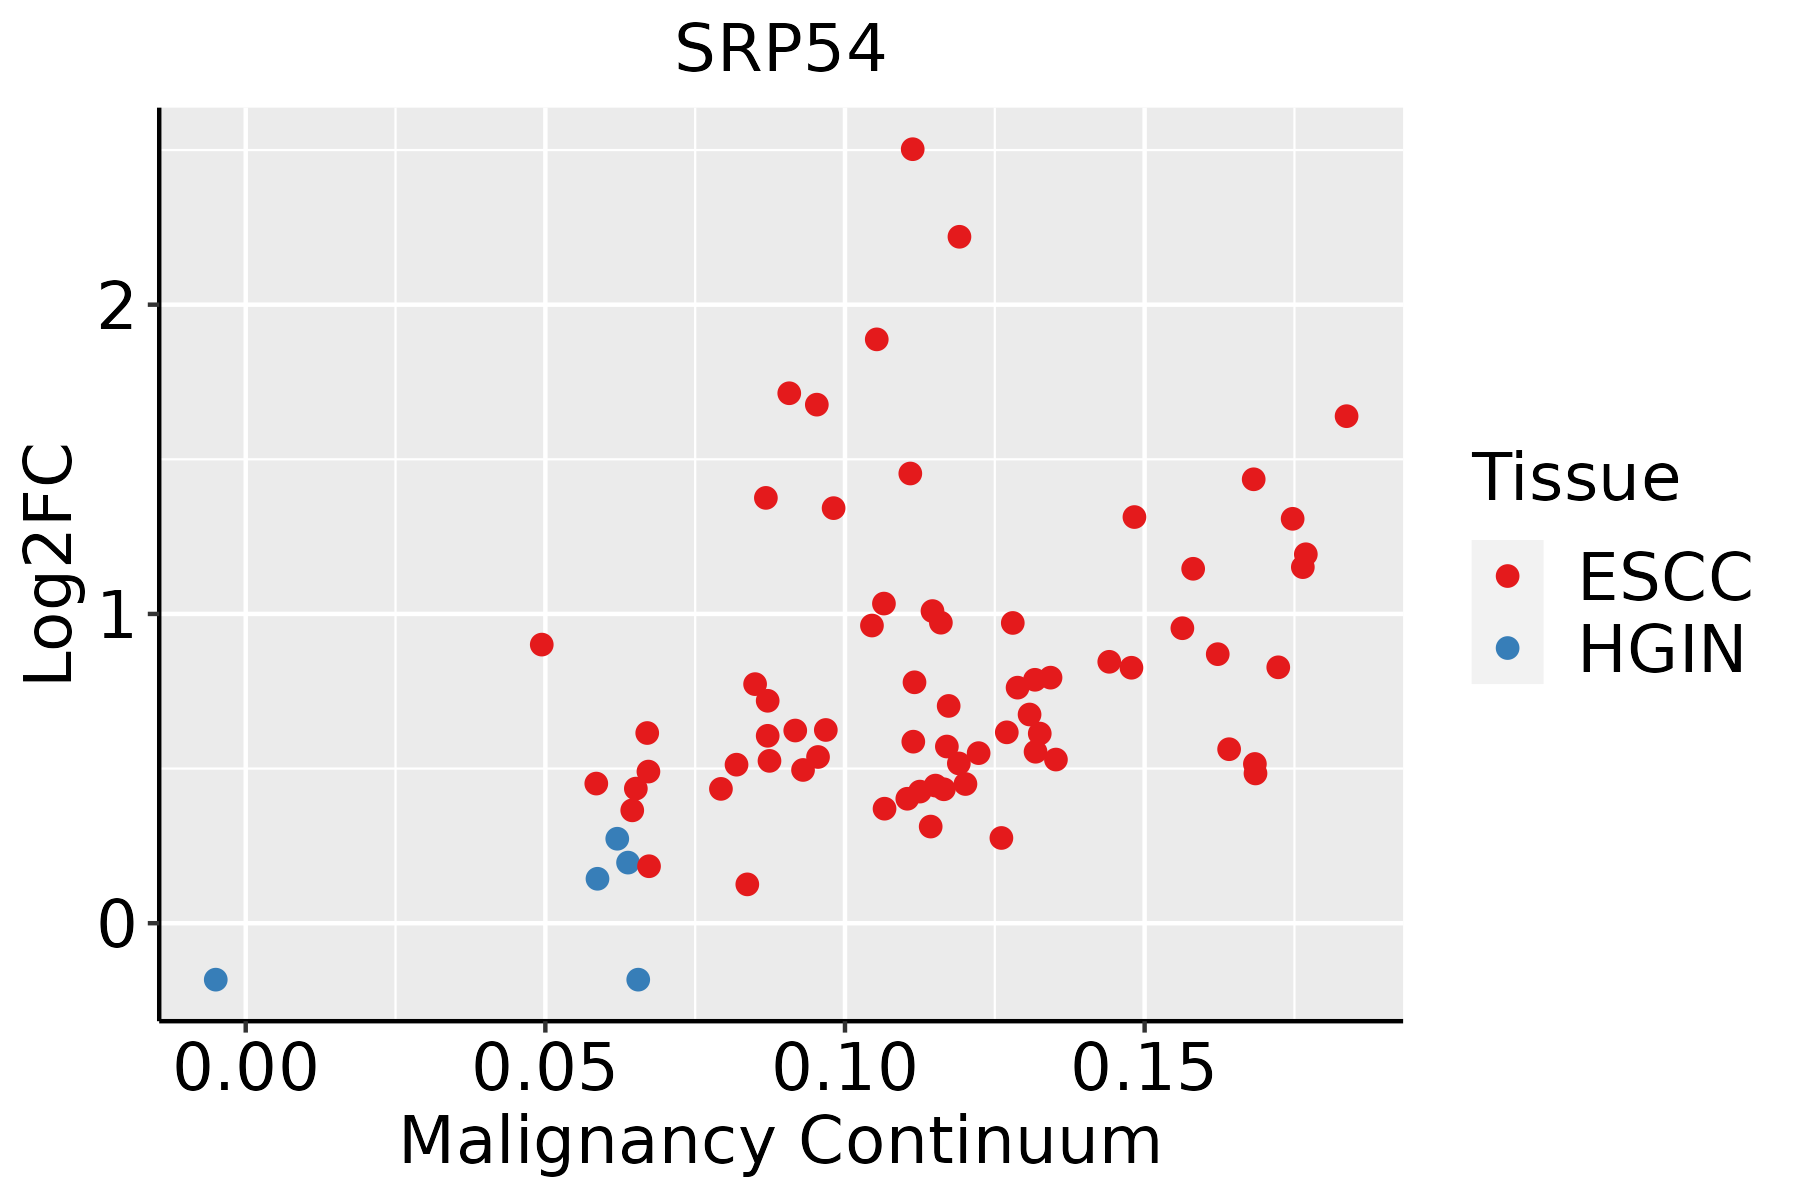 | ESCC: Esophageal squamous cell carcinoma |
| HGIN: High-grade intraepithelial neoplasias | ||
| LGIN: Low-grade intraepithelial neoplasias | ||
| Liver | 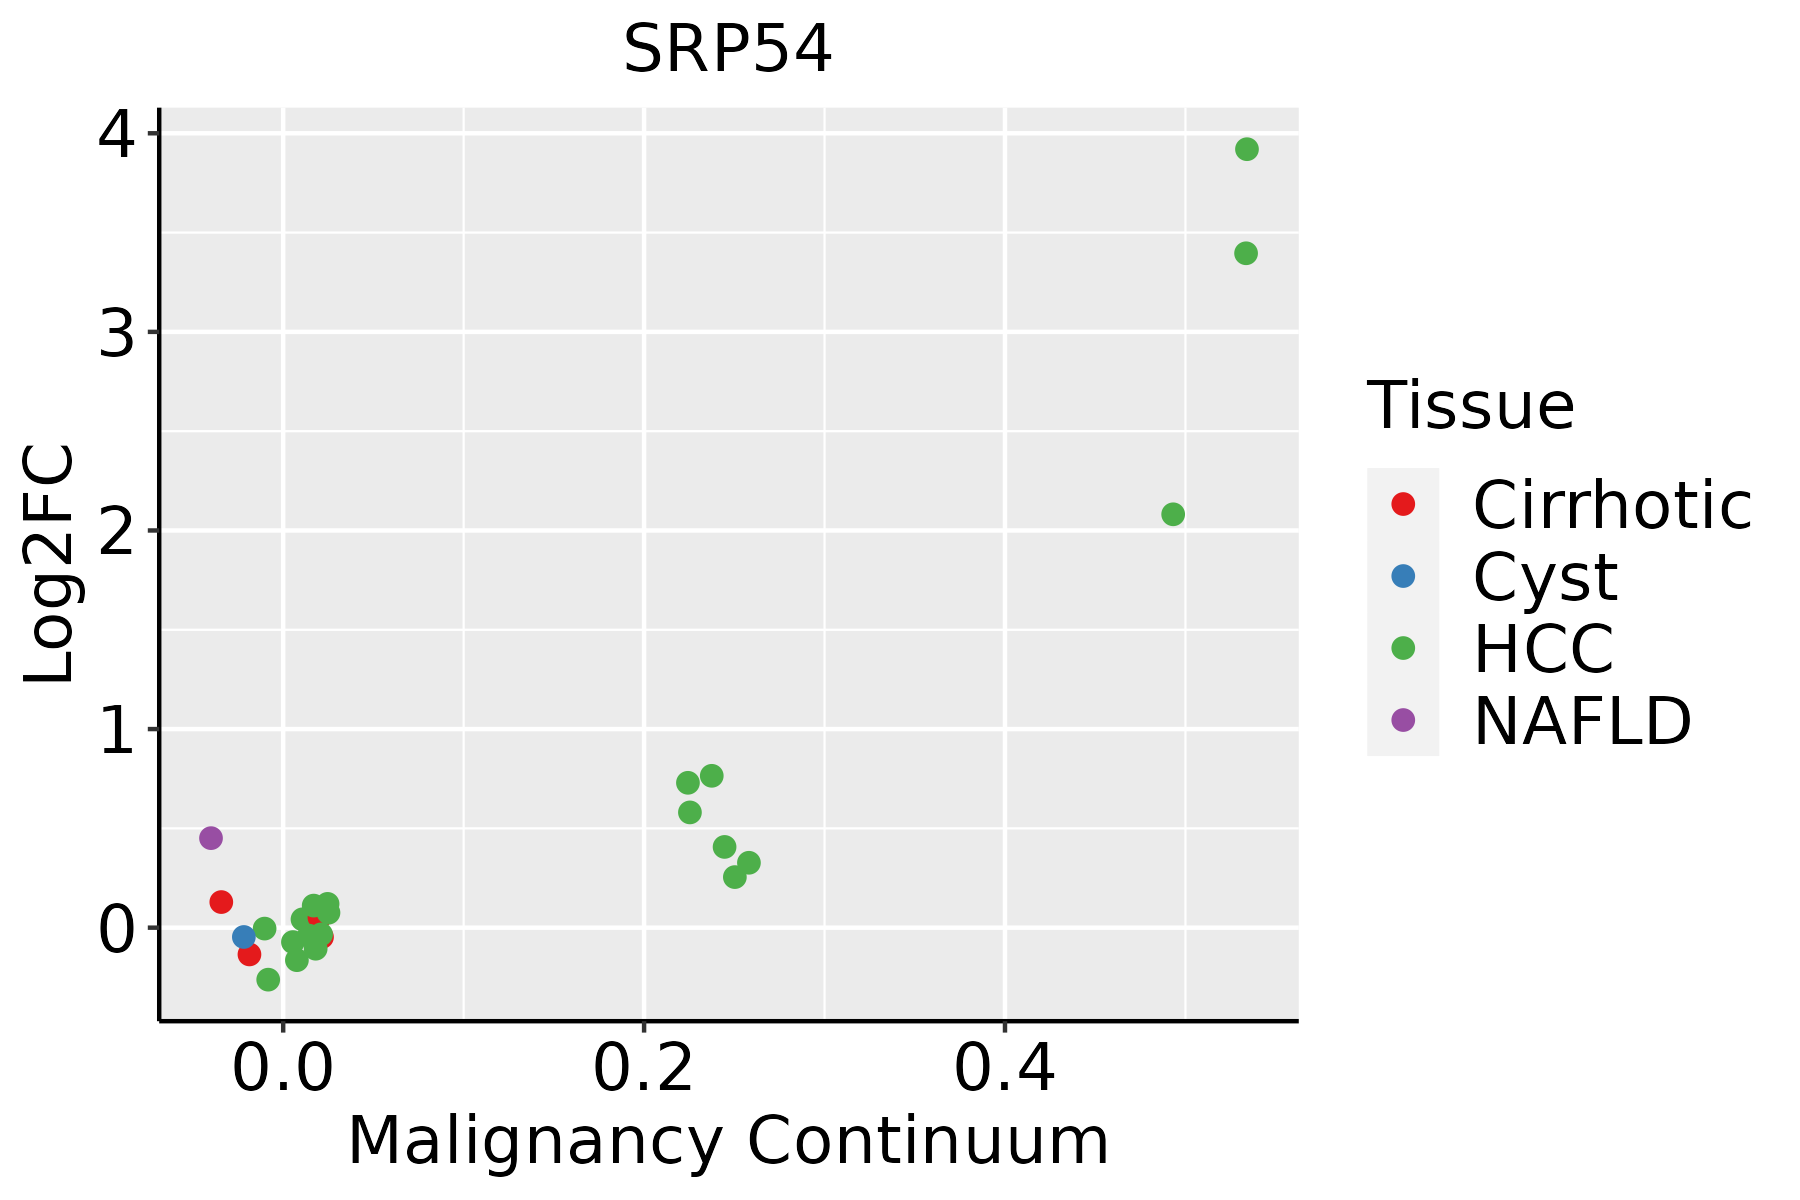 | HCC: Hepatocellular carcinoma |
| NAFLD: Non-alcoholic fatty liver disease | ||
| Lung | 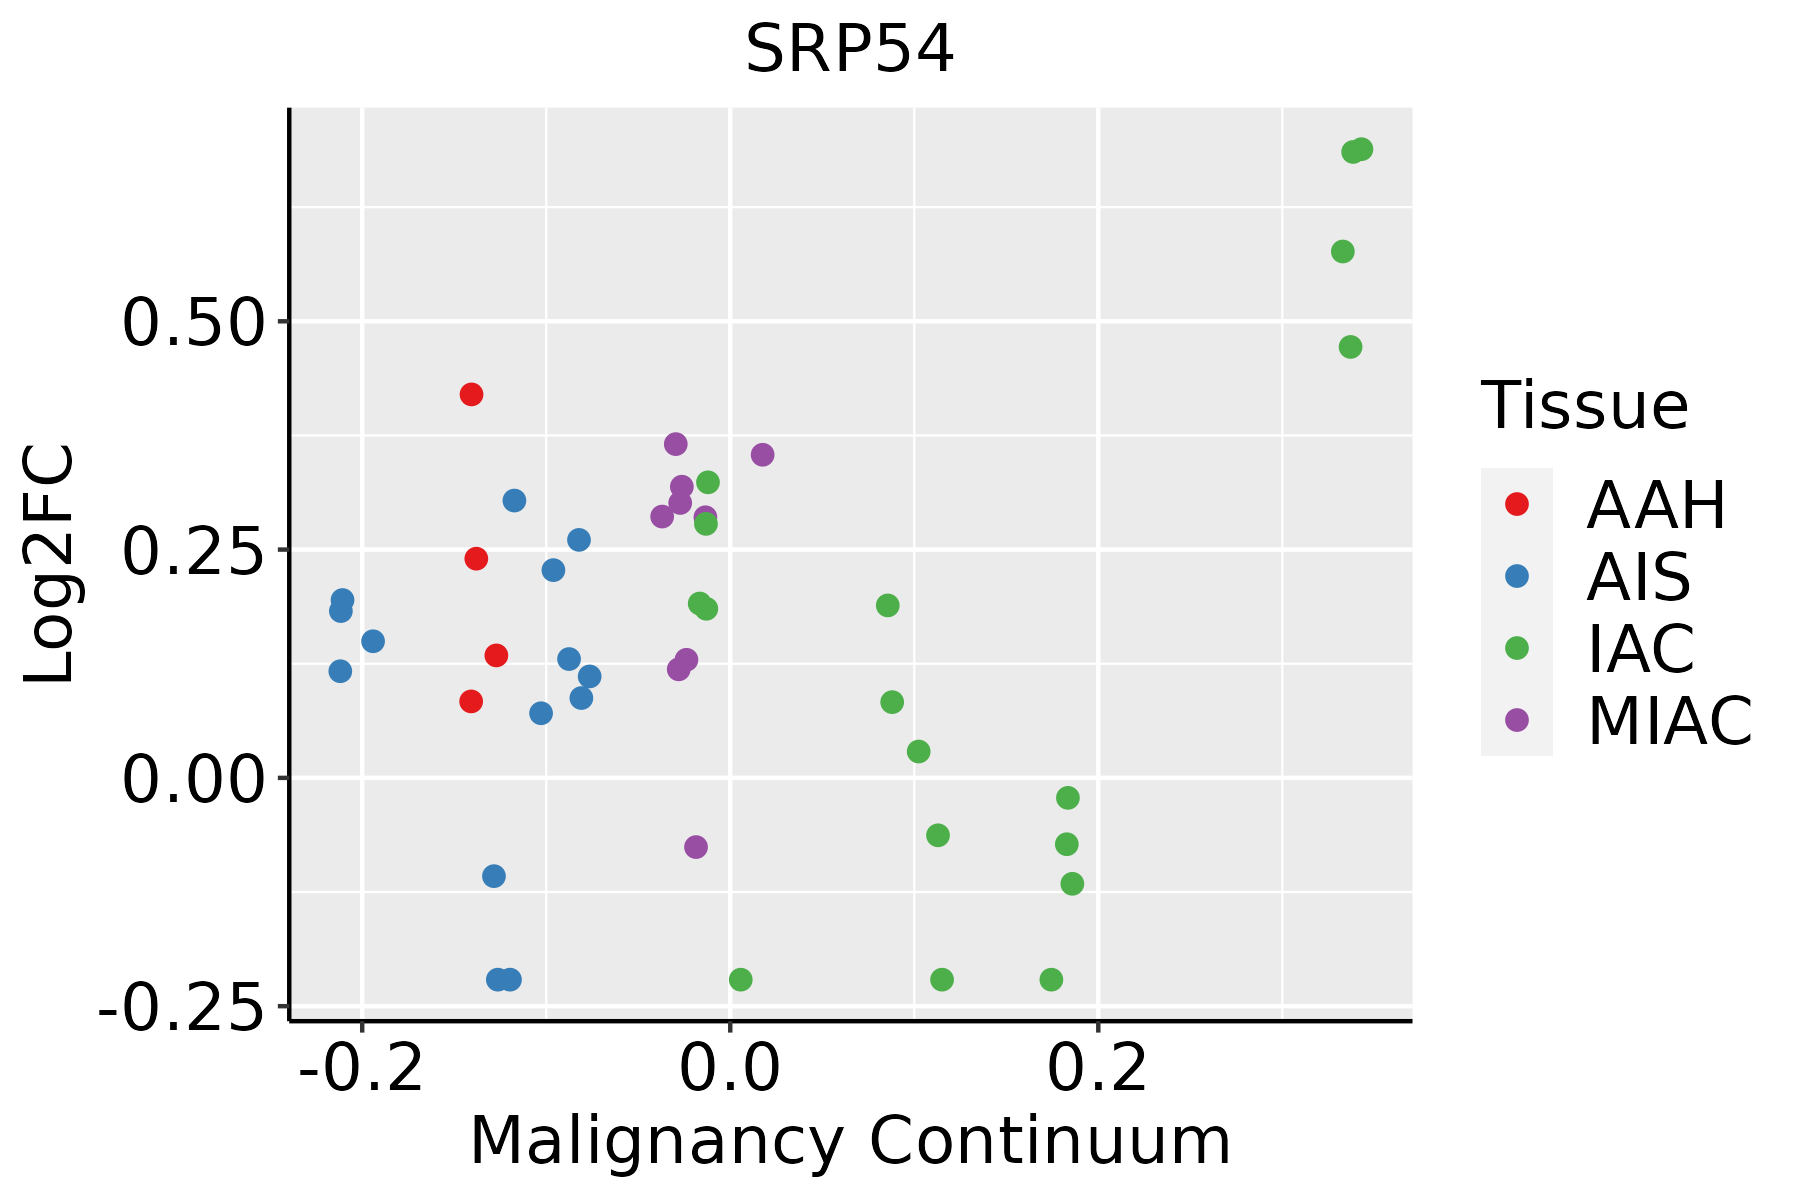 | AAH: Atypical adenomatous hyperplasia |
| AIS: Adenocarcinoma in situ | ||
| IAC: Invasive lung adenocarcinoma | ||
| MIA: Minimally invasive adenocarcinoma | ||
| Oral Cavity | 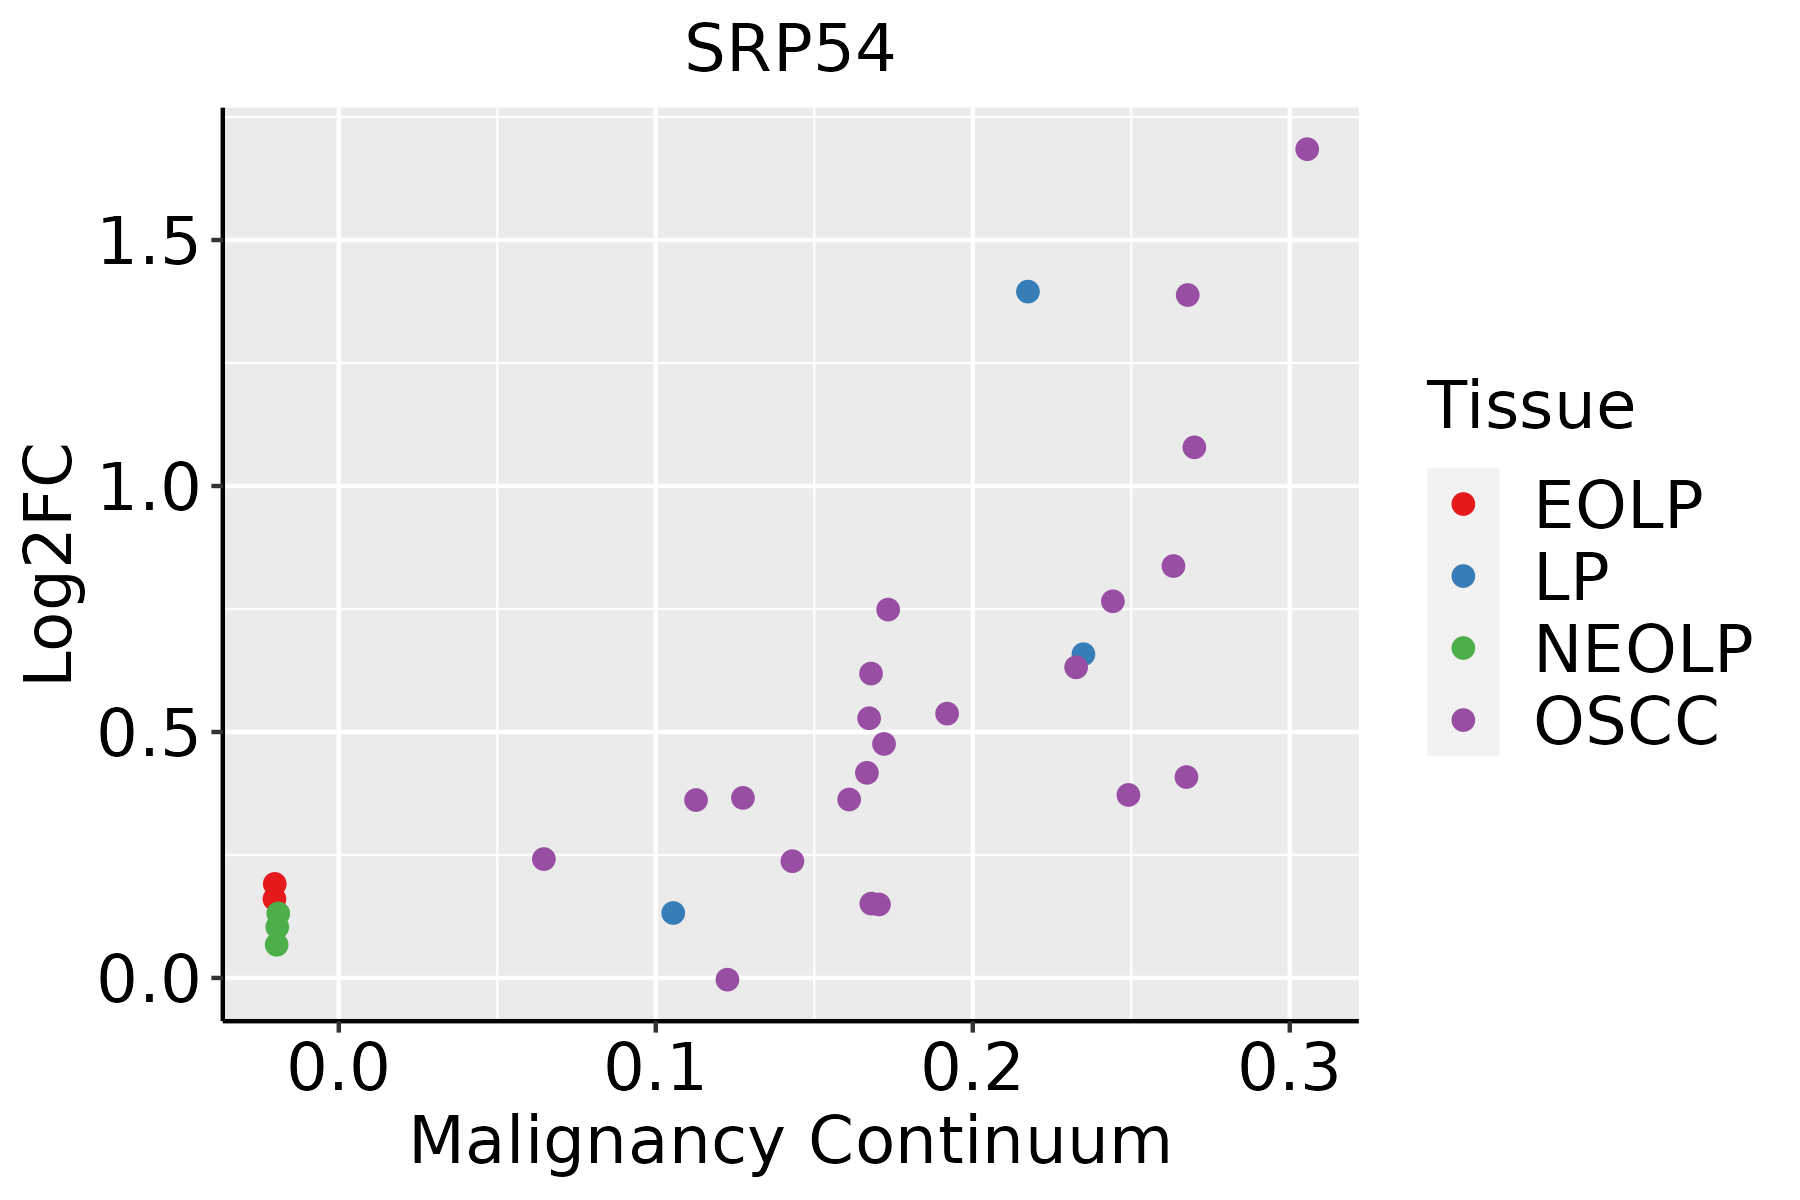 | EOLP: Erosive Oral lichen planus |
| LP: leukoplakia | ||
| NEOLP: Non-erosive oral lichen planus | ||
| OSCC: Oral squamous cell carcinoma | ||
| Skin | 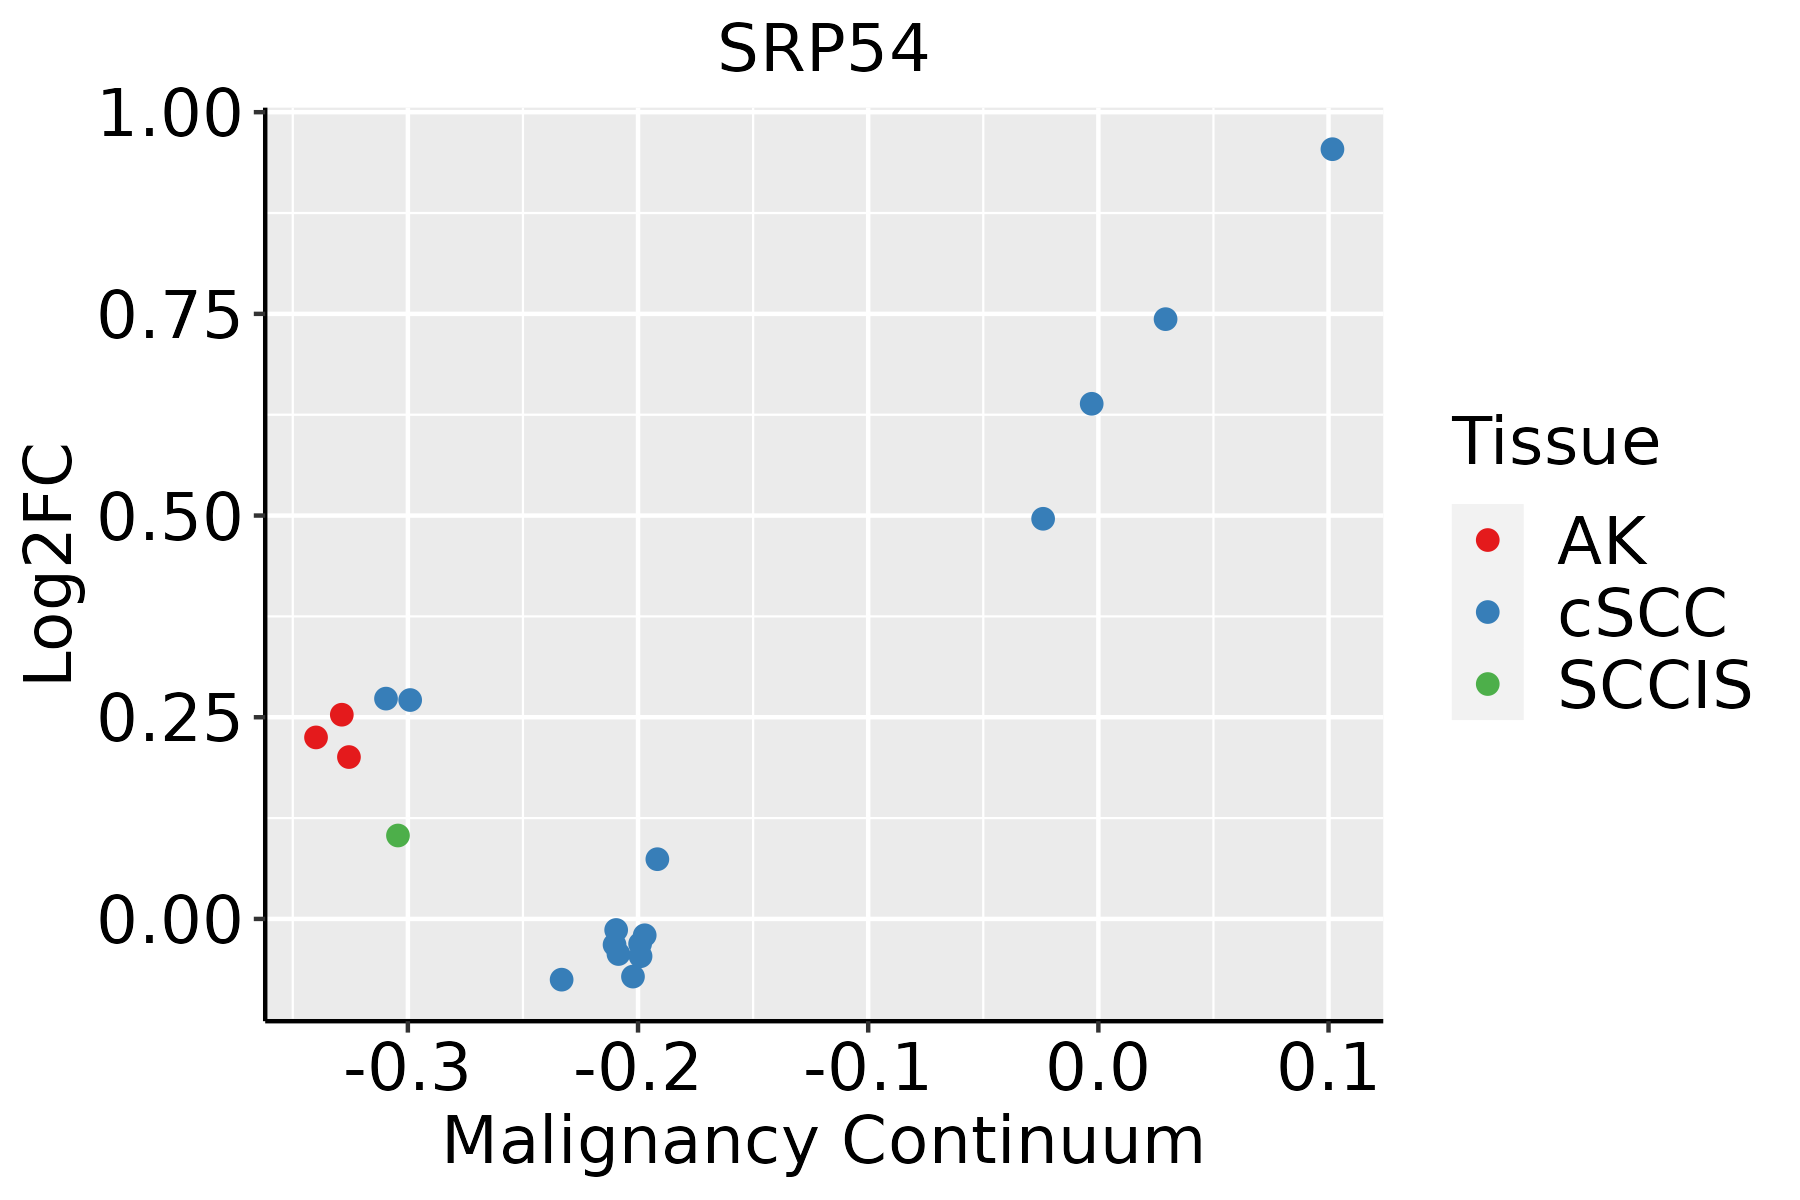 | AK: Actinic keratosis |
| cSCC: Cutaneous squamous cell carcinoma | ||
| SCCIS:squamous cell carcinoma in situ | ||
| Thyroid |  | ATC: Anaplastic thyroid cancer |
| HT: Hashimoto's thyroiditis | ||
| PTC: Papillary thyroid cancer |
| ∗log2FC in expression of this searched gene in stem-like cells from each diseased tissue sample relative to stem-like cells in normal samples in each tissue plotted against the malignancy continuum. Samples are colored based on if they are from different disease stage. |
Top |
Malignant transformation related pathway analysis |
| Find out the enriched GO biological processes and KEGG pathways involved in transition from healthy to precancer to cancer |
| Tissue | Disease Stage | Enriched GO biological Processes |
| Colorectum | AD |  |
| Colorectum | SER |  |
| Colorectum | MSS |  |
| Colorectum | MSI-H |  |
| Colorectum | FAP |  |
| ∗Top 15 enriched GO BP terms are showed in the bar plot of each disease state in each tissue. Each row represents a significant GO biological process which is colored according to the -log10(p.adjust). |
| Page: 1 2 3 4 5 6 7 8 9 |
| GO ID | Tissue | Disease Stage | Description | Gene Ratio | Bg Ratio | pvalue | p.adjust | Count |
| GO:009015023 | Skin | AK | establishment of protein localization to membrane | 45/1910 | 260/18723 | 2.84e-04 | 2.99e-03 | 45 |
| GO:007162114 | Skin | AK | granulocyte chemotaxis | 26/1910 | 125/18723 | 3.17e-04 | 3.24e-03 | 26 |
| GO:009752915 | Skin | AK | myeloid leukocyte migration | 39/1910 | 220/18723 | 4.30e-04 | 4.05e-03 | 39 |
| GO:007097219 | Skin | AK | protein localization to endoplasmic reticulum | 17/1910 | 74/18723 | 1.04e-03 | 8.19e-03 | 17 |
| GO:003059313 | Skin | AK | neutrophil chemotaxis | 21/1910 | 103/18723 | 1.50e-03 | 1.08e-02 | 21 |
| GO:009753010 | Skin | AK | granulocyte migration | 27/1910 | 148/18723 | 2.01e-03 | 1.35e-02 | 27 |
| GO:007259910 | Skin | AK | establishment of protein localization to endoplasmic reticulum | 11/1910 | 46/18723 | 5.57e-03 | 3.06e-02 | 11 |
| GO:19902668 | Skin | AK | neutrophil migration | 22/1910 | 122/18723 | 5.74e-03 | 3.13e-02 | 22 |
| GO:007259427 | Skin | cSCC | establishment of protein localization to organelle | 213/4864 | 422/18723 | 1.40e-27 | 5.15e-25 | 213 |
| GO:000660527 | Skin | cSCC | protein targeting | 153/4864 | 314/18723 | 2.62e-18 | 3.36e-16 | 153 |
| GO:009015024 | Skin | cSCC | establishment of protein localization to membrane | 123/4864 | 260/18723 | 8.34e-14 | 5.18e-12 | 123 |
| GO:004873227 | Skin | cSCC | gland development | 167/4864 | 436/18723 | 7.64e-09 | 2.44e-07 | 167 |
| GO:003009929 | Skin | cSCC | myeloid cell differentiation | 146/4864 | 381/18723 | 6.38e-08 | 1.61e-06 | 146 |
| GO:0070972110 | Skin | cSCC | protein localization to endoplasmic reticulum | 41/4864 | 74/18723 | 7.13e-08 | 1.78e-06 | 41 |
| GO:007180610 | Skin | cSCC | protein transmembrane transport | 33/4864 | 59/18723 | 9.93e-07 | 1.78e-05 | 33 |
| GO:00650027 | Skin | cSCC | intracellular protein transmembrane transport | 28/4864 | 51/18723 | 1.05e-05 | 1.37e-04 | 28 |
| GO:007259916 | Skin | cSCC | establishment of protein localization to endoplasmic reticulum | 26/4864 | 46/18723 | 1.07e-05 | 1.39e-04 | 26 |
| GO:00450479 | Skin | cSCC | protein targeting to ER | 24/4864 | 42/18723 | 1.82e-05 | 2.19e-04 | 24 |
| GO:00066125 | Skin | cSCC | protein targeting to membrane | 54/4864 | 131/18723 | 9.79e-05 | 9.11e-04 | 54 |
| GO:000257324 | Skin | cSCC | myeloid leukocyte differentiation | 76/4864 | 208/18723 | 4.75e-04 | 3.60e-03 | 76 |
| Page: 1 2 3 4 5 6 7 8 |
| Pathway ID | Tissue | Disease Stage | Description | Gene Ratio | Bg Ratio | pvalue | p.adjust | qvalue | Count |
| hsa0306026 | Esophagus | ESCC | Protein export | 22/4205 | 23/8465 | 2.43e-06 | 1.43e-05 | 7.32e-06 | 22 |
| hsa0306036 | Esophagus | ESCC | Protein export | 22/4205 | 23/8465 | 2.43e-06 | 1.43e-05 | 7.32e-06 | 22 |
| hsa030608 | Liver | Cirrhotic | Protein export | 20/2530 | 23/8465 | 2.00e-08 | 3.51e-07 | 2.17e-07 | 20 |
| hsa0306011 | Liver | Cirrhotic | Protein export | 20/2530 | 23/8465 | 2.00e-08 | 3.51e-07 | 2.17e-07 | 20 |
| hsa0306021 | Liver | HCC | Protein export | 21/4020 | 23/8465 | 1.20e-05 | 8.53e-05 | 4.74e-05 | 21 |
| hsa0306031 | Liver | HCC | Protein export | 21/4020 | 23/8465 | 1.20e-05 | 8.53e-05 | 4.74e-05 | 21 |
| hsa0306018 | Oral cavity | OSCC | Protein export | 21/3704 | 23/8465 | 2.42e-06 | 1.27e-05 | 6.45e-06 | 21 |
| hsa0306019 | Oral cavity | OSCC | Protein export | 21/3704 | 23/8465 | 2.42e-06 | 1.27e-05 | 6.45e-06 | 21 |
| hsa0306025 | Oral cavity | LP | Protein export | 21/2418 | 23/8465 | 4.72e-10 | 8.28e-09 | 5.34e-09 | 21 |
| hsa0306035 | Oral cavity | LP | Protein export | 21/2418 | 23/8465 | 4.72e-10 | 8.28e-09 | 5.34e-09 | 21 |
| Page: 1 |
Top |
Cell-cell communication analysis |
| Identification of potential cell-cell interactions between two cell types and their ligand-receptor pairs for different disease states |
| Ligand | Receptor | LRpair | Pathway | Tissue | Disease Stage |
| Page: 1 |
Top |
Single-cell gene regulatory network inference analysis |
| Find out the significant the regulons (TFs) and the target genes of each regulon across cell types for different disease states |
| TF | Cell Type | Tissue | Disease Stage | Target Gene | RSS | Regulon Activity |
| ∗The dot plots of a searched regulon are shown for all cell subpopulations in each disease state of each tissue based on the regulon specific score inferred using pySCENIC and by calculating the average expression. |
| Page: 1 |
Top |
Somatic mutation of malignant transformation related genes |
| Annotation of somatic variants for genes involved in malignant transformation |
| Hugo Symbol | Variant Class | Variant Classification | dbSNP RS | HGVSc | HGVSp | HGVSp Short | SWISSPROT | BIOTYPE | SIFT | PolyPhen | Tumor Sample Barcode | Tissue | Histology | Sex | Age | Stage | Therapy Types | Drugs | Outcome |
| SRP54 | SNV | Missense_Mutation | c.1139N>C | p.Asp380Ala | p.D380A | P61011 | protein_coding | deleterious(0) | possibly_damaging(0.905) | TCGA-D8-A1JK-01 | Breast | breast invasive carcinoma | Female | >=65 | I/II | Unknown | Unknown | SD | |
| SRP54 | SNV | Missense_Mutation | c.1340C>T | p.Ser447Phe | p.S447F | P61011 | protein_coding | deleterious(0.02) | possibly_damaging(0.63) | TCGA-GM-A2D9-01 | Breast | breast invasive carcinoma | Female | >=65 | I/II | Hormone Therapy | arimidex | SD | |
| SRP54 | insertion | Frame_Shift_Ins | novel | c.1223_1224insGAAGAAATGCTTCAAGTTGCTAATGCTAT | p.Gly409LysfsTer10 | p.G409Kfs*10 | P61011 | protein_coding | TCGA-A8-A07U-01 | Breast | breast invasive carcinoma | Female | >=65 | III/IV | Chemotherapy | 5-fluorouracil | SD | ||
| SRP54 | insertion | Nonsense_Mutation | novel | c.1024_1025insCAAGGCACATAAACTACACCTACTAGGATGAGTAAAAT | p.Met342ThrfsTer9 | p.M342Tfs*9 | P61011 | protein_coding | TCGA-AR-A0U0-01 | Breast | breast invasive carcinoma | Female | >=65 | I/II | Unknown | Unknown | SD | ||
| SRP54 | SNV | Missense_Mutation | c.755G>T | p.Gly252Val | p.G252V | P61011 | protein_coding | deleterious(0) | probably_damaging(0.915) | TCGA-DS-A1OD-01 | Cervix | cervical & endocervical cancer | Female | <65 | I/II | Chemotherapy | cisplatin | SD | |
| SRP54 | SNV | Missense_Mutation | novel | c.1067N>T | p.Gly356Val | p.G356V | P61011 | protein_coding | deleterious(0.05) | possibly_damaging(0.822) | TCGA-VS-A9UM-01 | Cervix | cervical & endocervical cancer | Female | <65 | I/II | Chemotherapy | cisplatin | CR |
| SRP54 | SNV | Missense_Mutation | novel | c.508N>G | p.Ile170Val | p.I170V | P61011 | protein_coding | tolerated(0.4) | benign(0) | TCGA-VS-A9V5-01 | Cervix | cervical & endocervical cancer | Female | <65 | I/II | Chemotherapy | carboplatin | PD |
| SRP54 | SNV | Missense_Mutation | c.851C>A | p.Pro284His | p.P284H | P61011 | protein_coding | tolerated(0.09) | possibly_damaging(0.663) | TCGA-A6-5661-01 | Colorectum | colon adenocarcinoma | Female | >=65 | I/II | Unknown | Unknown | SD | |
| SRP54 | SNV | Missense_Mutation | novel | c.702N>T | p.Lys234Asn | p.K234N | P61011 | protein_coding | deleterious(0.04) | possibly_damaging(0.511) | TCGA-AA-A02R-01 | Colorectum | colon adenocarcinoma | Female | >=65 | I/II | Unknown | Unknown | PD |
| SRP54 | SNV | Missense_Mutation | c.184N>T | p.Leu62Phe | p.L62F | P61011 | protein_coding | tolerated(0.58) | benign(0.003) | TCGA-CK-4951-01 | Colorectum | colon adenocarcinoma | Female | >=65 | I/II | Unknown | Unknown | PD |
| Page: 1 2 3 4 5 |
Top |
Related drugs of malignant transformation related genes |
| Identification of chemicals and drugs interact with genes involved in malignant transfromation |
| (DGIdb 4.0) |
| Entrez ID | Symbol | Category | Interaction Types | Drug Claim Name | Drug Name | PMIDs |
| Page: 1 |

Copyright 2023-Present -The University of Texas Health Science Center at Houston |