
|
|||||
|
 | |
| |
| |
| |
| |
| |
|
Gene: SORD |
Gene summary for SORD |
| Gene information | Species | Human | Gene symbol | SORD | Gene ID | 6652 |
| Gene name | sorbitol dehydrogenase | |
| Gene Alias | HEL-S-95n | |
| Cytomap | 15q21.1 | |
| Gene Type | protein-coding | GO ID | GO:0000003 | UniProtAcc | Q00796 |
Top |
Malignant transformation analysis |
| Identification of the aberrant gene expression in precancerous and cancerous lesions by comparing the gene expression of stem-like cells in diseased tissues with normal stem cells |
| Entrez ID | Symbol | Replicates | Species | Organ | Tissue | Adj P-value | Log2FC | Malignancy |
| 6652 | SORD | LZE2T | Human | Esophagus | ESCC | 3.13e-05 | 5.44e-01 | 0.082 |
| 6652 | SORD | LZE4T | Human | Esophagus | ESCC | 3.88e-12 | 3.62e-01 | 0.0811 |
| 6652 | SORD | LZE5T | Human | Esophagus | ESCC | 7.32e-06 | 7.99e-01 | 0.0514 |
| 6652 | SORD | LZE8T | Human | Esophagus | ESCC | 5.04e-18 | 5.07e-01 | 0.067 |
| 6652 | SORD | LZE20T | Human | Esophagus | ESCC | 1.89e-10 | 5.84e-01 | 0.0662 |
| 6652 | SORD | LZE22D1 | Human | Esophagus | HGIN | 1.29e-02 | 2.38e-01 | 0.0595 |
| 6652 | SORD | LZE22T | Human | Esophagus | ESCC | 7.08e-03 | 3.97e-01 | 0.068 |
| 6652 | SORD | LZE24T | Human | Esophagus | ESCC | 4.15e-18 | 6.46e-01 | 0.0596 |
| 6652 | SORD | LZE21T | Human | Esophagus | ESCC | 2.17e-08 | 4.91e-01 | 0.0655 |
| 6652 | SORD | LZE6T | Human | Esophagus | ESCC | 4.80e-02 | 1.86e-01 | 0.0845 |
| 6652 | SORD | P1T-E | Human | Esophagus | ESCC | 3.10e-14 | 5.38e-01 | 0.0875 |
| 6652 | SORD | P2T-E | Human | Esophagus | ESCC | 7.87e-23 | 4.07e-01 | 0.1177 |
| 6652 | SORD | P4T-E | Human | Esophagus | ESCC | 6.58e-37 | 9.25e-01 | 0.1323 |
| 6652 | SORD | P5T-E | Human | Esophagus | ESCC | 1.34e-16 | 4.52e-01 | 0.1327 |
| 6652 | SORD | P8T-E | Human | Esophagus | ESCC | 5.68e-60 | 1.47e+00 | 0.0889 |
| 6652 | SORD | P9T-E | Human | Esophagus | ESCC | 7.90e-29 | 8.07e-01 | 0.1131 |
| 6652 | SORD | P10T-E | Human | Esophagus | ESCC | 5.94e-28 | 4.92e-01 | 0.116 |
| 6652 | SORD | P11T-E | Human | Esophagus | ESCC | 2.50e-13 | 4.48e-01 | 0.1426 |
| 6652 | SORD | P12T-E | Human | Esophagus | ESCC | 3.41e-32 | 7.17e-01 | 0.1122 |
| 6652 | SORD | P15T-E | Human | Esophagus | ESCC | 4.72e-34 | 7.34e-01 | 0.1149 |
| Page: 1 2 3 4 5 6 7 |
| Tissue | Expression Dynamics | Abbreviation |
| Esophagus | 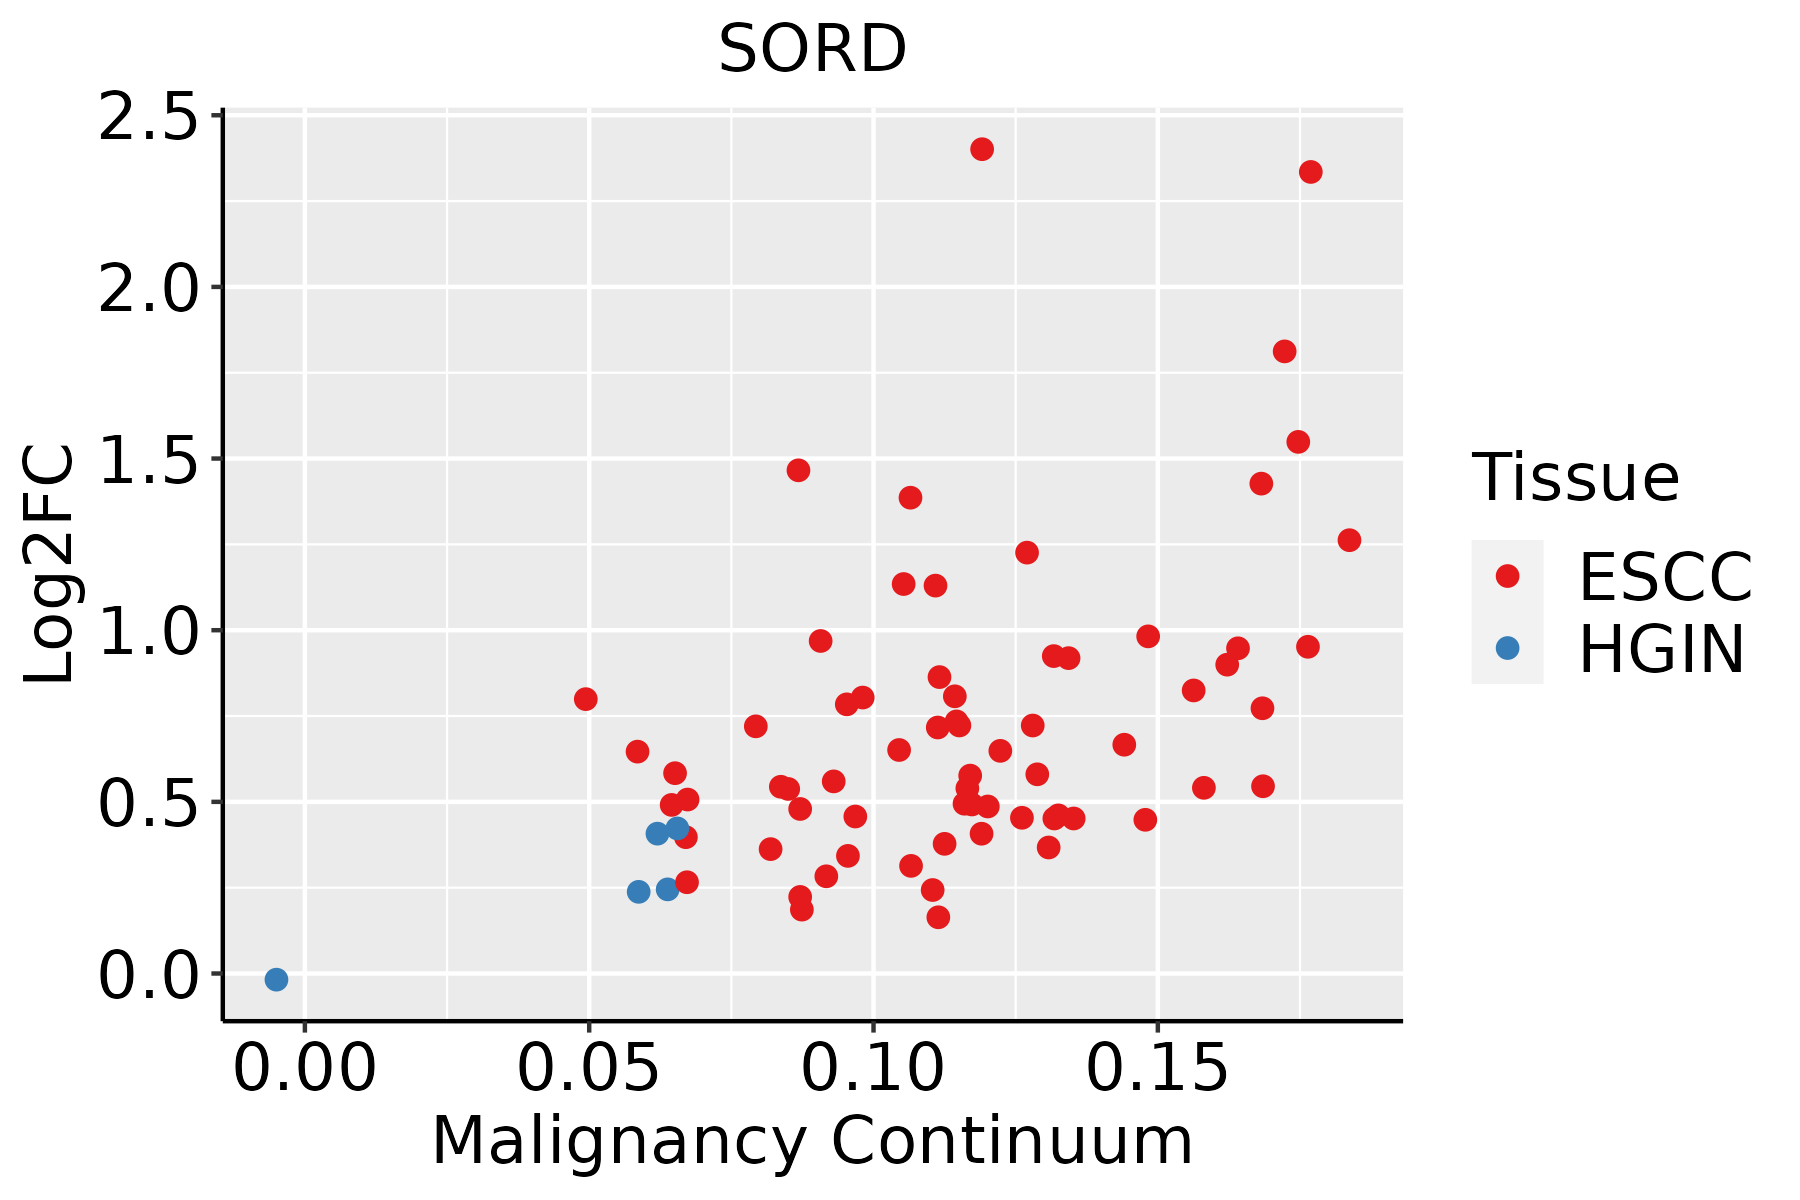 | ESCC: Esophageal squamous cell carcinoma |
| HGIN: High-grade intraepithelial neoplasias | ||
| LGIN: Low-grade intraepithelial neoplasias | ||
| Liver |  | HCC: Hepatocellular carcinoma |
| NAFLD: Non-alcoholic fatty liver disease | ||
| Oral Cavity | 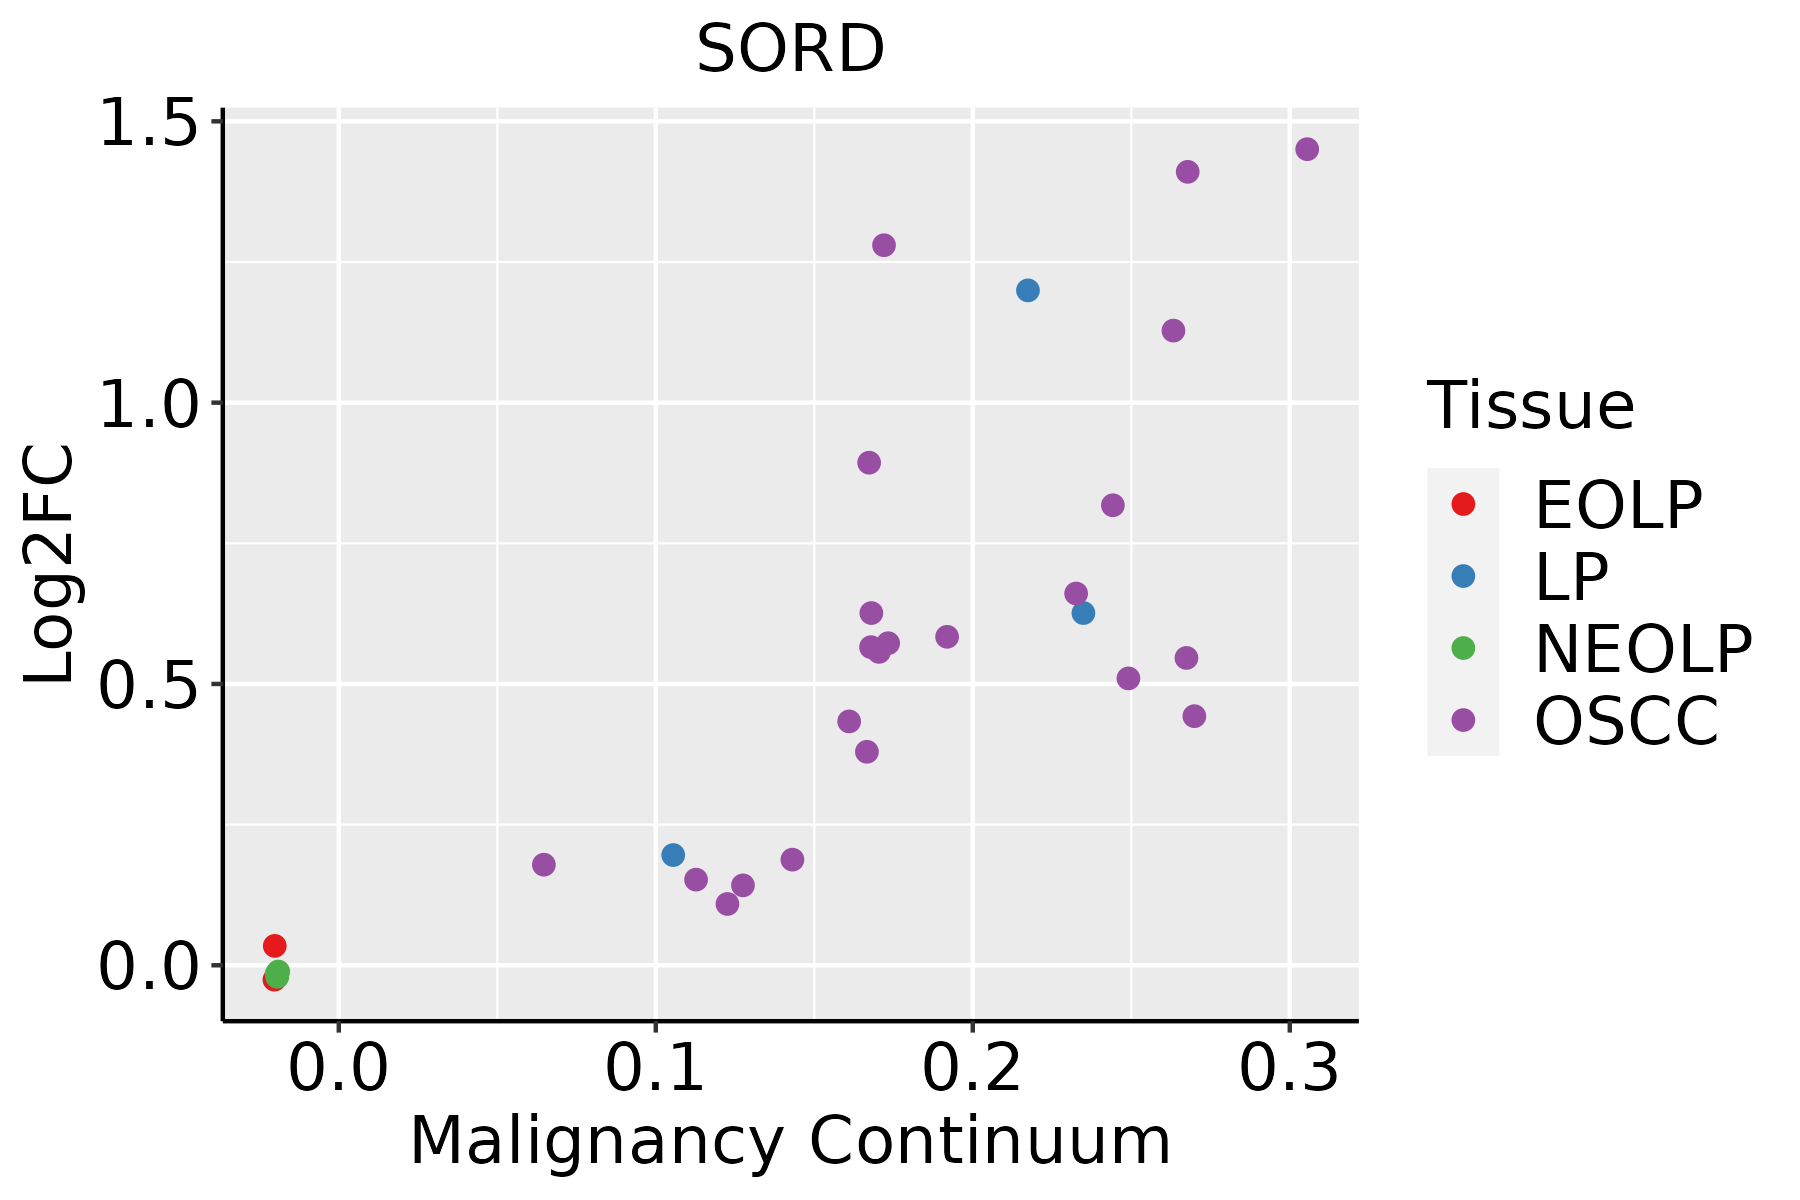 | EOLP: Erosive Oral lichen planus |
| LP: leukoplakia | ||
| NEOLP: Non-erosive oral lichen planus | ||
| OSCC: Oral squamous cell carcinoma | ||
| Prostate |  | BPH: Benign Prostatic Hyperplasia |
| Skin | 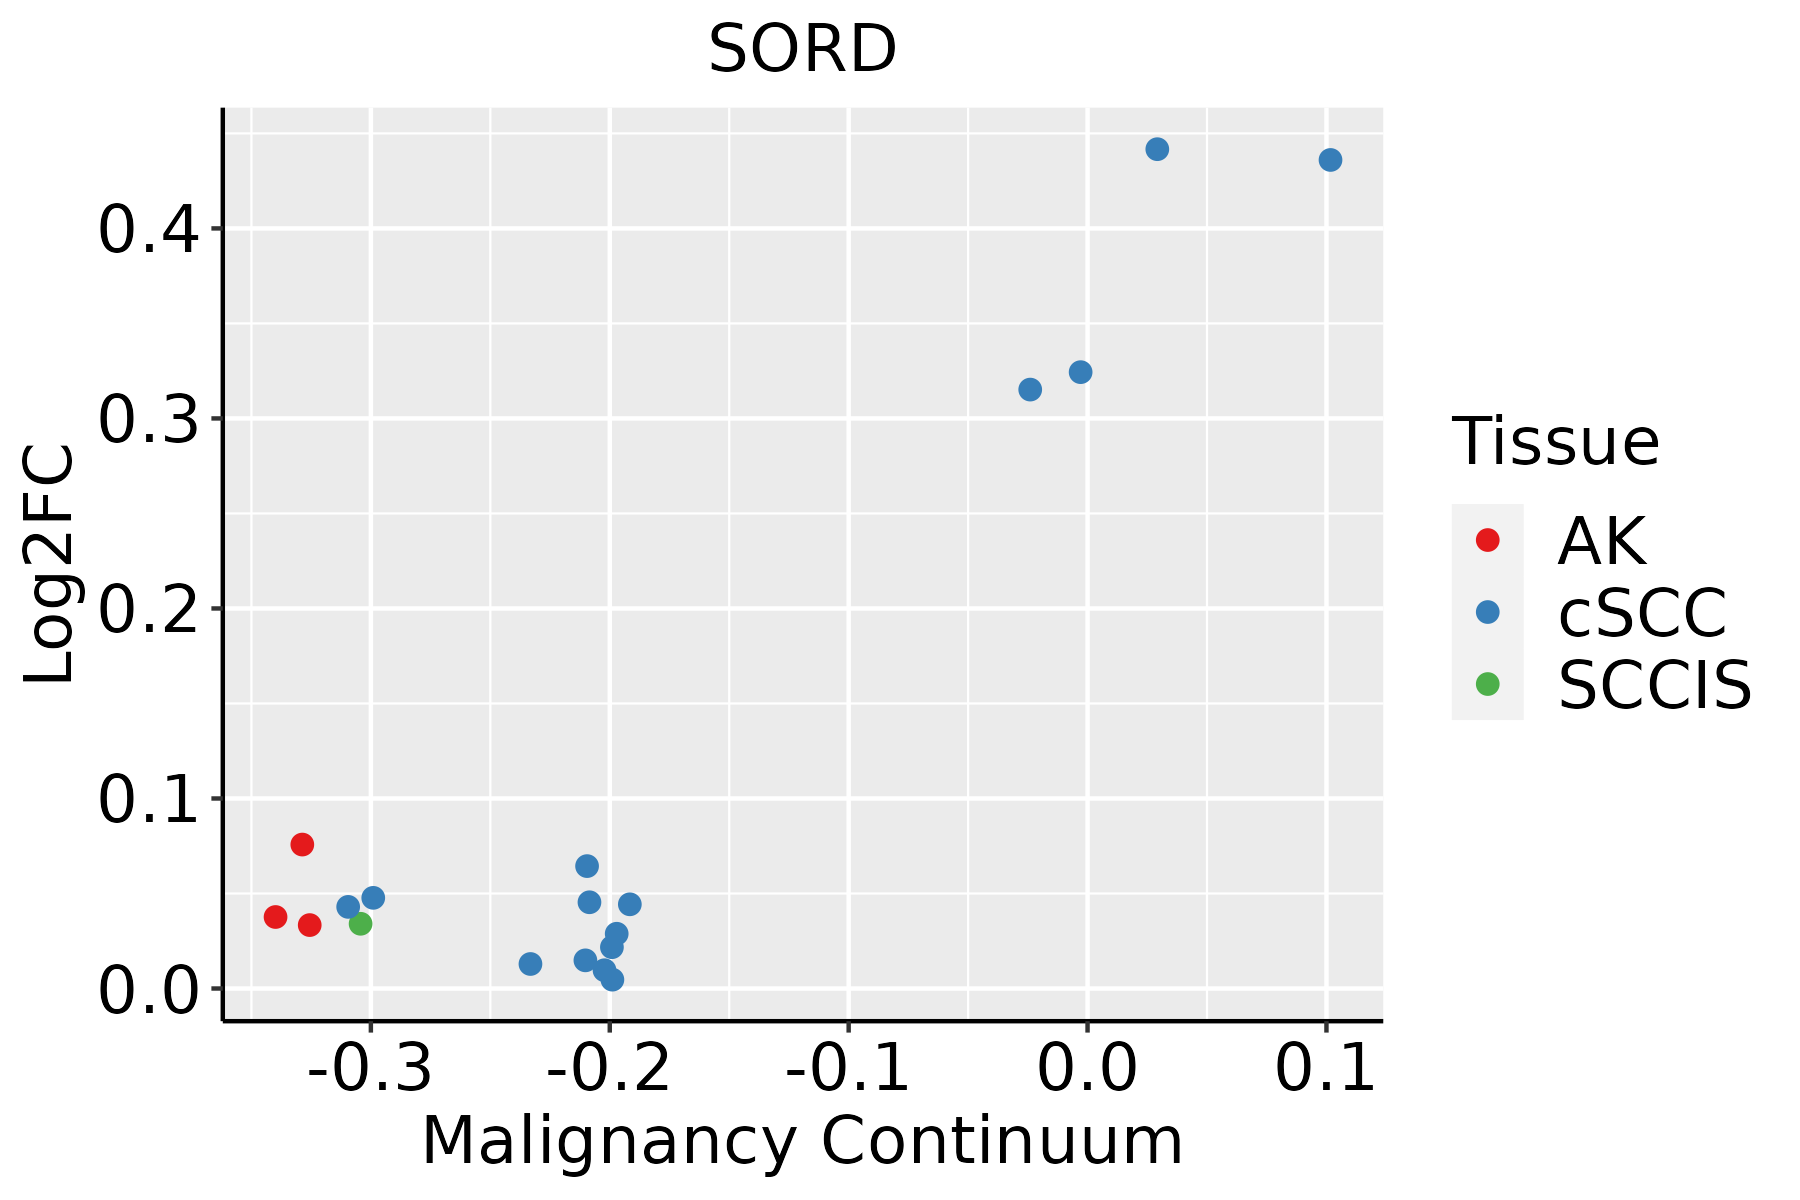 | AK: Actinic keratosis |
| cSCC: Cutaneous squamous cell carcinoma | ||
| SCCIS:squamous cell carcinoma in situ | ||
| Thyroid | 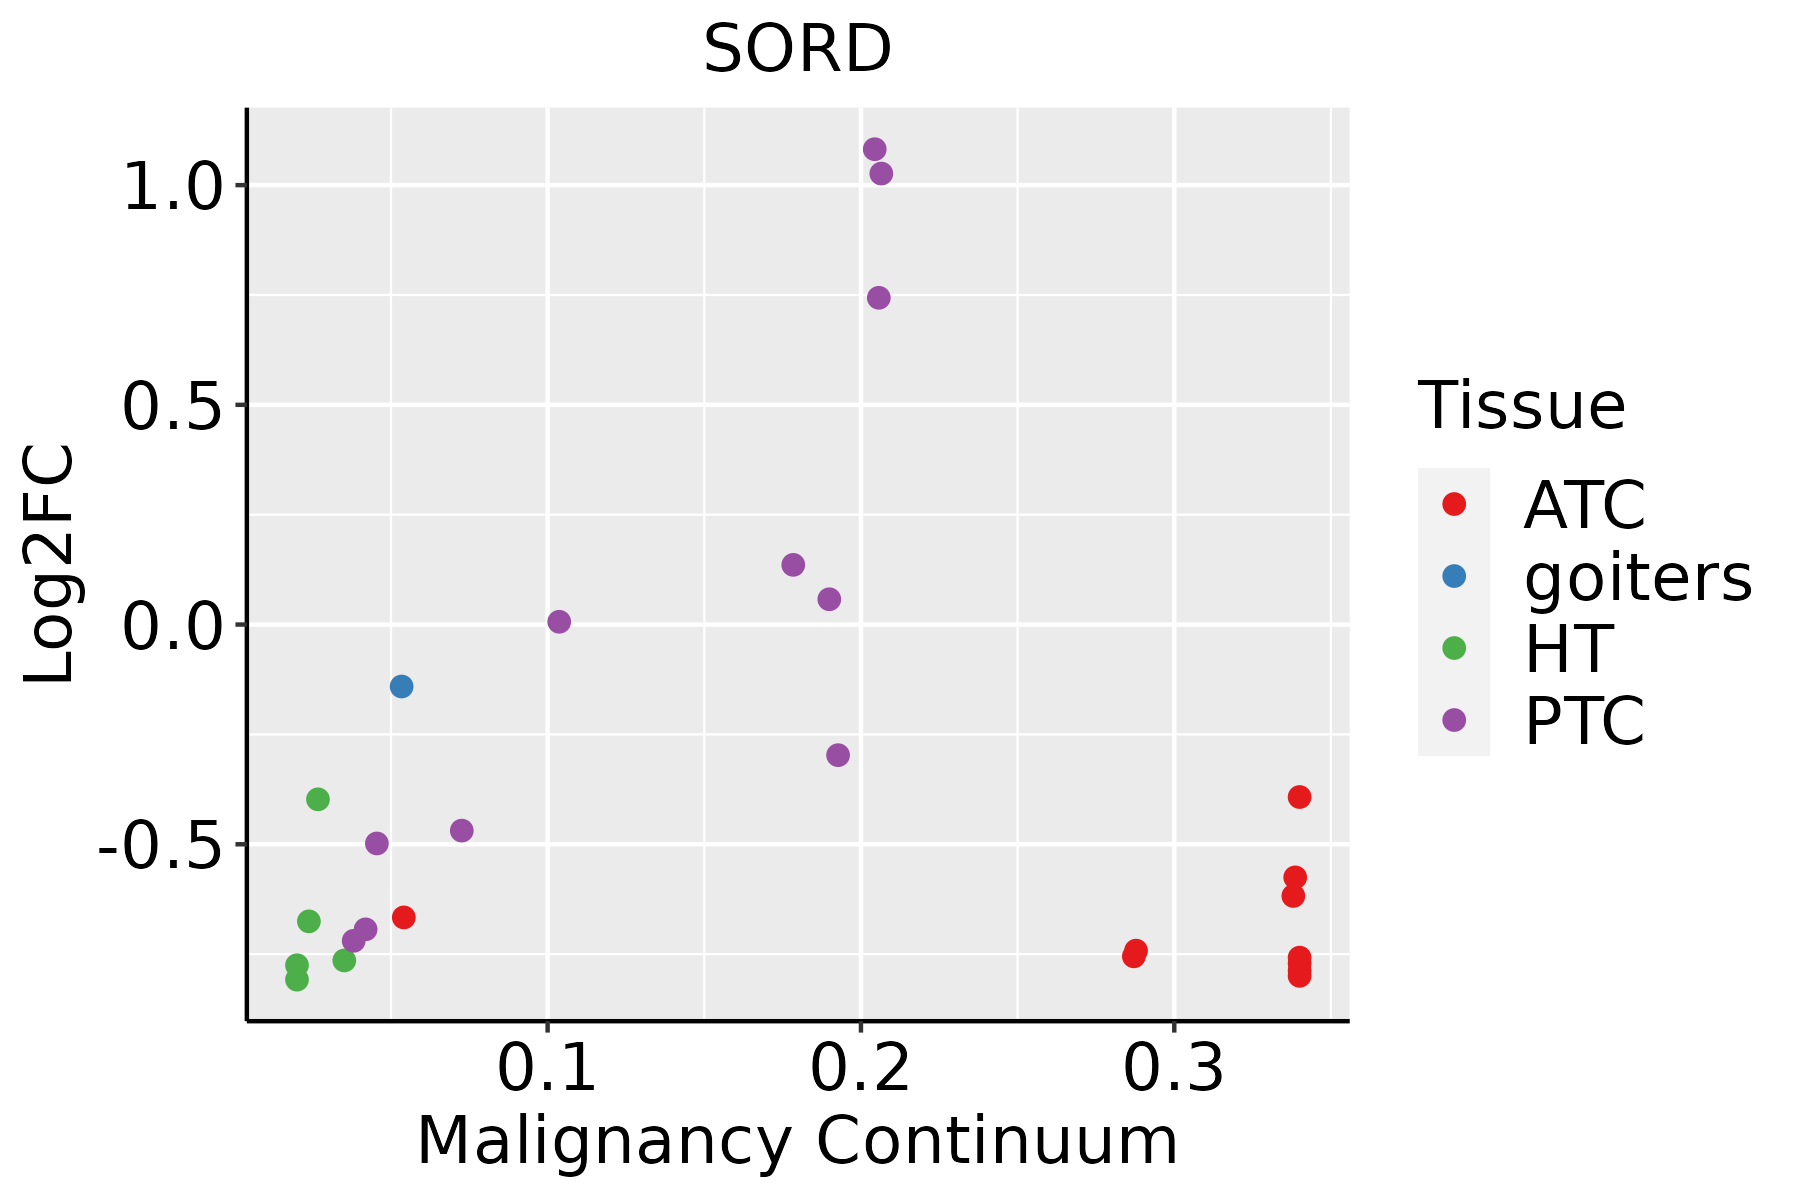 | ATC: Anaplastic thyroid cancer |
| HT: Hashimoto's thyroiditis | ||
| PTC: Papillary thyroid cancer |
| ∗log2FC in expression of this searched gene in stem-like cells from each diseased tissue sample relative to stem-like cells in normal samples in each tissue plotted against the malignancy continuum. Samples are colored based on if they are from different disease stage. |
Top |
Malignant transformation related pathway analysis |
| Find out the enriched GO biological processes and KEGG pathways involved in transition from healthy to precancer to cancer |
| Tissue | Disease Stage | Enriched GO biological Processes |
| Colorectum | AD |  |
| Colorectum | SER |  |
| Colorectum | MSS |  |
| Colorectum | MSI-H |  |
| Colorectum | FAP |  |
| ∗Top 15 enriched GO BP terms are showed in the bar plot of each disease state in each tissue. Each row represents a significant GO biological process which is colored according to the -log10(p.adjust). |
| Page: 1 2 3 4 5 6 7 8 9 |
| GO ID | Tissue | Disease Stage | Description | Gene Ratio | Bg Ratio | pvalue | p.adjust | Count |
| GO:0044275 | Prostate | BPH | cellular carbohydrate catabolic process | 13/3107 | 40/18723 | 1.01e-02 | 4.25e-02 | 13 |
| GO:001003819 | Prostate | Tumor | response to metal ion | 107/3246 | 373/18723 | 3.02e-08 | 9.77e-07 | 107 |
| GO:003166719 | Prostate | Tumor | response to nutrient levels | 127/3246 | 474/18723 | 1.27e-07 | 3.28e-06 | 127 |
| GO:000600613 | Prostate | Tumor | glucose metabolic process | 55/3246 | 196/18723 | 1.22e-04 | 1.14e-03 | 55 |
| GO:000941017 | Prostate | Tumor | response to xenobiotic stimulus | 110/3246 | 462/18723 | 2.13e-04 | 1.84e-03 | 110 |
| GO:004668615 | Prostate | Tumor | response to cadmium ion | 24/3246 | 68/18723 | 2.85e-04 | 2.32e-03 | 24 |
| GO:004668815 | Prostate | Tumor | response to copper ion | 17/3246 | 42/18723 | 3.45e-04 | 2.73e-03 | 17 |
| GO:001605214 | Prostate | Tumor | carbohydrate catabolic process | 42/3246 | 154/18723 | 1.35e-03 | 8.44e-03 | 42 |
| GO:000697013 | Prostate | Tumor | response to osmotic stress | 26/3246 | 84/18723 | 1.58e-03 | 9.63e-03 | 26 |
| GO:00193187 | Prostate | Tumor | hexose metabolic process | 59/3246 | 237/18723 | 1.96e-03 | 1.14e-02 | 59 |
| GO:00059967 | Prostate | Tumor | monosaccharide metabolic process | 62/3246 | 257/18723 | 3.38e-03 | 1.75e-02 | 62 |
| GO:004426212 | Prostate | Tumor | cellular carbohydrate metabolic process | 66/3246 | 283/18723 | 5.90e-03 | 2.74e-02 | 66 |
| GO:001003829 | Skin | cSCC | response to metal ion | 132/4864 | 373/18723 | 3.11e-05 | 3.42e-04 | 132 |
| GO:003166728 | Skin | cSCC | response to nutrient levels | 160/4864 | 474/18723 | 8.44e-05 | 8.02e-04 | 160 |
| GO:004668624 | Skin | cSCC | response to cadmium ion | 32/4864 | 68/18723 | 1.44e-04 | 1.29e-03 | 32 |
| GO:0009410110 | Skin | cSCC | response to xenobiotic stimulus | 151/4864 | 462/18723 | 6.76e-04 | 4.82e-03 | 151 |
| GO:000697021 | Skin | cSCC | response to osmotic stress | 35/4864 | 84/18723 | 1.23e-03 | 7.97e-03 | 35 |
| GO:000599610 | Skin | cSCC | monosaccharide metabolic process | 85/4864 | 257/18723 | 6.43e-03 | 3.14e-02 | 85 |
| GO:000600610 | Skin | cSCC | glucose metabolic process | 66/4864 | 196/18723 | 9.75e-03 | 4.32e-02 | 66 |
| GO:004668625 | Thyroid | HT | response to cadmium ion | 17/1272 | 68/18723 | 2.05e-06 | 7.51e-05 | 17 |
| Page: 1 2 3 4 5 6 7 8 |
| Pathway ID | Tissue | Disease Stage | Description | Gene Ratio | Bg Ratio | pvalue | p.adjust | qvalue | Count |
| hsa000512 | Esophagus | ESCC | Fructose and mannose metabolism | 24/4205 | 34/8465 | 1.09e-02 | 2.51e-02 | 1.29e-02 | 24 |
| hsa0005111 | Esophagus | ESCC | Fructose and mannose metabolism | 24/4205 | 34/8465 | 1.09e-02 | 2.51e-02 | 1.29e-02 | 24 |
| Page: 1 |
Top |
Cell-cell communication analysis |
| Identification of potential cell-cell interactions between two cell types and their ligand-receptor pairs for different disease states |
| Ligand | Receptor | LRpair | Pathway | Tissue | Disease Stage |
| Page: 1 |
Top |
Single-cell gene regulatory network inference analysis |
| Find out the significant the regulons (TFs) and the target genes of each regulon across cell types for different disease states |
| TF | Cell Type | Tissue | Disease Stage | Target Gene | RSS | Regulon Activity |
| ∗The dot plots of a searched regulon are shown for all cell subpopulations in each disease state of each tissue based on the regulon specific score inferred using pySCENIC and by calculating the average expression. |
| Page: 1 |
Top |
Somatic mutation of malignant transformation related genes |
| Annotation of somatic variants for genes involved in malignant transformation |
| Hugo Symbol | Variant Class | Variant Classification | dbSNP RS | HGVSc | HGVSp | HGVSp Short | SWISSPROT | BIOTYPE | SIFT | PolyPhen | Tumor Sample Barcode | Tissue | Histology | Sex | Age | Stage | Therapy Types | Drugs | Outcome |
| SORD | SNV | Missense_Mutation | novel | c.775G>A | p.Ala259Thr | p.A259T | Q00796 | protein_coding | tolerated(1) | benign(0.003) | TCGA-BH-A0HF-01 | Breast | breast invasive carcinoma | Female | >=65 | I/II | Hormone Therapy | arimidex | SD |
| SORD | SNV | Missense_Mutation | rs764994105 | c.196A>G | p.Met66Val | p.M66V | Q00796 | protein_coding | deleterious(0) | probably_damaging(0.971) | TCGA-E2-A14W-01 | Breast | breast invasive carcinoma | Male | >=65 | I/II | Chemotherapy | cytoxan | SD |
| SORD | SNV | Missense_Mutation | c.270N>A | p.Asp90Glu | p.D90E | Q00796 | protein_coding | deleterious(0.02) | probably_damaging(1) | TCGA-E2-A1LG-01 | Breast | breast invasive carcinoma | Female | <65 | I/II | Chemotherapy | doxorubicin | SD | |
| SORD | SNV | Missense_Mutation | novel | c.245N>T | p.Ser82Leu | p.S82L | Q00796 | protein_coding | tolerated(0.33) | benign(0.003) | TCGA-2W-A8YY-01 | Cervix | cervical & endocervical cancer | Female | <65 | I/II | Chemotherapy | cisplatin | CR |
| SORD | SNV | Missense_Mutation | novel | c.137N>A | p.Gly46Asp | p.G46D | Q00796 | protein_coding | deleterious(0) | probably_damaging(0.945) | TCGA-A6-6781-01 | Colorectum | colon adenocarcinoma | Male | <65 | III/IV | Chemotherapy | oxaliplatin | SD |
| SORD | SNV | Missense_Mutation | novel | c.999G>T | p.Glu333Asp | p.E333D | Q00796 | protein_coding | tolerated(0.21) | benign(0.001) | TCGA-AA-3663-01 | Colorectum | colon adenocarcinoma | Male | <65 | I/II | Unknown | Unknown | SD |
| SORD | SNV | Missense_Mutation | rs764998822 | c.926N>T | p.Ser309Leu | p.S309L | Q00796 | protein_coding | tolerated(0.1) | possibly_damaging(0.618) | TCGA-AA-3984-01 | Colorectum | colon adenocarcinoma | Female | <65 | I/II | Unknown | Unknown | SD |
| SORD | SNV | Missense_Mutation | c.389N>A | p.Cys130Tyr | p.C130Y | Q00796 | protein_coding | deleterious(0.01) | probably_damaging(0.985) | TCGA-AD-A5EJ-01 | Colorectum | colon adenocarcinoma | Female | >=65 | I/II | Unknown | Unknown | SD | |
| SORD | SNV | Missense_Mutation | novel | c.842N>T | p.Thr281Ile | p.T281I | Q00796 | protein_coding | deleterious(0.02) | benign(0.287) | TCGA-AZ-6601-01 | Colorectum | colon adenocarcinoma | Male | >=65 | I/II | Unknown | Unknown | PD |
| SORD | SNV | Missense_Mutation | c.1049G>T | p.Cys350Phe | p.C350F | Q00796 | protein_coding | deleterious(0) | probably_damaging(0.985) | TCGA-AF-3913-01 | Colorectum | rectum adenocarcinoma | Male | <65 | III/IV | Chemotherapy | xeloda | PD |
| Page: 1 2 3 4 |
Top |
Related drugs of malignant transformation related genes |
| Identification of chemicals and drugs interact with genes involved in malignant transfromation |
| (DGIdb 4.0) |
| Entrez ID | Symbol | Category | Interaction Types | Drug Claim Name | Drug Name | PMIDs |
| Page: 1 |

Copyright 2023-Present -The University of Texas Health Science Center at Houston |