
|
|||||
|
 | |
| |
| |
| |
| |
| |
|
Gene: SOCS3 |
Gene summary for SOCS3 |
| Gene information | Species | Human | Gene symbol | SOCS3 | Gene ID | 9021 |
| Gene name | suppressor of cytokine signaling 3 | |
| Gene Alias | ATOD4 | |
| Cytomap | 17q25.3 | |
| Gene Type | protein-coding | GO ID | GO:0000003 | UniProtAcc | O14543 |
Top |
Malignant transformation analysis |
| Identification of the aberrant gene expression in precancerous and cancerous lesions by comparing the gene expression of stem-like cells in diseased tissues with normal stem cells |
| Entrez ID | Symbol | Replicates | Species | Organ | Tissue | Adj P-value | Log2FC | Malignancy |
| 9021 | SOCS3 | AEH-subject3 | Human | Endometrium | AEH | 1.08e-08 | -4.67e-01 | -0.2576 |
| 9021 | SOCS3 | AEH-subject5 | Human | Endometrium | AEH | 4.06e-20 | -5.82e-01 | -0.2953 |
| 9021 | SOCS3 | EEC-subject1 | Human | Endometrium | EEC | 1.20e-11 | -4.69e-01 | -0.2682 |
| 9021 | SOCS3 | EEC-subject2 | Human | Endometrium | EEC | 1.61e-05 | -3.53e-01 | -0.2607 |
| 9021 | SOCS3 | EEC-subject3 | Human | Endometrium | EEC | 8.19e-11 | -2.36e-01 | -0.2525 |
| 9021 | SOCS3 | EEC-subject4 | Human | Endometrium | EEC | 4.03e-02 | -2.79e-01 | -0.2571 |
| 9021 | SOCS3 | EEC-subject5 | Human | Endometrium | EEC | 3.66e-16 | -5.33e-01 | -0.249 |
| 9021 | SOCS3 | GSM5276934 | Human | Endometrium | EEC | 3.49e-05 | -3.76e-01 | -0.0913 |
| 9021 | SOCS3 | GSM5276935 | Human | Endometrium | EEC | 1.70e-16 | -5.70e-01 | -0.123 |
| 9021 | SOCS3 | GSM6177620_NYU_UCEC1_lib1_lib1 | Human | Endometrium | EEC | 2.35e-09 | -3.70e-01 | -0.1869 |
| 9021 | SOCS3 | GSM6177620_NYU_UCEC1_lib2_lib2 | Human | Endometrium | EEC | 4.22e-15 | -5.28e-01 | -0.1875 |
| 9021 | SOCS3 | GSM6177620_NYU_UCEC1_lib3_lib3 | Human | Endometrium | EEC | 1.82e-14 | -4.89e-01 | -0.1883 |
| 9021 | SOCS3 | GSM6177621_NYU_UCEC2_lib1_lib1 | Human | Endometrium | EEC | 1.50e-12 | -3.78e-01 | -0.1934 |
| 9021 | SOCS3 | GSM6177622_NYU_UCEC3_lib1_lib1 | Human | Endometrium | EEC | 5.63e-15 | -2.74e-01 | -0.1917 |
| 9021 | SOCS3 | GSM6177622_NYU_UCEC3_lib2_lib2 | Human | Endometrium | EEC | 2.96e-16 | -2.31e-01 | -0.1916 |
| 9021 | SOCS3 | LZE4T | Human | Esophagus | ESCC | 1.94e-05 | -4.36e-01 | 0.0811 |
| 9021 | SOCS3 | LZE7T | Human | Esophagus | ESCC | 1.83e-02 | -8.49e-02 | 0.0667 |
| 9021 | SOCS3 | LZE24T | Human | Esophagus | ESCC | 7.21e-23 | 2.27e+00 | 0.0596 |
| 9021 | SOCS3 | LZE21T | Human | Esophagus | ESCC | 2.17e-04 | 1.53e+00 | 0.0655 |
| 9021 | SOCS3 | LZE6T | Human | Esophagus | ESCC | 2.87e-04 | -3.98e-01 | 0.0845 |
| Page: 1 2 3 4 5 6 7 8 |
| Tissue | Expression Dynamics | Abbreviation |
| Endometrium | 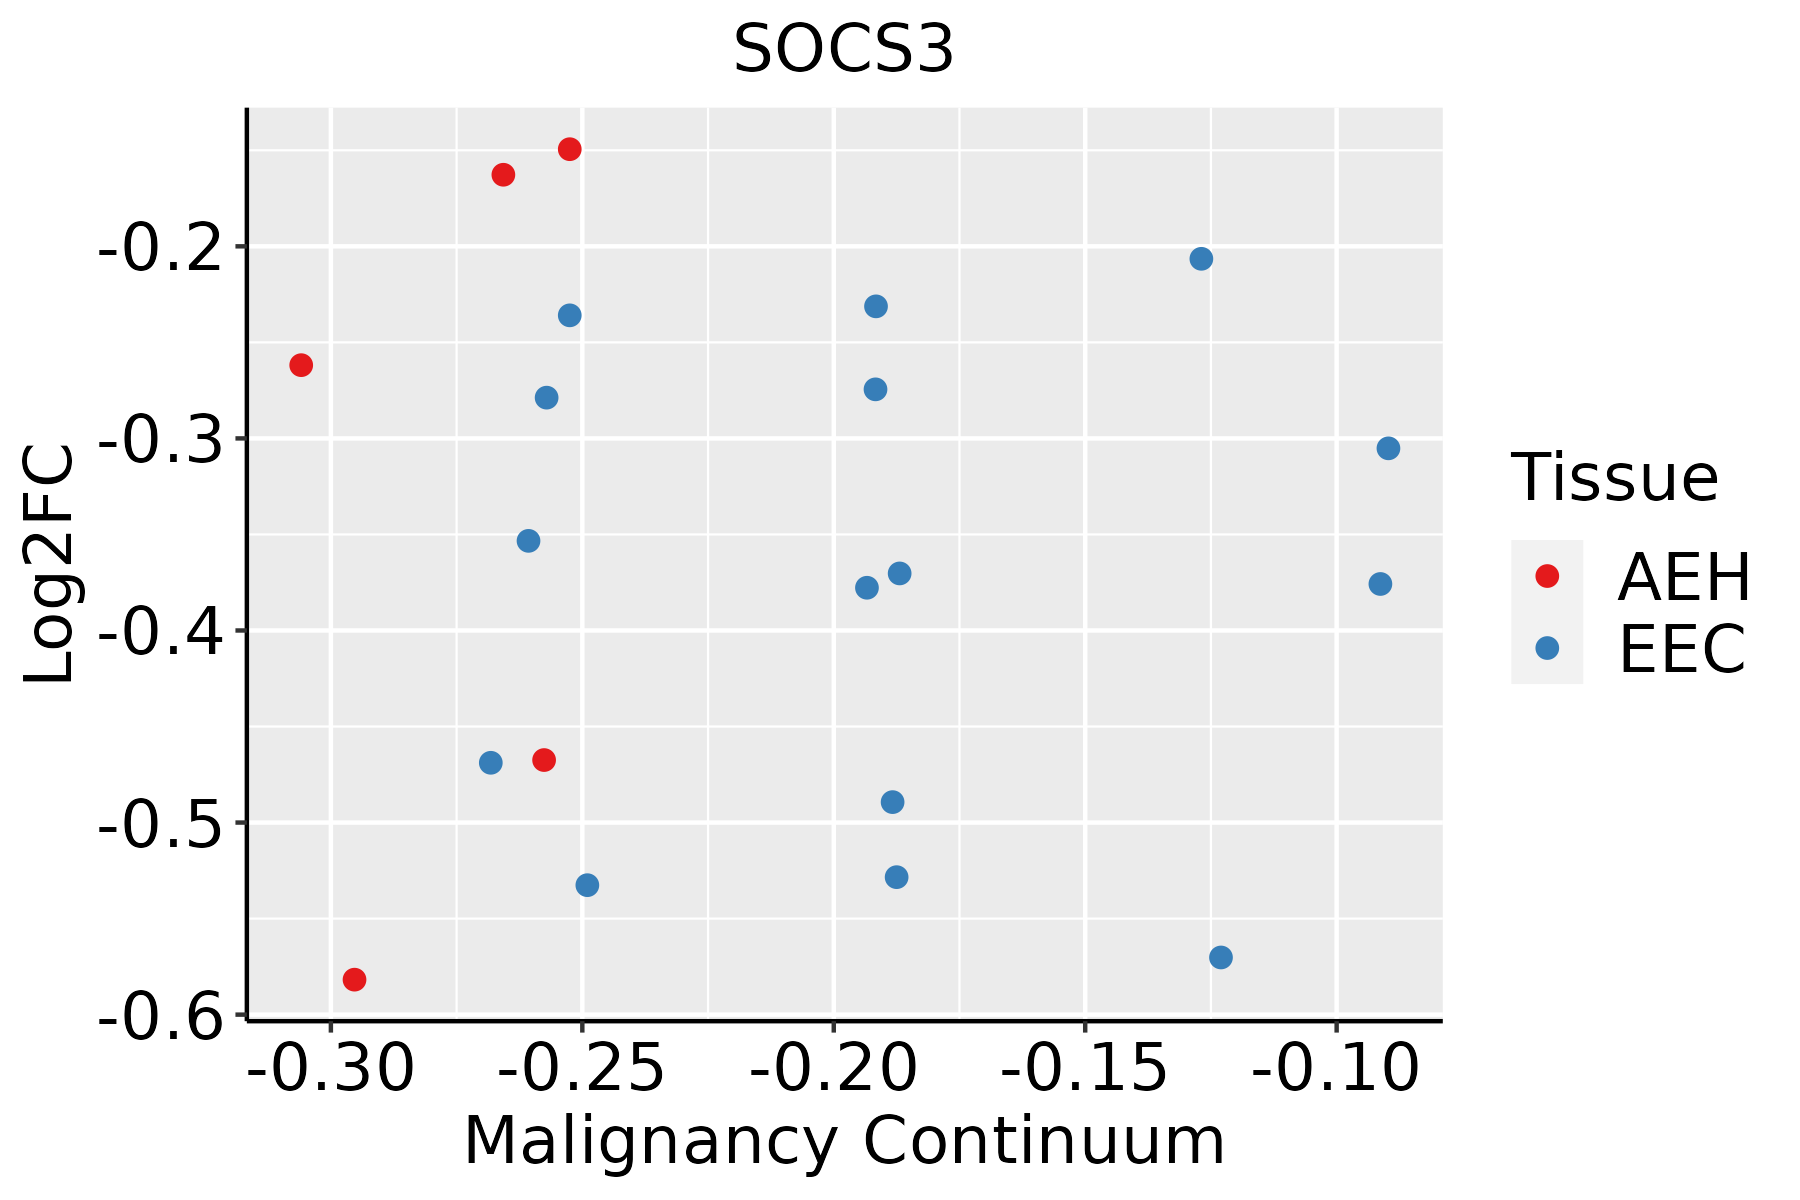 | AEH: Atypical endometrial hyperplasia |
| EEC: Endometrioid Cancer | ||
| Esophagus | 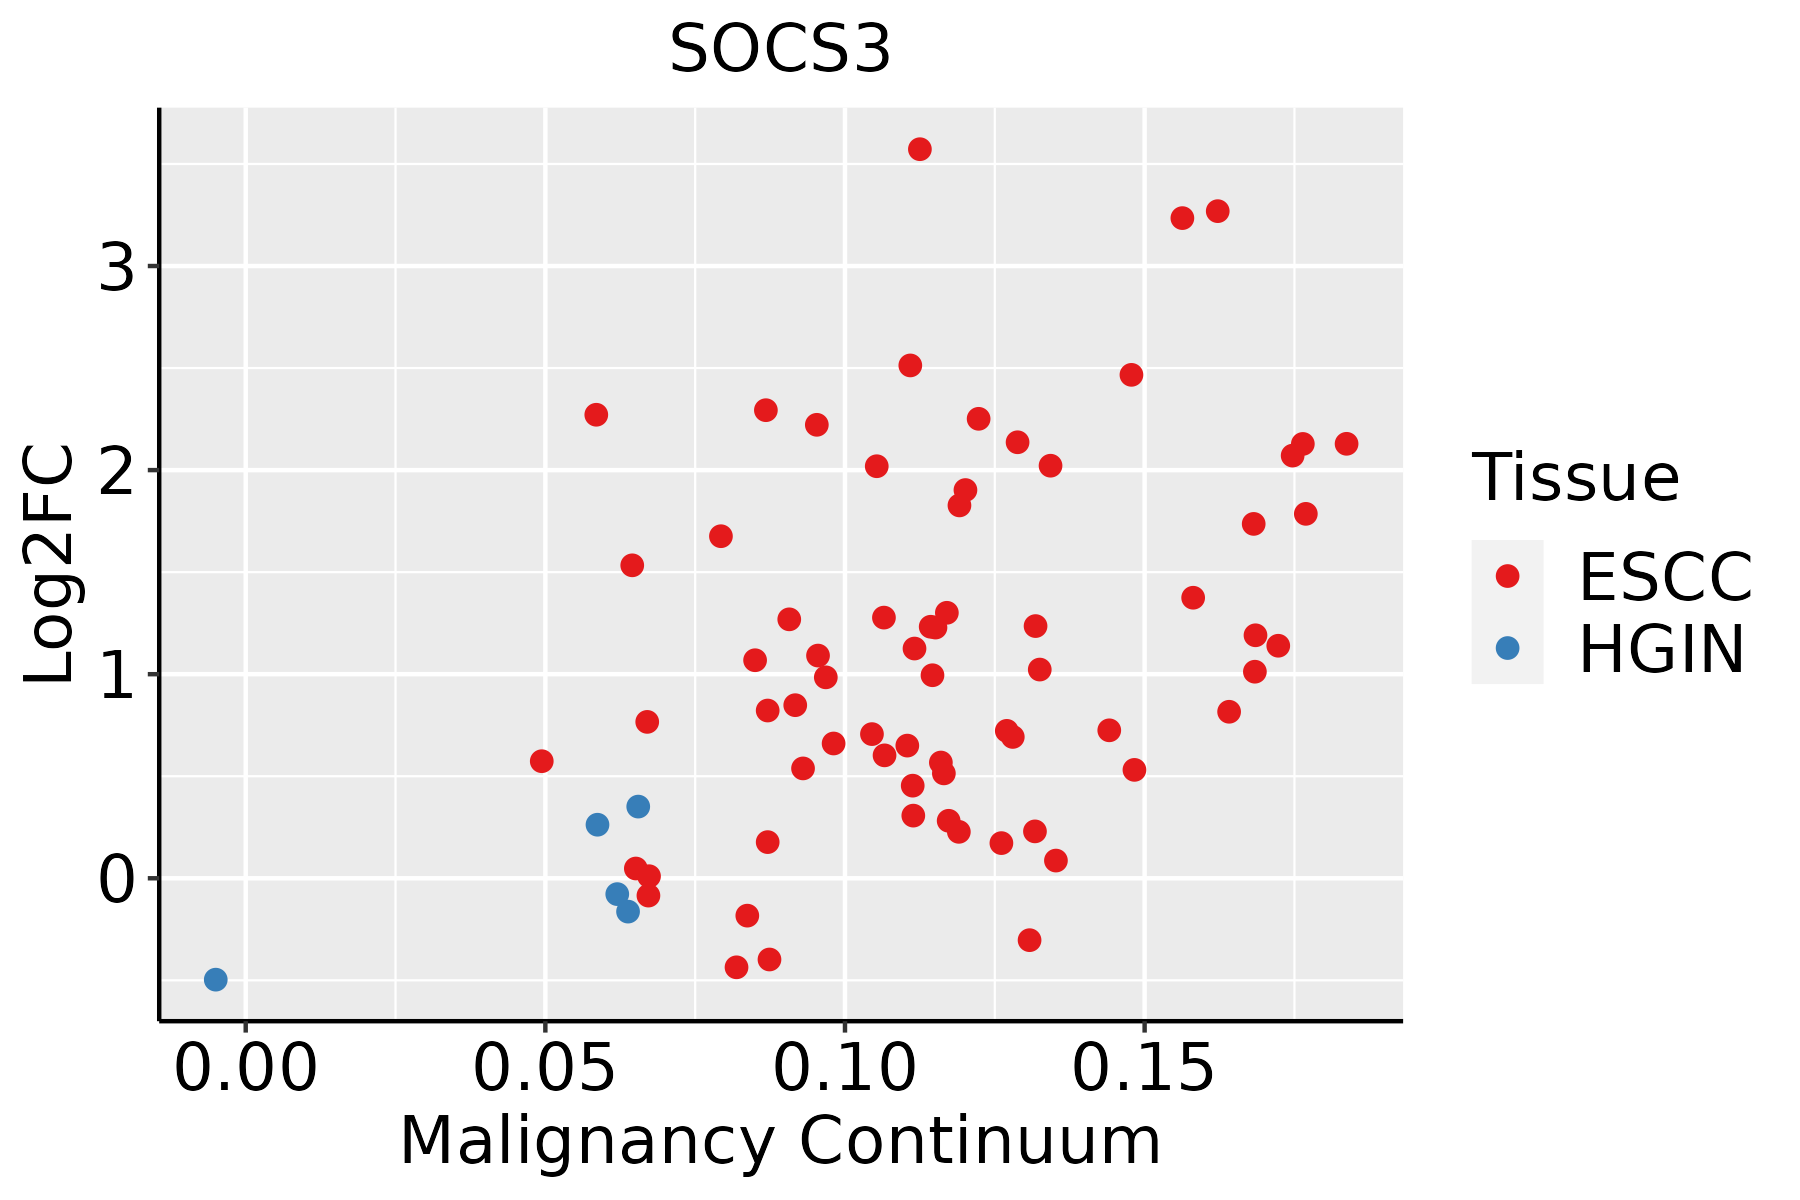 | ESCC: Esophageal squamous cell carcinoma |
| HGIN: High-grade intraepithelial neoplasias | ||
| LGIN: Low-grade intraepithelial neoplasias | ||
| Liver | 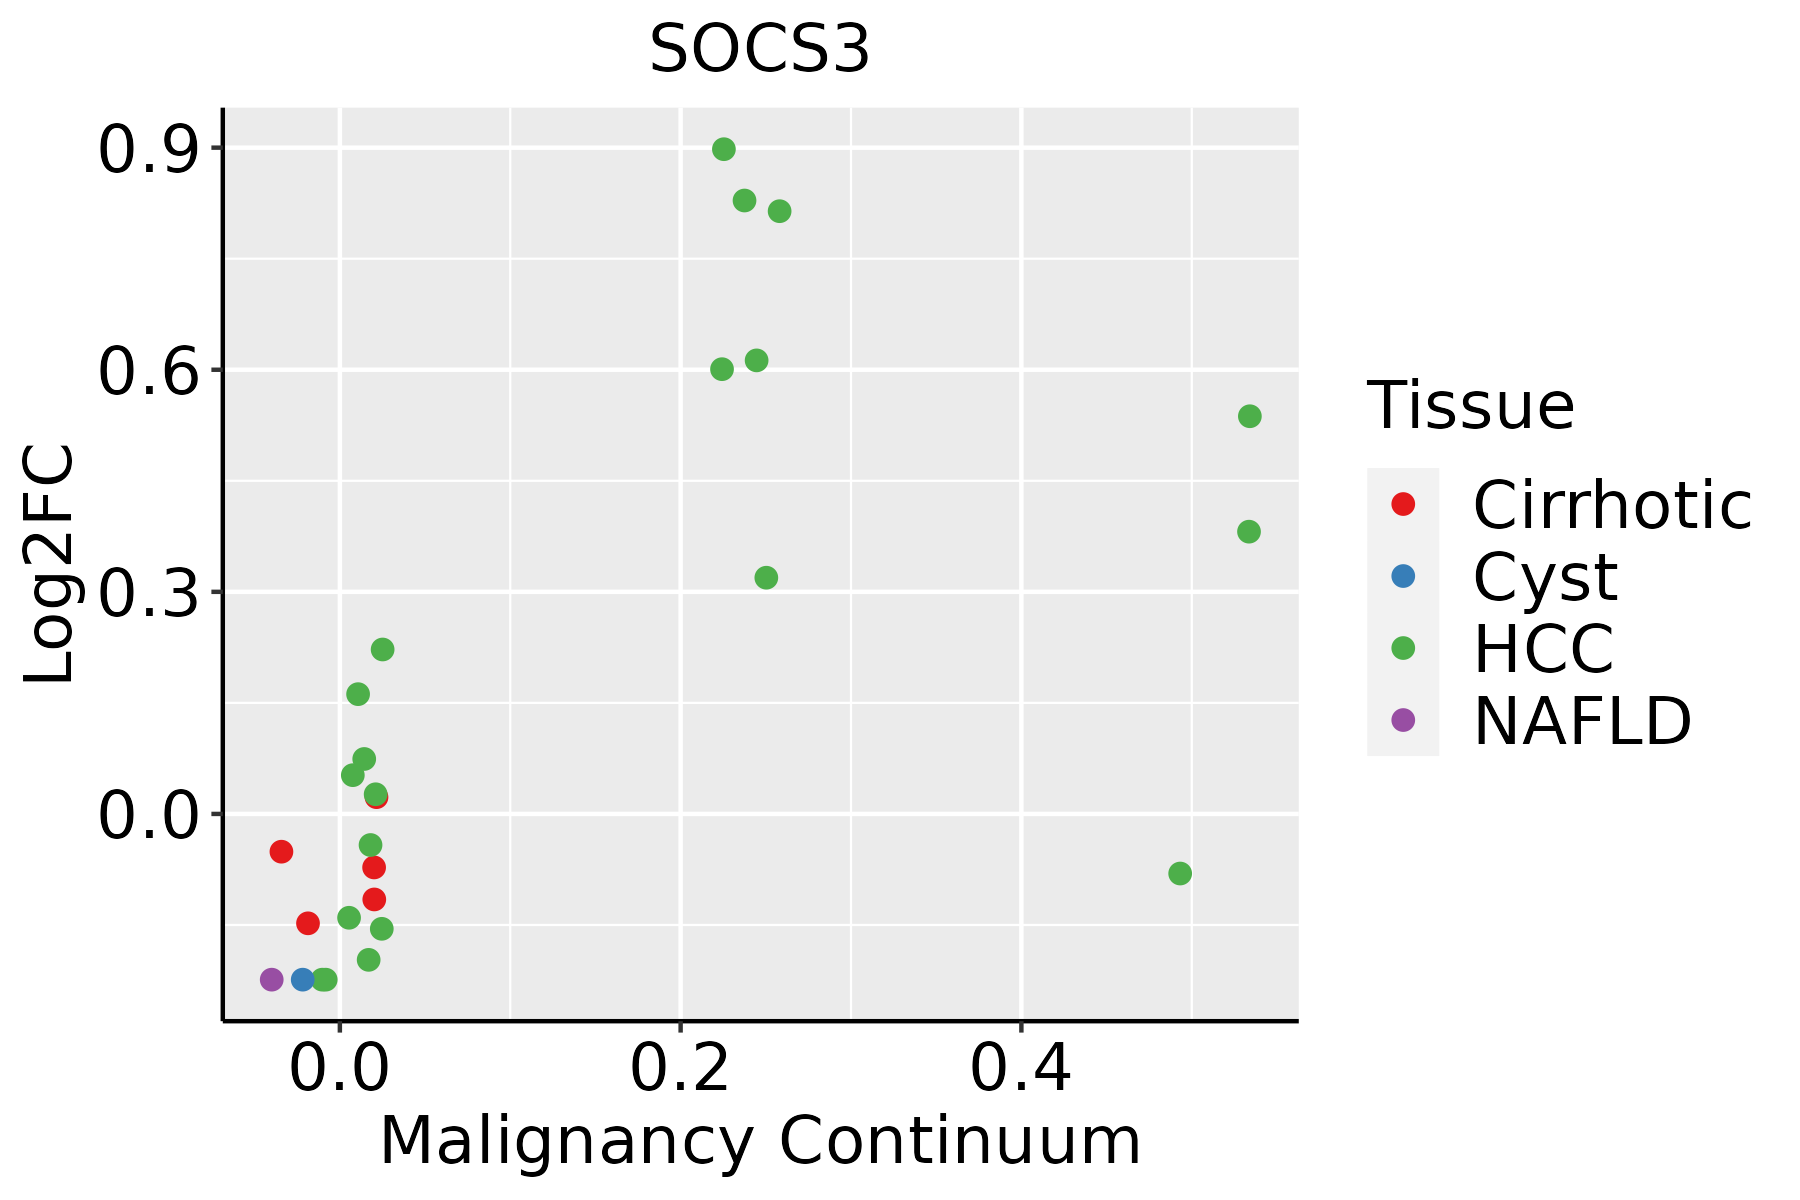 | HCC: Hepatocellular carcinoma |
| NAFLD: Non-alcoholic fatty liver disease | ||
| Oral Cavity | 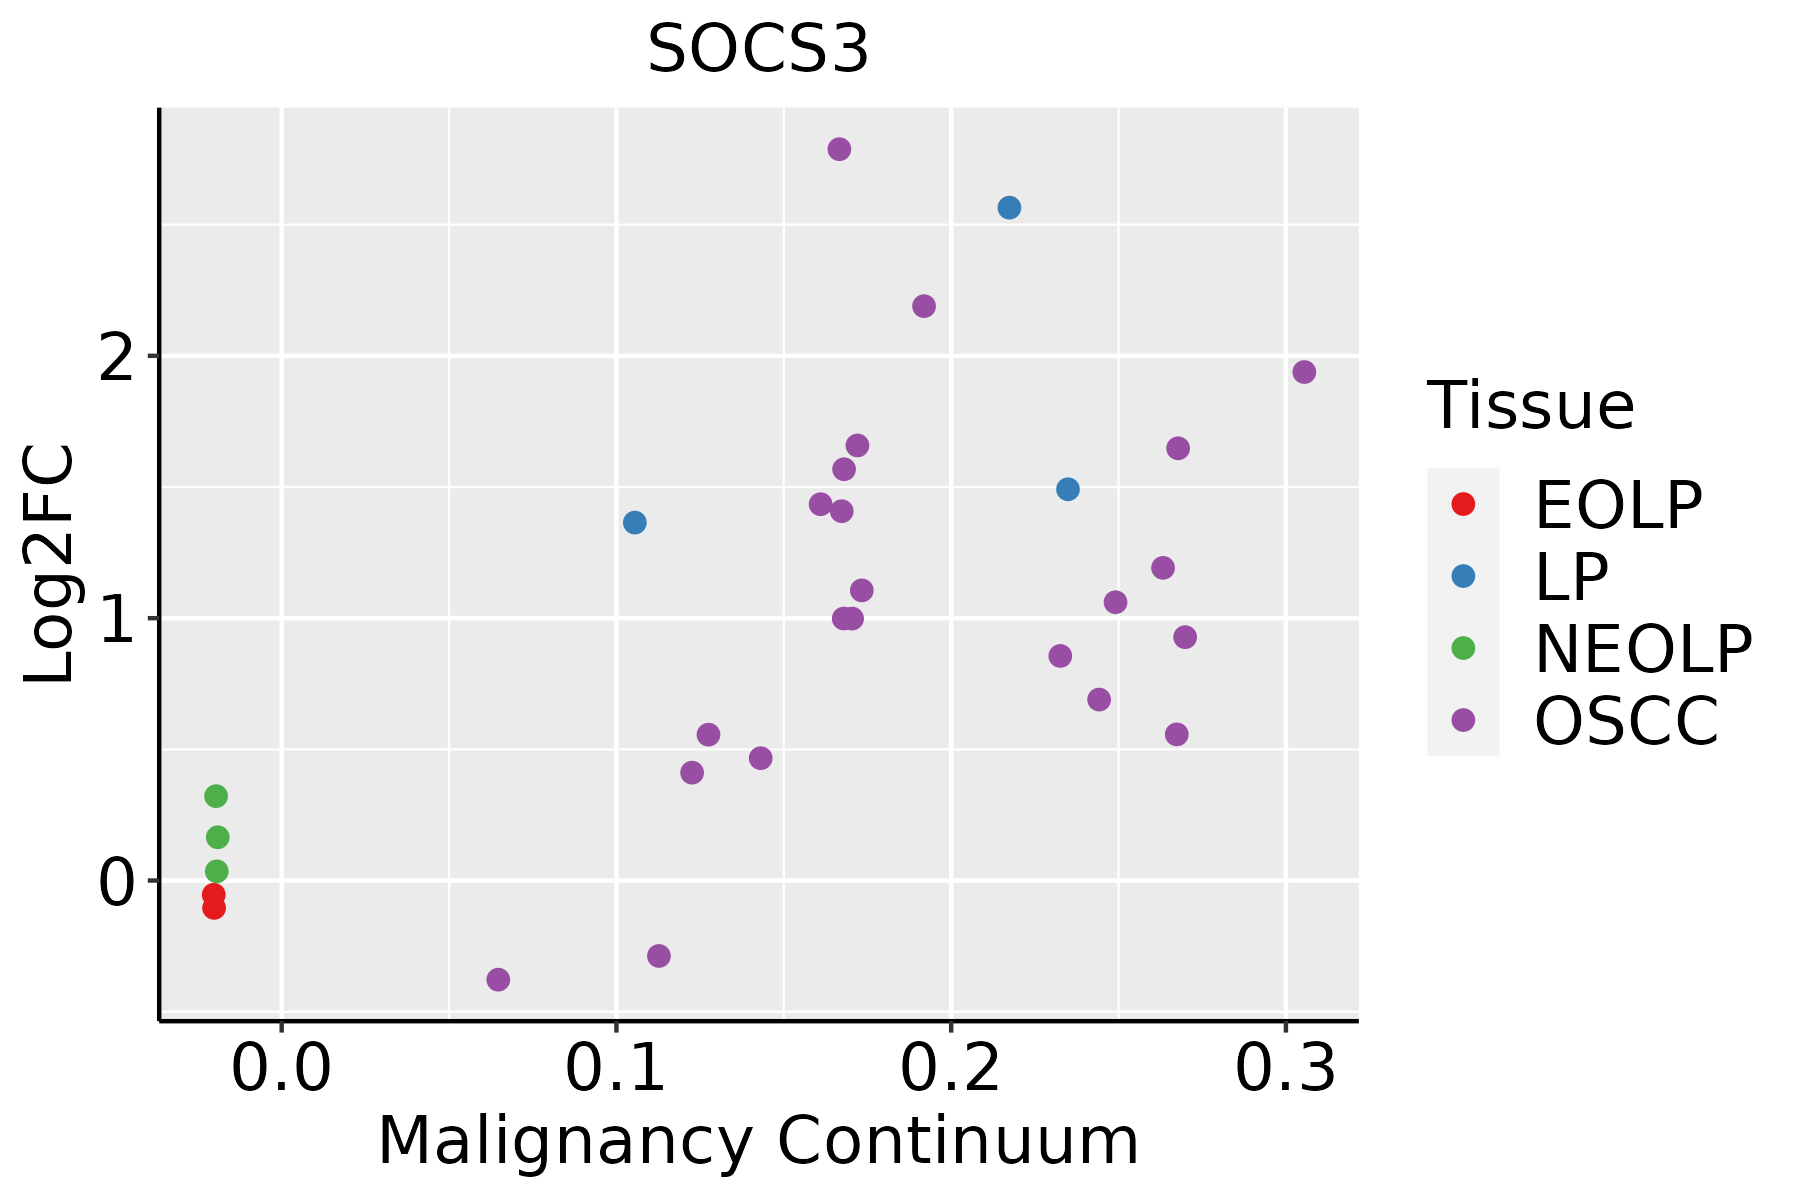 | EOLP: Erosive Oral lichen planus |
| LP: leukoplakia | ||
| NEOLP: Non-erosive oral lichen planus | ||
| OSCC: Oral squamous cell carcinoma | ||
| Prostate | 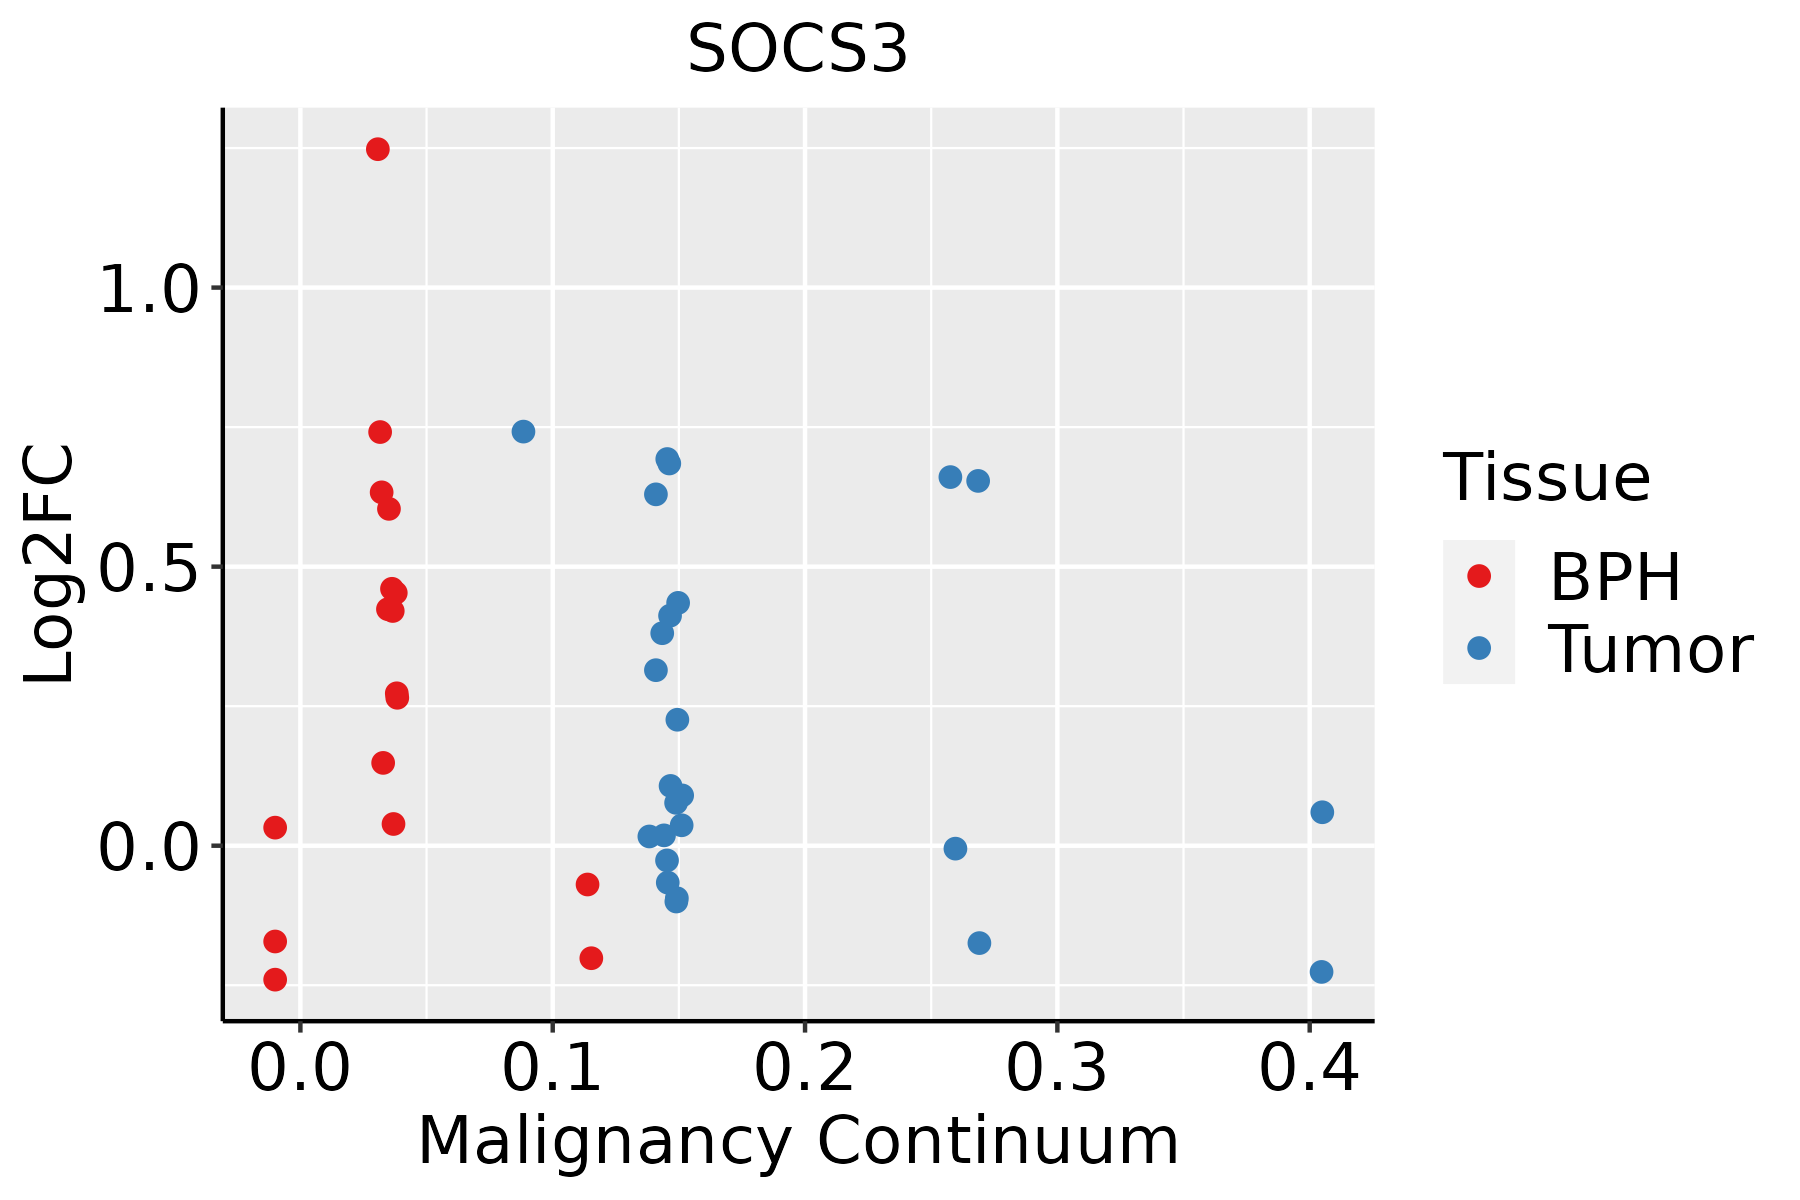 | BPH: Benign Prostatic Hyperplasia |
| Skin | 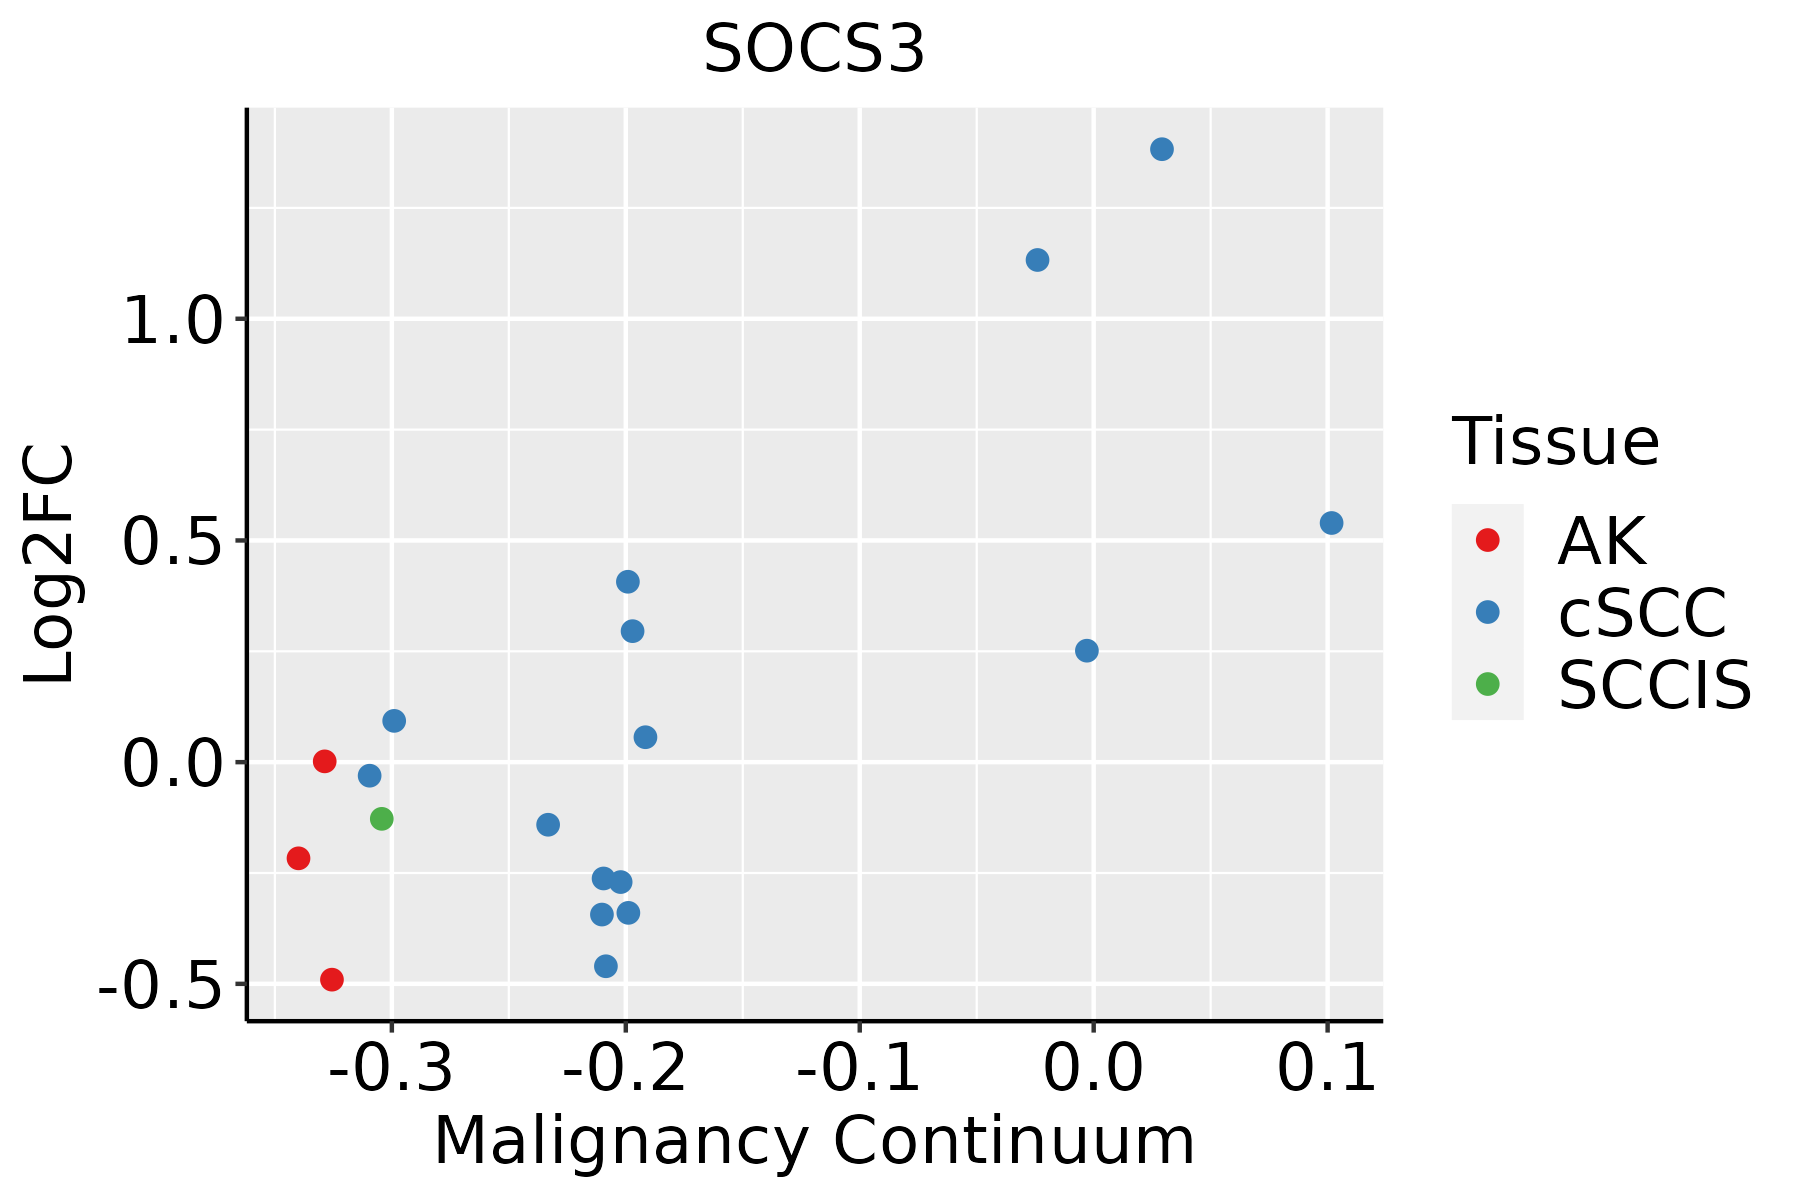 | AK: Actinic keratosis |
| cSCC: Cutaneous squamous cell carcinoma | ||
| SCCIS:squamous cell carcinoma in situ | ||
| Thyroid | 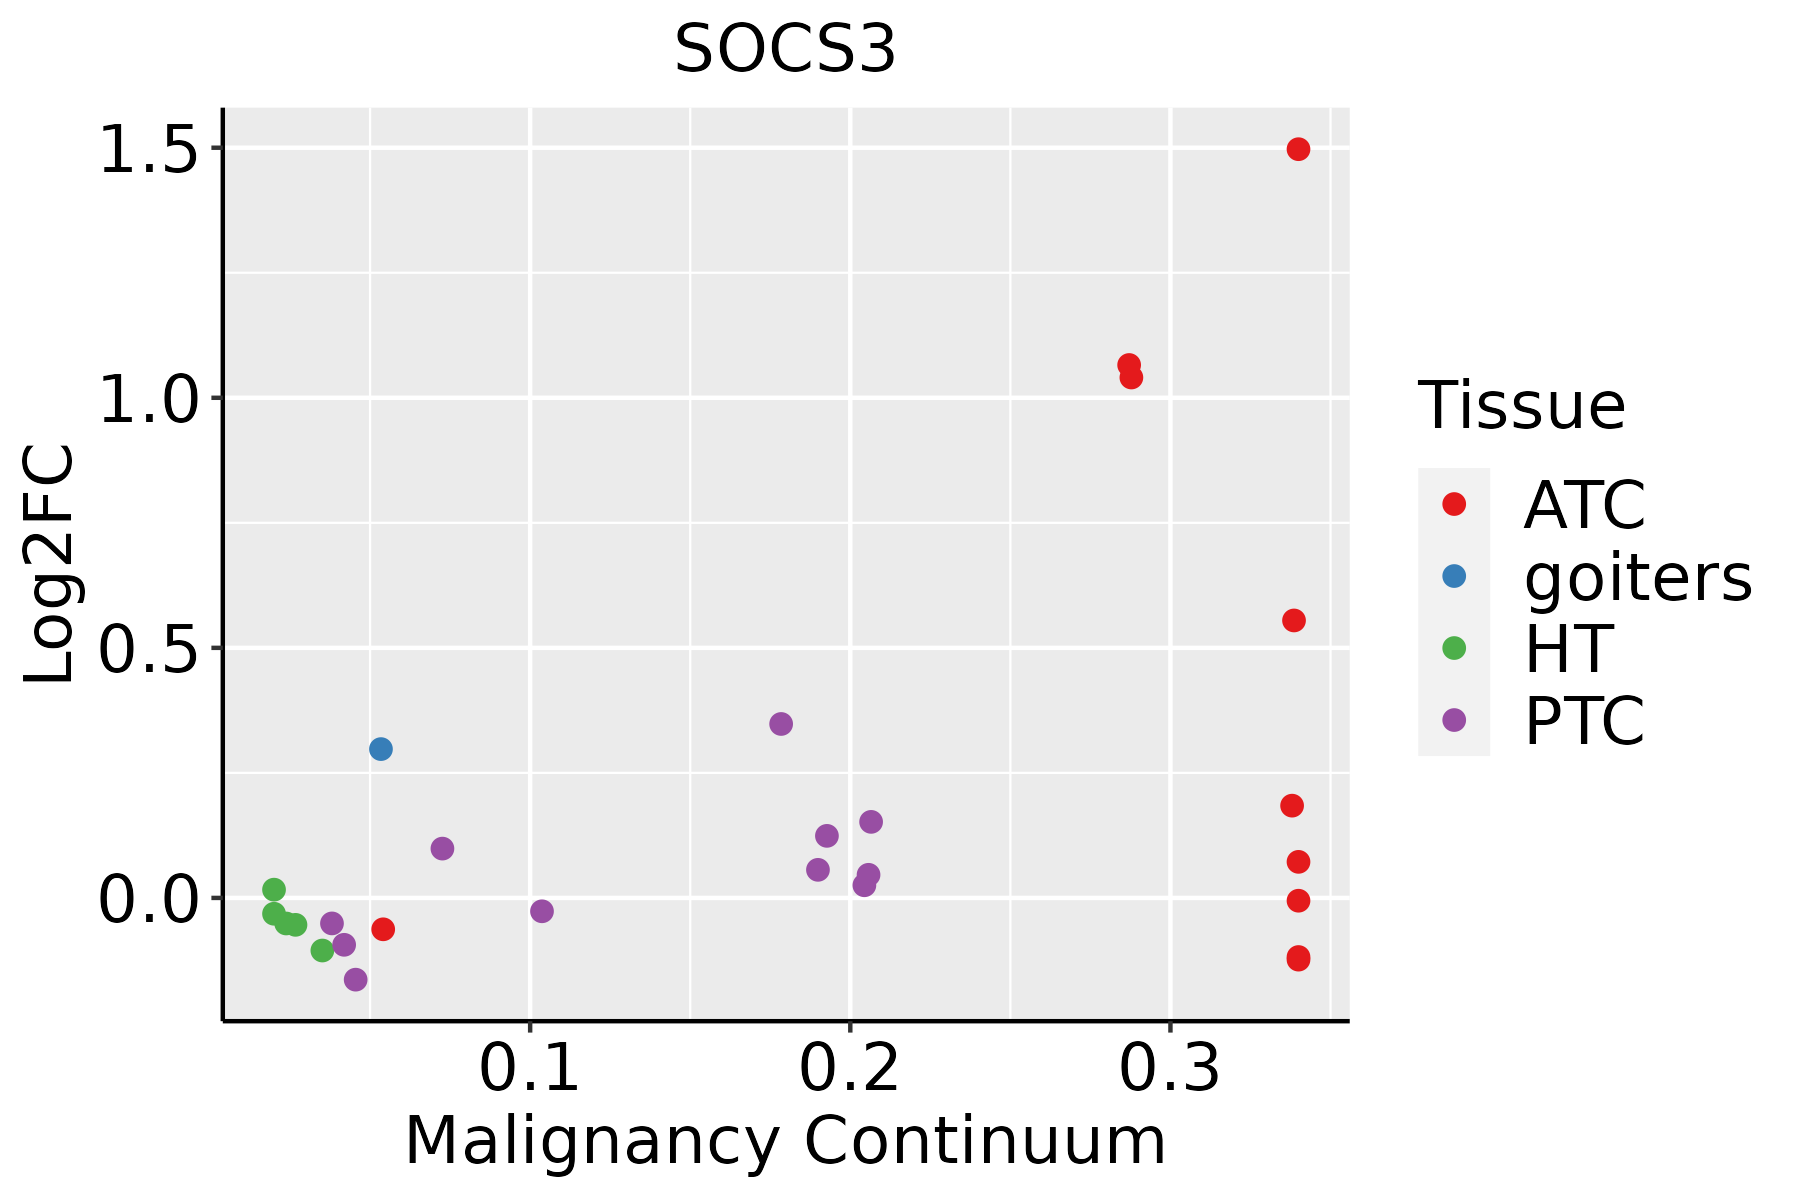 | ATC: Anaplastic thyroid cancer |
| HT: Hashimoto's thyroiditis | ||
| PTC: Papillary thyroid cancer |
| ∗log2FC in expression of this searched gene in stem-like cells from each diseased tissue sample relative to stem-like cells in normal samples in each tissue plotted against the malignancy continuum. Samples are colored based on if they are from different disease stage. |
Top |
Malignant transformation related pathway analysis |
| Find out the enriched GO biological processes and KEGG pathways involved in transition from healthy to precancer to cancer |
| Tissue | Disease Stage | Enriched GO biological Processes |
| Colorectum | AD |  |
| Colorectum | SER |  |
| Colorectum | MSS |  |
| Colorectum | MSI-H |  |
| Colorectum | FAP |  |
| ∗Top 15 enriched GO BP terms are showed in the bar plot of each disease state in each tissue. Each row represents a significant GO biological process which is colored according to the -log10(p.adjust). |
| Page: 1 2 3 4 5 6 7 8 9 |
| GO ID | Tissue | Disease Stage | Description | Gene Ratio | Bg Ratio | pvalue | p.adjust | Count |
| GO:004343422 | Liver | HCC | response to peptide hormone | 247/7958 | 414/18723 | 9.55e-13 | 4.77e-11 | 247 |
| GO:001056322 | Liver | HCC | negative regulation of phosphorus metabolic process | 259/7958 | 442/18723 | 4.29e-12 | 1.92e-10 | 259 |
| GO:004593622 | Liver | HCC | negative regulation of phosphate metabolic process | 258/7958 | 441/18723 | 6.00e-12 | 2.60e-10 | 258 |
| GO:007137521 | Liver | HCC | cellular response to peptide hormone stimulus | 179/7958 | 290/18723 | 2.54e-11 | 9.88e-10 | 179 |
| GO:004232622 | Liver | HCC | negative regulation of phosphorylation | 227/7958 | 385/18723 | 3.98e-11 | 1.52e-09 | 227 |
| GO:190165321 | Liver | HCC | cellular response to peptide | 211/7958 | 359/18723 | 2.86e-10 | 9.63e-09 | 211 |
| GO:000193322 | Liver | HCC | negative regulation of protein phosphorylation | 196/7958 | 342/18723 | 1.95e-08 | 4.63e-07 | 196 |
| GO:00086542 | Liver | HCC | phospholipid biosynthetic process | 150/7958 | 253/18723 | 4.77e-08 | 1.03e-06 | 150 |
| GO:00082862 | Liver | HCC | insulin receptor signaling pathway | 78/7958 | 116/18723 | 6.15e-08 | 1.29e-06 | 78 |
| GO:00066444 | Liver | HCC | phospholipid metabolic process | 214/7958 | 383/18723 | 7.25e-08 | 1.48e-06 | 214 |
| GO:000170111 | Liver | HCC | in utero embryonic development | 204/7958 | 367/18723 | 2.44e-07 | 4.30e-06 | 204 |
| GO:004648611 | Liver | HCC | glycerolipid metabolic process | 215/7958 | 392/18723 | 4.54e-07 | 7.49e-06 | 215 |
| GO:004501711 | Liver | HCC | glycerolipid biosynthetic process | 143/7958 | 252/18723 | 3.27e-06 | 4.31e-05 | 143 |
| GO:00066504 | Liver | HCC | glycerophospholipid metabolic process | 168/7958 | 306/18723 | 7.27e-06 | 8.62e-05 | 168 |
| GO:004647411 | Liver | HCC | glycerophospholipid biosynthetic process | 121/7958 | 211/18723 | 9.12e-06 | 1.06e-04 | 121 |
| GO:19000762 | Liver | HCC | regulation of cellular response to insulin stimulus | 43/7958 | 64/18723 | 5.73e-05 | 5.31e-04 | 43 |
| GO:00466261 | Liver | HCC | regulation of insulin receptor signaling pathway | 43/7958 | 66/18723 | 1.69e-04 | 1.34e-03 | 43 |
| GO:000189211 | Liver | HCC | embryonic placenta development | 50/7958 | 82/18723 | 5.62e-04 | 3.61e-03 | 50 |
| GO:000189011 | Liver | HCC | placenta development | 81/7958 | 144/18723 | 5.91e-04 | 3.75e-03 | 81 |
| GO:00606694 | Liver | HCC | embryonic placenta morphogenesis | 19/7958 | 26/18723 | 1.57e-03 | 8.23e-03 | 19 |
| Page: 1 2 3 4 5 6 7 8 9 10 11 12 13 14 15 16 17 18 19 20 |
| Pathway ID | Tissue | Disease Stage | Description | Gene Ratio | Bg Ratio | pvalue | p.adjust | qvalue | Count |
| hsa0493220 | Endometrium | AEH | Non-alcoholic fatty liver disease | 67/1197 | 155/8465 | 5.91e-19 | 1.75e-17 | 1.28e-17 | 67 |
| hsa0412016 | Endometrium | AEH | Ubiquitin mediated proteolysis | 41/1197 | 142/8465 | 3.42e-06 | 4.27e-05 | 3.13e-05 | 41 |
| hsa04932110 | Endometrium | AEH | Non-alcoholic fatty liver disease | 67/1197 | 155/8465 | 5.91e-19 | 1.75e-17 | 1.28e-17 | 67 |
| hsa0412017 | Endometrium | AEH | Ubiquitin mediated proteolysis | 41/1197 | 142/8465 | 3.42e-06 | 4.27e-05 | 3.13e-05 | 41 |
| hsa0493225 | Endometrium | EEC | Non-alcoholic fatty liver disease | 67/1237 | 155/8465 | 3.53e-18 | 1.06e-16 | 7.87e-17 | 67 |
| hsa0412023 | Endometrium | EEC | Ubiquitin mediated proteolysis | 41/1237 | 142/8465 | 7.86e-06 | 9.58e-05 | 7.14e-05 | 41 |
| hsa046687 | Endometrium | EEC | TNF signaling pathway | 27/1237 | 114/8465 | 6.47e-03 | 3.22e-02 | 2.40e-02 | 27 |
| hsa0493235 | Endometrium | EEC | Non-alcoholic fatty liver disease | 67/1237 | 155/8465 | 3.53e-18 | 1.06e-16 | 7.87e-17 | 67 |
| hsa0412033 | Endometrium | EEC | Ubiquitin mediated proteolysis | 41/1237 | 142/8465 | 7.86e-06 | 9.58e-05 | 7.14e-05 | 41 |
| hsa0466814 | Endometrium | EEC | TNF signaling pathway | 27/1237 | 114/8465 | 6.47e-03 | 3.22e-02 | 2.40e-02 | 27 |
| hsa0412027 | Esophagus | ESCC | Ubiquitin mediated proteolysis | 122/4205 | 142/8465 | 6.53e-20 | 7.29e-18 | 3.74e-18 | 122 |
| hsa04932210 | Esophagus | ESCC | Non-alcoholic fatty liver disease | 122/4205 | 155/8465 | 5.69e-14 | 1.59e-12 | 8.14e-13 | 122 |
| hsa0466810 | Esophagus | ESCC | TNF signaling pathway | 89/4205 | 114/8465 | 3.36e-10 | 4.01e-09 | 2.06e-09 | 89 |
| hsa0516425 | Esophagus | ESCC | Influenza A | 122/4205 | 171/8465 | 5.01e-09 | 4.79e-08 | 2.45e-08 | 122 |
| hsa051609 | Esophagus | ESCC | Hepatitis C | 107/4205 | 157/8465 | 1.75e-06 | 1.08e-05 | 5.55e-06 | 107 |
| hsa049109 | Esophagus | ESCC | Insulin signaling pathway | 89/4205 | 137/8465 | 1.97e-04 | 7.32e-04 | 3.75e-04 | 89 |
| hsa049318 | Esophagus | ESCC | Insulin resistance | 69/4205 | 108/8465 | 1.92e-03 | 5.54e-03 | 2.84e-03 | 69 |
| hsa0412036 | Esophagus | ESCC | Ubiquitin mediated proteolysis | 122/4205 | 142/8465 | 6.53e-20 | 7.29e-18 | 3.74e-18 | 122 |
| hsa0493238 | Esophagus | ESCC | Non-alcoholic fatty liver disease | 122/4205 | 155/8465 | 5.69e-14 | 1.59e-12 | 8.14e-13 | 122 |
| hsa0466817 | Esophagus | ESCC | TNF signaling pathway | 89/4205 | 114/8465 | 3.36e-10 | 4.01e-09 | 2.06e-09 | 89 |
| Page: 1 2 3 4 5 6 7 |
Top |
Cell-cell communication analysis |
| Identification of potential cell-cell interactions between two cell types and their ligand-receptor pairs for different disease states |
| Ligand | Receptor | LRpair | Pathway | Tissue | Disease Stage |
| Page: 1 |
Top |
Single-cell gene regulatory network inference analysis |
| Find out the significant the regulons (TFs) and the target genes of each regulon across cell types for different disease states |
| TF | Cell Type | Tissue | Disease Stage | Target Gene | RSS | Regulon Activity |
| ∗The dot plots of a searched regulon are shown for all cell subpopulations in each disease state of each tissue based on the regulon specific score inferred using pySCENIC and by calculating the average expression. |
| Page: 1 |
Top |
Somatic mutation of malignant transformation related genes |
| Annotation of somatic variants for genes involved in malignant transformation |
| Hugo Symbol | Variant Class | Variant Classification | dbSNP RS | HGVSc | HGVSp | HGVSp Short | SWISSPROT | BIOTYPE | SIFT | PolyPhen | Tumor Sample Barcode | Tissue | Histology | Sex | Age | Stage | Therapy Types | Drugs | Outcome |
| SOCS3 | SNV | Missense_Mutation | rs866275313 | c.385N>T | p.Pro129Ser | p.P129S | O14543 | protein_coding | tolerated(0.35) | benign(0.007) | TCGA-2W-A8YY-01 | Cervix | cervical & endocervical cancer | Female | <65 | I/II | Chemotherapy | cisplatin | CR |
| SOCS3 | SNV | Missense_Mutation | novel | c.22N>A | p.Pro8Thr | p.P8T | O14543 | protein_coding | tolerated(0.17) | benign(0.045) | TCGA-VS-A9V1-01 | Cervix | cervical & endocervical cancer | Female | <65 | I/II | Chemotherapy | cisplatin | PD |
| SOCS3 | deletion | Frame_Shift_Del | novel | c.347_354delNNNNNNNN | p.Arg116LeufsTer24 | p.R116Lfs*24 | O14543 | protein_coding | TCGA-C5-A7UH-01 | Cervix | cervical & endocervical cancer | Female | <65 | III/IV | Chemotherapy | cisplatin | SD | ||
| SOCS3 | insertion | Frame_Shift_Ins | novel | c.299dupG | p.Ser101GlnfsTer42 | p.S101Qfs*42 | O14543 | protein_coding | TCGA-EA-A43B-01 | Cervix | cervical & endocervical cancer | Female | <65 | I/II | Chemotherapy | cisplatin | CR | ||
| SOCS3 | SNV | Missense_Mutation | c.160N>A | p.Gly54Ser | p.G54S | O14543 | protein_coding | tolerated(0.44) | benign(0.055) | TCGA-A6-6653-01 | Colorectum | colon adenocarcinoma | Male | >=65 | I/II | Unknown | Unknown | SD | |
| SOCS3 | SNV | Missense_Mutation | c.281N>A | p.Arg94His | p.R94H | O14543 | protein_coding | deleterious(0) | probably_damaging(0.994) | TCGA-A6-6781-01 | Colorectum | colon adenocarcinoma | Male | <65 | III/IV | Chemotherapy | oxaliplatin | SD | |
| SOCS3 | SNV | Missense_Mutation | c.82A>C | p.Lys28Gln | p.K28Q | O14543 | protein_coding | tolerated(0.15) | benign(0.312) | TCGA-AA-3663-01 | Colorectum | colon adenocarcinoma | Male | <65 | I/II | Unknown | Unknown | SD | |
| SOCS3 | SNV | Missense_Mutation | rs780147259 | c.589N>A | p.Val197Ile | p.V197I | O14543 | protein_coding | tolerated(0.2) | possibly_damaging(0.739) | TCGA-AZ-6601-01 | Colorectum | colon adenocarcinoma | Male | >=65 | I/II | Unknown | Unknown | PD |
| SOCS3 | deletion | Frame_Shift_Del | c.299delG | p.Gly100AlafsTer79 | p.G100Afs*79 | O14543 | protein_coding | TCGA-AA-3663-01 | Colorectum | colon adenocarcinoma | Male | <65 | I/II | Unknown | Unknown | SD | |||
| SOCS3 | deletion | Frame_Shift_Del | c.299delN | p.Gly100AlafsTer79 | p.G100Afs*79 | O14543 | protein_coding | TCGA-AA-3950-01 | Colorectum | colon adenocarcinoma | Female | >=65 | I/II | Unknown | Unknown | SD |
| Page: 1 2 3 |
Top |
Related drugs of malignant transformation related genes |
| Identification of chemicals and drugs interact with genes involved in malignant transfromation |
| (DGIdb 4.0) |
| Entrez ID | Symbol | Category | Interaction Types | Drug Claim Name | Drug Name | PMIDs |
| 9021 | SOCS3 | KINASE, CLINICALLY ACTIONABLE | ANTISENSE OLIGONUCLEOTIDES | 15939448 |
| Page: 1 |

Copyright 2023-Present -The University of Texas Health Science Center at Houston |