
|
|||||
|
 | |
| |
| |
| |
| |
| |
|
Gene: SNX9 |
Gene summary for SNX9 |
| Gene information | Species | Human | Gene symbol | SNX9 | Gene ID | 51429 |
| Gene name | sorting nexin 9 | |
| Gene Alias | SDP1 | |
| Cytomap | 6q25.3 | |
| Gene Type | protein-coding | GO ID | GO:0000278 | UniProtAcc | Q9Y5X1 |
Top |
Malignant transformation analysis |
| Identification of the aberrant gene expression in precancerous and cancerous lesions by comparing the gene expression of stem-like cells in diseased tissues with normal stem cells |
| Entrez ID | Symbol | Replicates | Species | Organ | Tissue | Adj P-value | Log2FC | Malignancy |
| 51429 | SNX9 | HTA11_3410_2000001011 | Human | Colorectum | AD | 1.03e-06 | -4.06e-01 | 0.0155 |
| 51429 | SNX9 | HTA11_347_2000001011 | Human | Colorectum | AD | 1.48e-07 | 4.04e-01 | -0.1954 |
| 51429 | SNX9 | HTA11_411_2000001011 | Human | Colorectum | SER | 3.06e-04 | 9.10e-01 | -0.2602 |
| 51429 | SNX9 | HTA11_2112_2000001011 | Human | Colorectum | SER | 4.11e-02 | 5.69e-01 | -0.2196 |
| 51429 | SNX9 | HTA11_99999974143_84620 | Human | Colorectum | MSS | 1.06e-06 | -3.90e-01 | 0.3005 |
| 51429 | SNX9 | A015-C-203 | Human | Colorectum | FAP | 2.85e-30 | -4.71e-01 | -0.1294 |
| 51429 | SNX9 | A015-C-204 | Human | Colorectum | FAP | 3.35e-03 | -2.68e-01 | -0.0228 |
| 51429 | SNX9 | A002-C-201 | Human | Colorectum | FAP | 8.45e-07 | -3.26e-01 | 0.0324 |
| 51429 | SNX9 | A002-C-203 | Human | Colorectum | FAP | 2.48e-05 | -1.12e-01 | 0.2786 |
| 51429 | SNX9 | A001-C-119 | Human | Colorectum | FAP | 2.54e-02 | -2.31e-01 | -0.1557 |
| 51429 | SNX9 | A001-C-108 | Human | Colorectum | FAP | 6.39e-17 | -2.93e-01 | -0.0272 |
| 51429 | SNX9 | A002-C-205 | Human | Colorectum | FAP | 1.72e-13 | -3.62e-01 | -0.1236 |
| 51429 | SNX9 | A001-C-104 | Human | Colorectum | FAP | 2.67e-03 | -1.32e-01 | 0.0184 |
| 51429 | SNX9 | A015-C-006 | Human | Colorectum | FAP | 9.54e-09 | -4.47e-01 | -0.0994 |
| 51429 | SNX9 | A015-C-106 | Human | Colorectum | FAP | 3.34e-14 | -2.90e-01 | -0.0511 |
| 51429 | SNX9 | A002-C-114 | Human | Colorectum | FAP | 1.56e-11 | -4.07e-01 | -0.1561 |
| 51429 | SNX9 | A015-C-104 | Human | Colorectum | FAP | 6.79e-31 | -4.52e-01 | -0.1899 |
| 51429 | SNX9 | A001-C-014 | Human | Colorectum | FAP | 2.87e-12 | -1.77e-01 | 0.0135 |
| 51429 | SNX9 | A002-C-016 | Human | Colorectum | FAP | 2.14e-19 | -2.85e-01 | 0.0521 |
| 51429 | SNX9 | A015-C-002 | Human | Colorectum | FAP | 6.73e-06 | -2.05e-01 | -0.0763 |
| Page: 1 2 3 4 5 6 7 8 9 |
| Tissue | Expression Dynamics | Abbreviation |
| Colorectum (GSE201348) |  | FAP: Familial adenomatous polyposis |
| CRC: Colorectal cancer | ||
| Colorectum (HTA11) |  | AD: Adenomas |
| SER: Sessile serrated lesions | ||
| MSI-H: Microsatellite-high colorectal cancer | ||
| MSS: Microsatellite stable colorectal cancer | ||
| Endometrium | 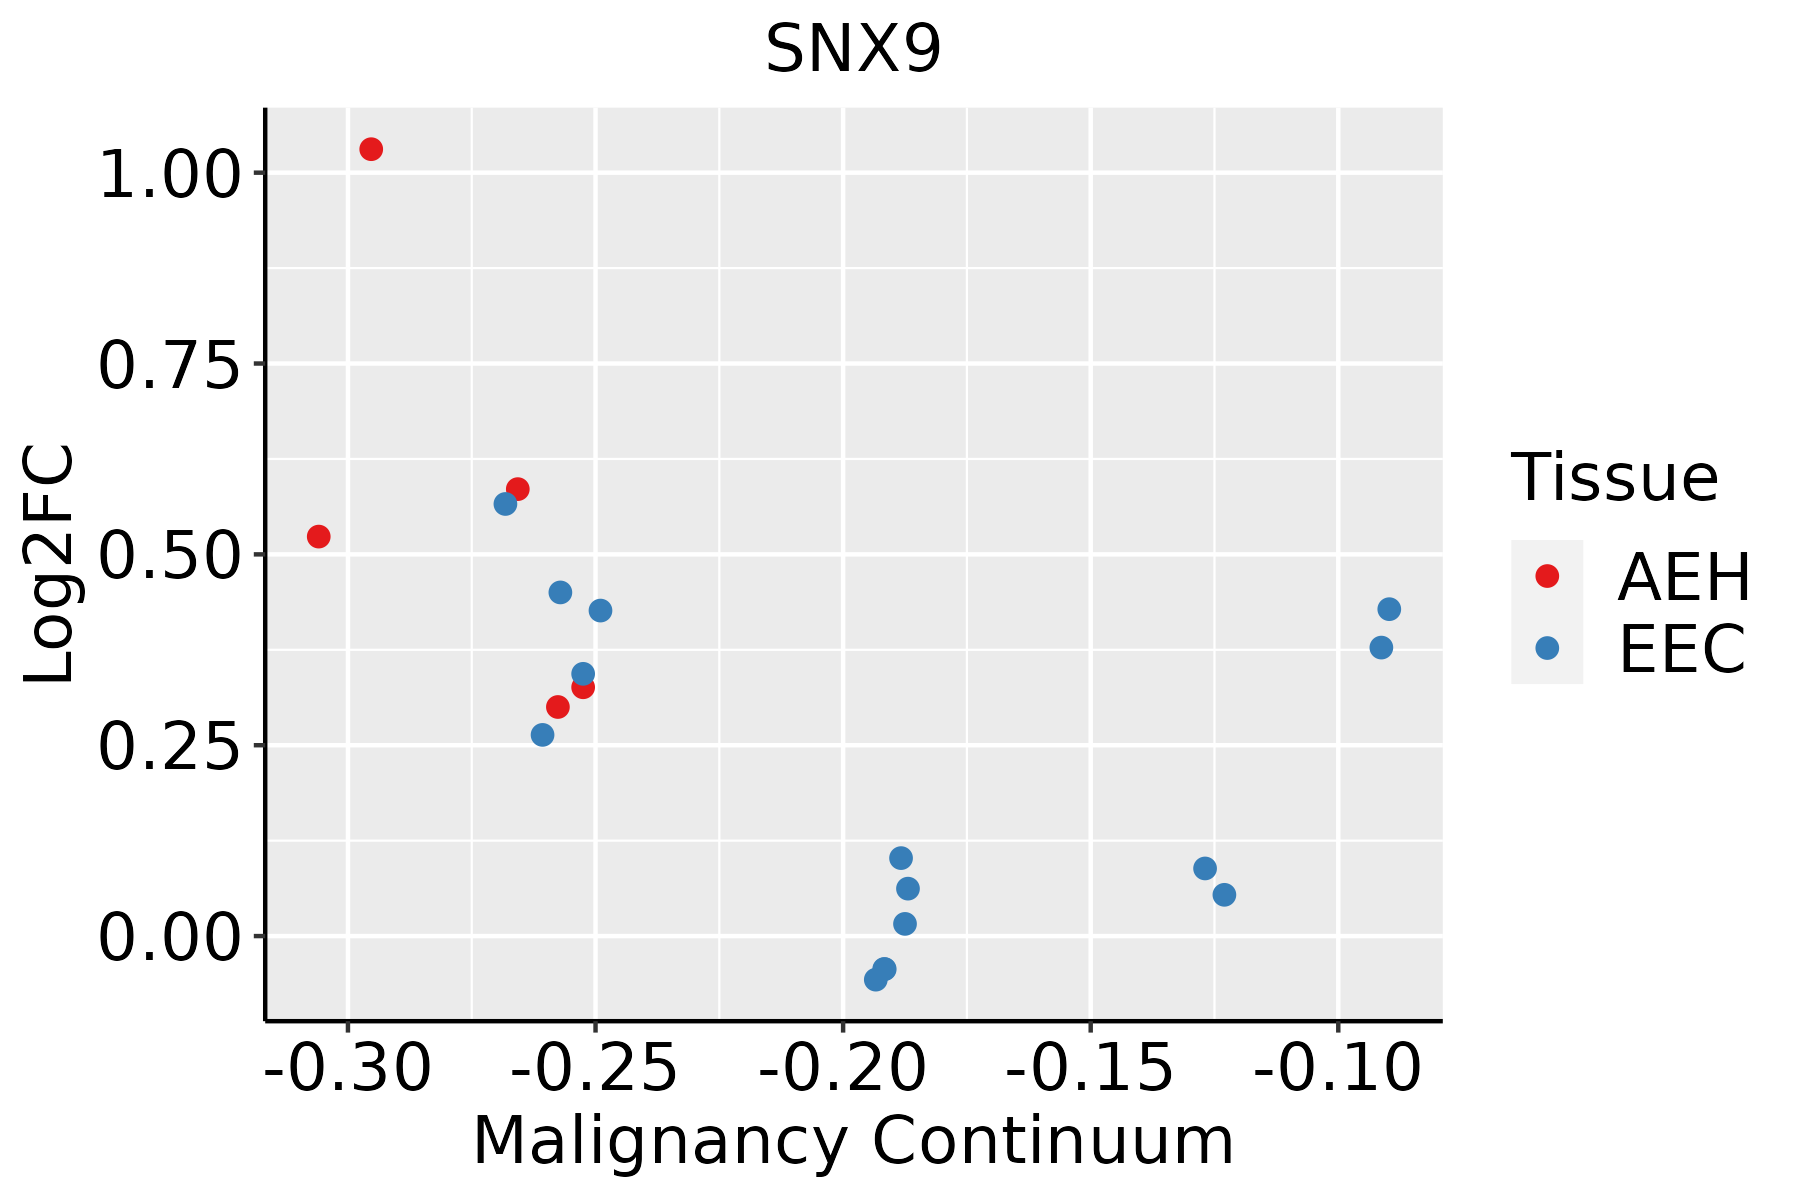 | AEH: Atypical endometrial hyperplasia |
| EEC: Endometrioid Cancer | ||
| Esophagus | 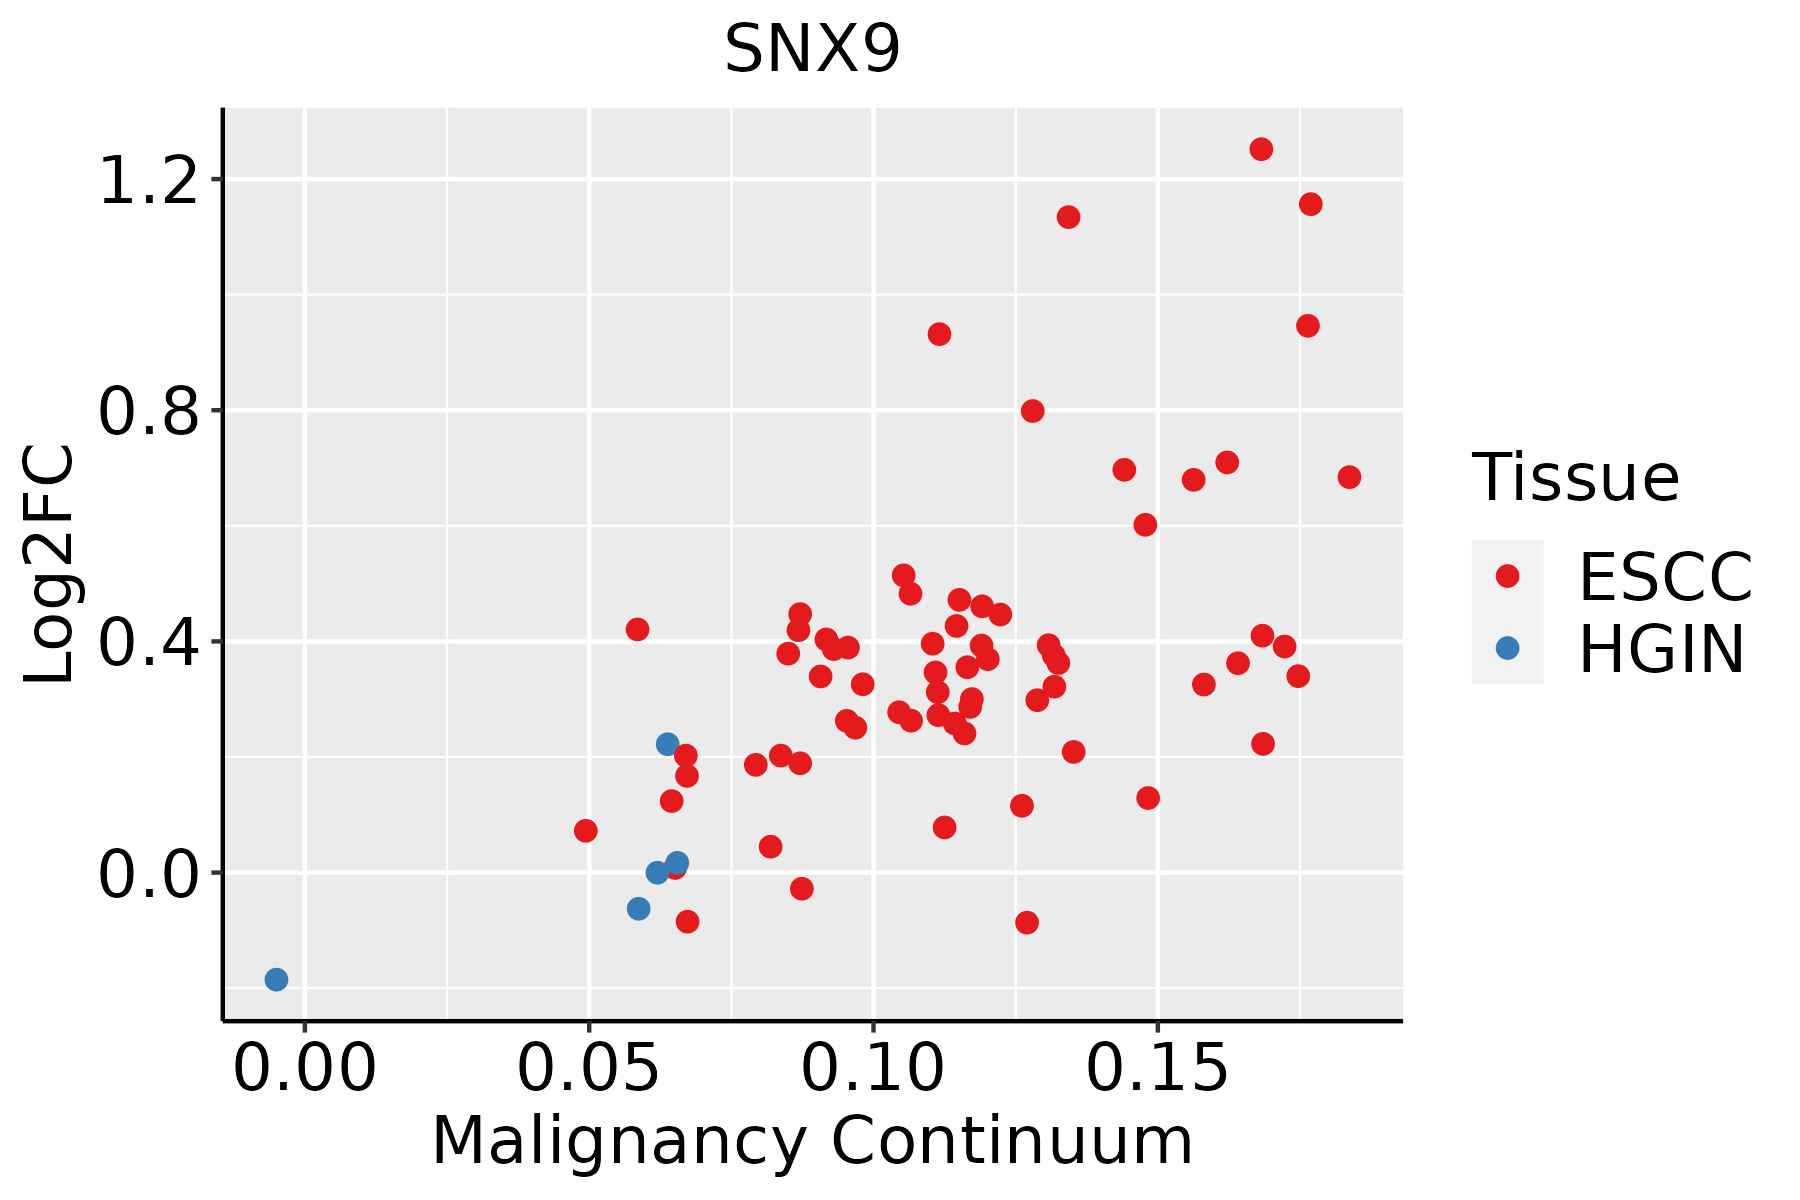 | ESCC: Esophageal squamous cell carcinoma |
| HGIN: High-grade intraepithelial neoplasias | ||
| LGIN: Low-grade intraepithelial neoplasias | ||
| Liver | 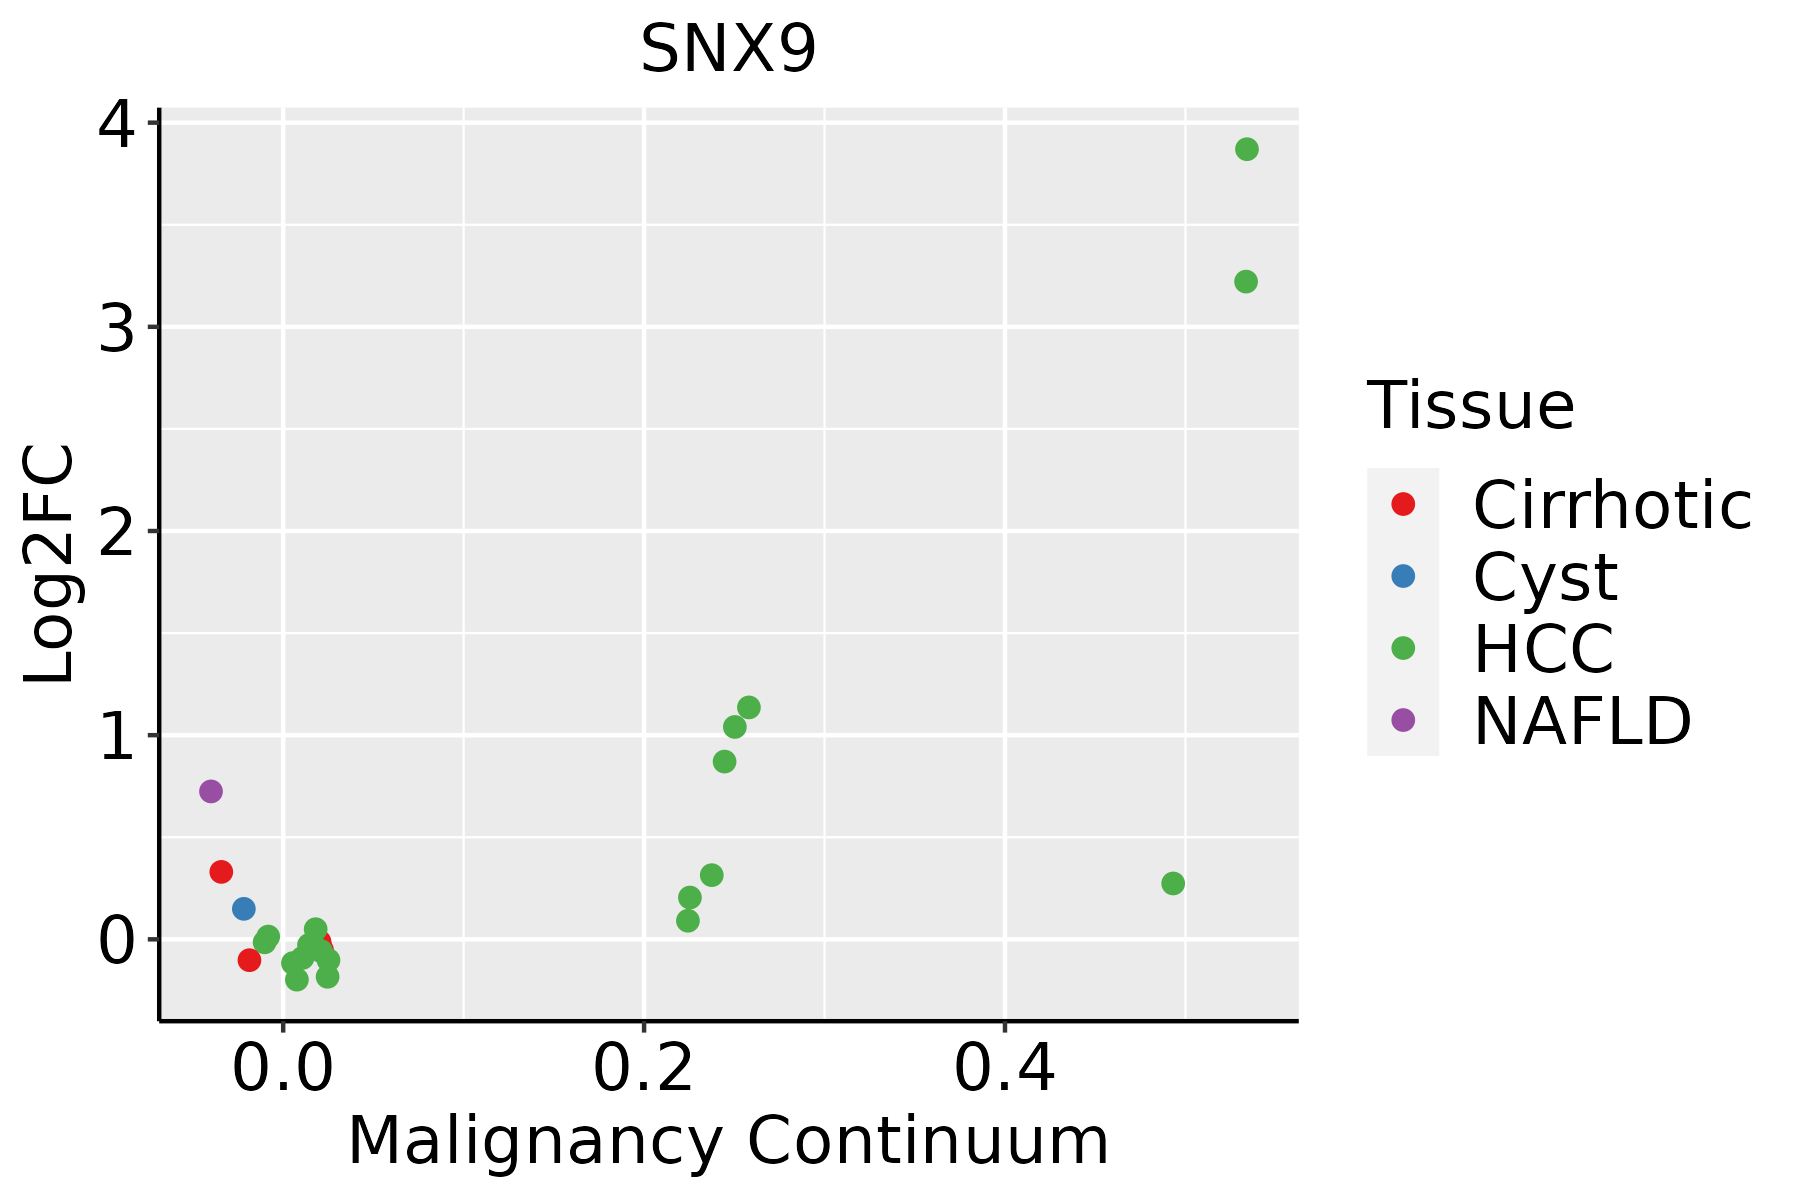 | HCC: Hepatocellular carcinoma |
| NAFLD: Non-alcoholic fatty liver disease | ||
| Lung | 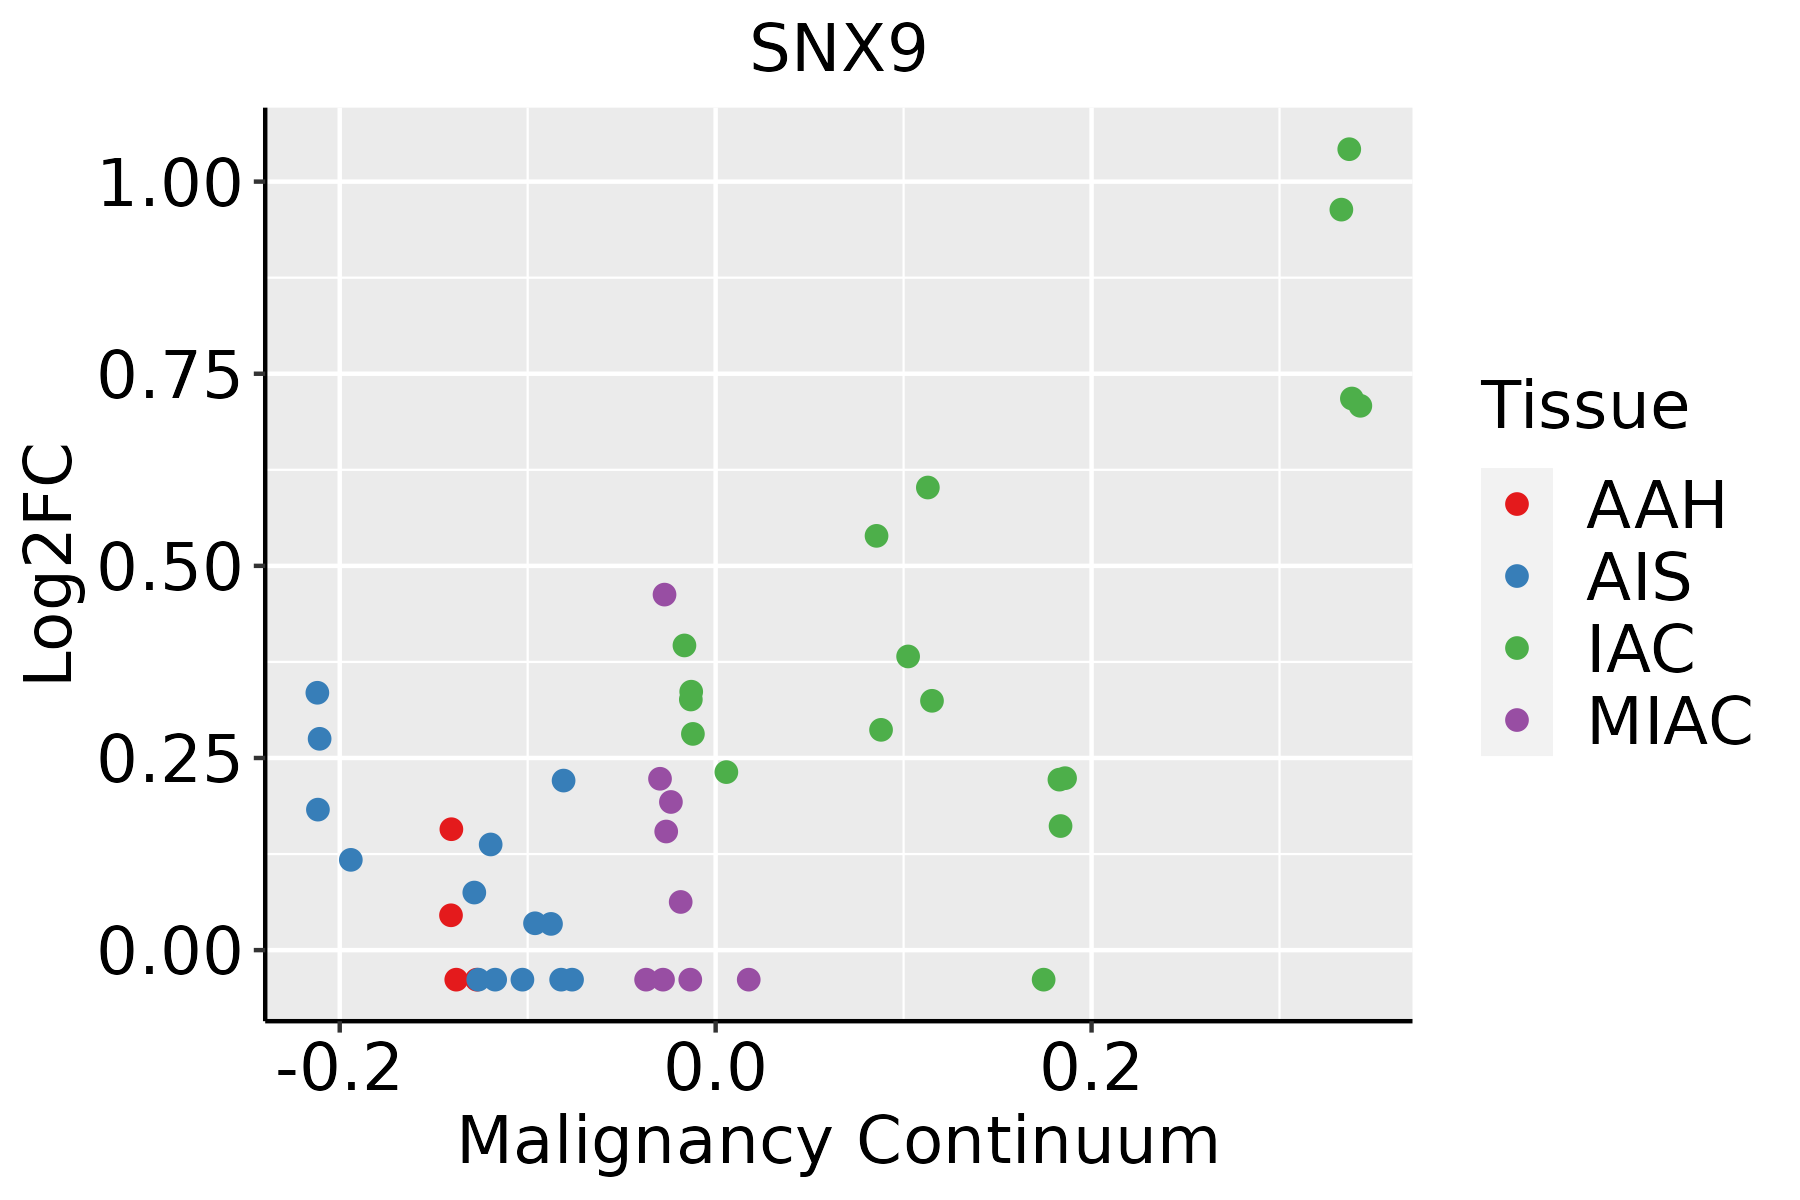 | AAH: Atypical adenomatous hyperplasia |
| AIS: Adenocarcinoma in situ | ||
| IAC: Invasive lung adenocarcinoma | ||
| MIA: Minimally invasive adenocarcinoma | ||
| Oral Cavity | 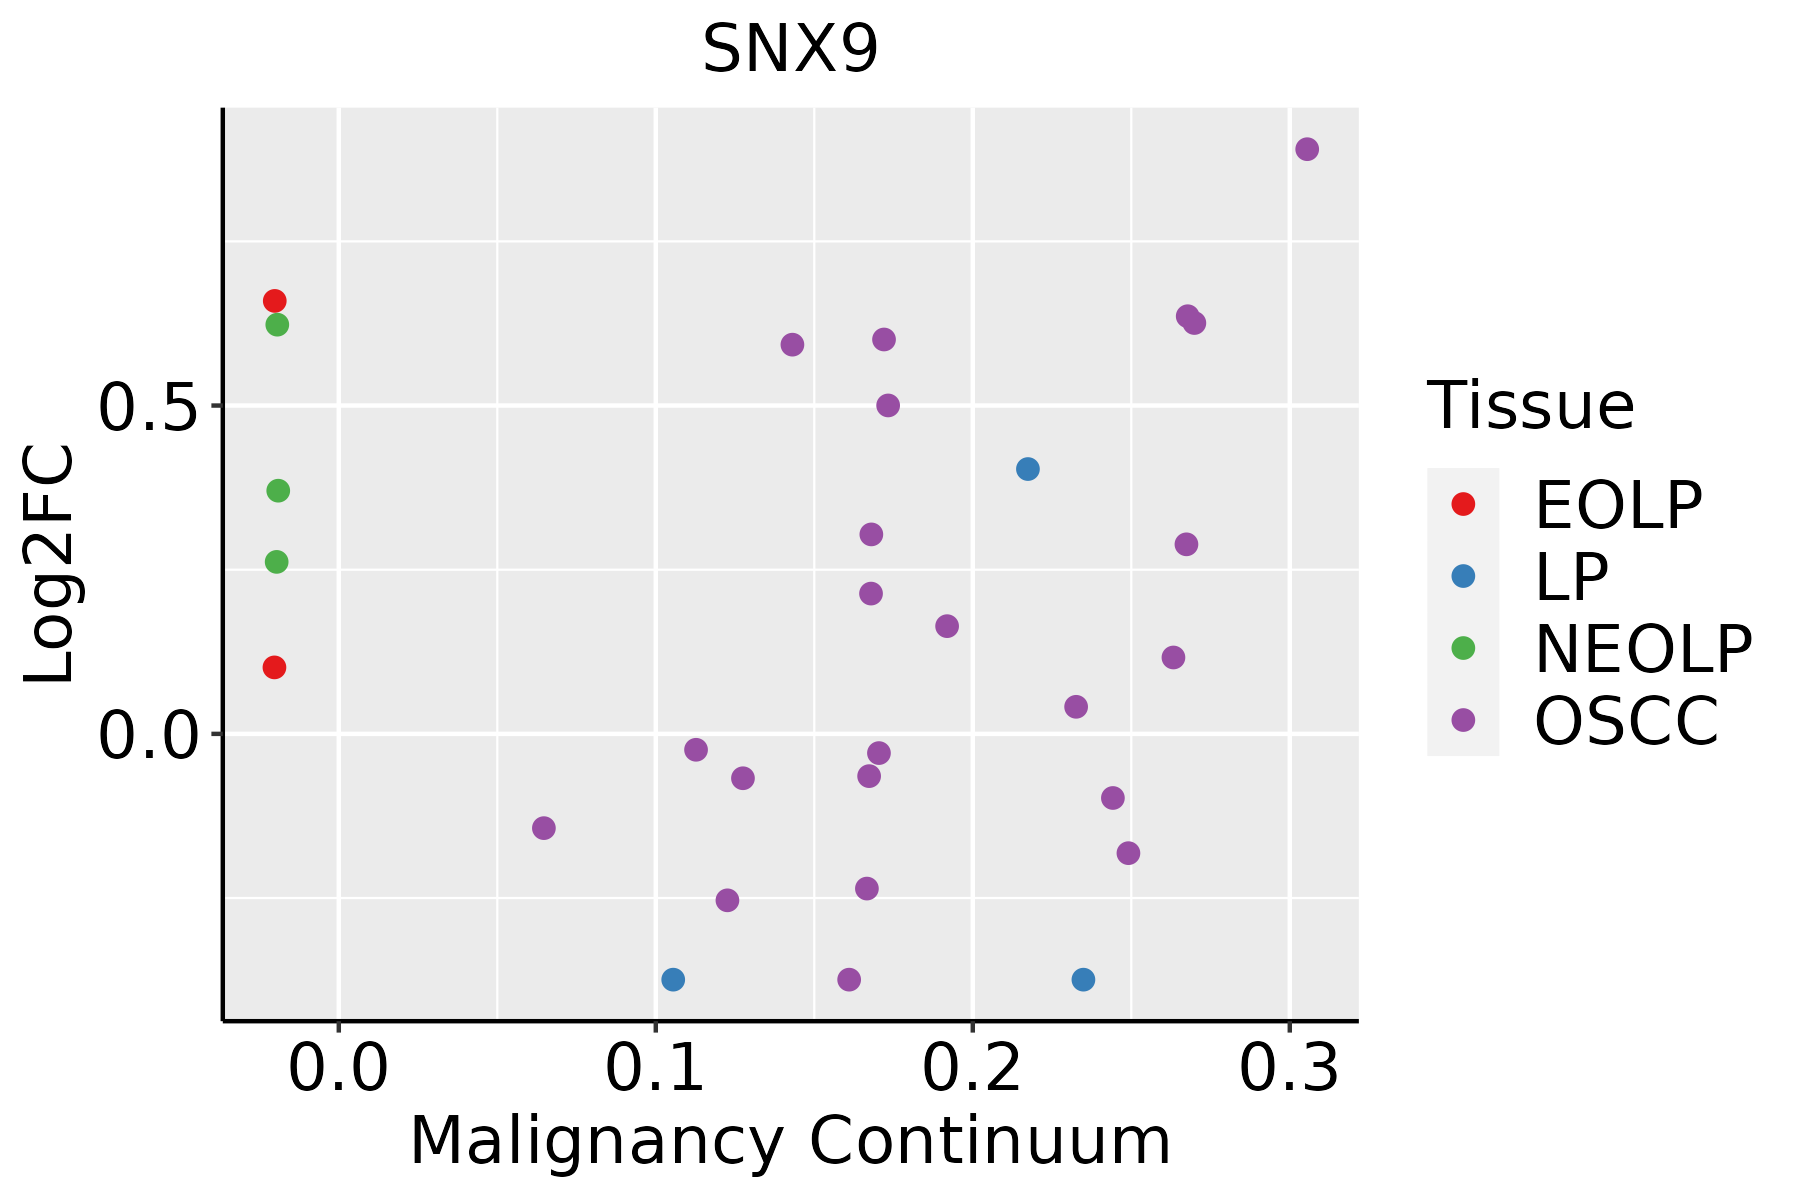 | EOLP: Erosive Oral lichen planus |
| LP: leukoplakia | ||
| NEOLP: Non-erosive oral lichen planus | ||
| OSCC: Oral squamous cell carcinoma | ||
| Prostate | 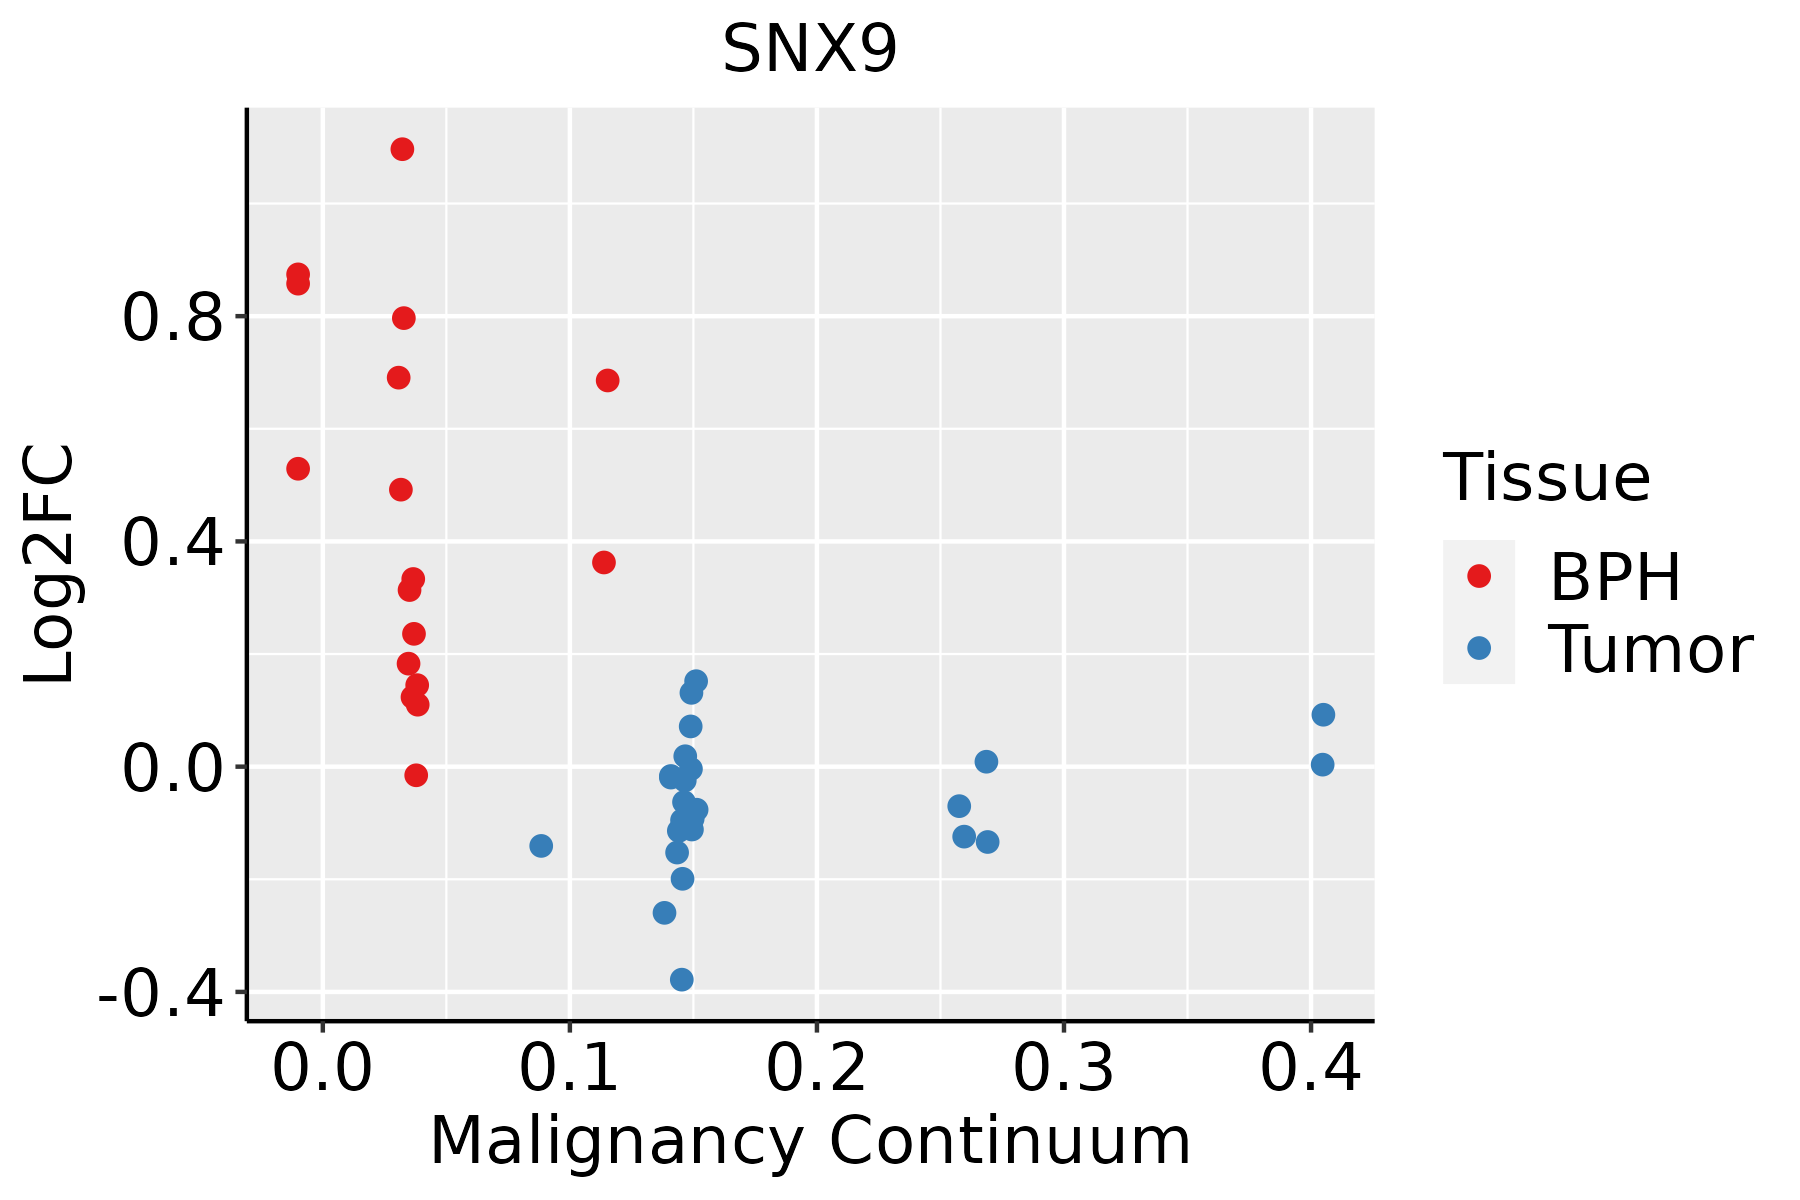 | BPH: Benign Prostatic Hyperplasia |
| Thyroid | 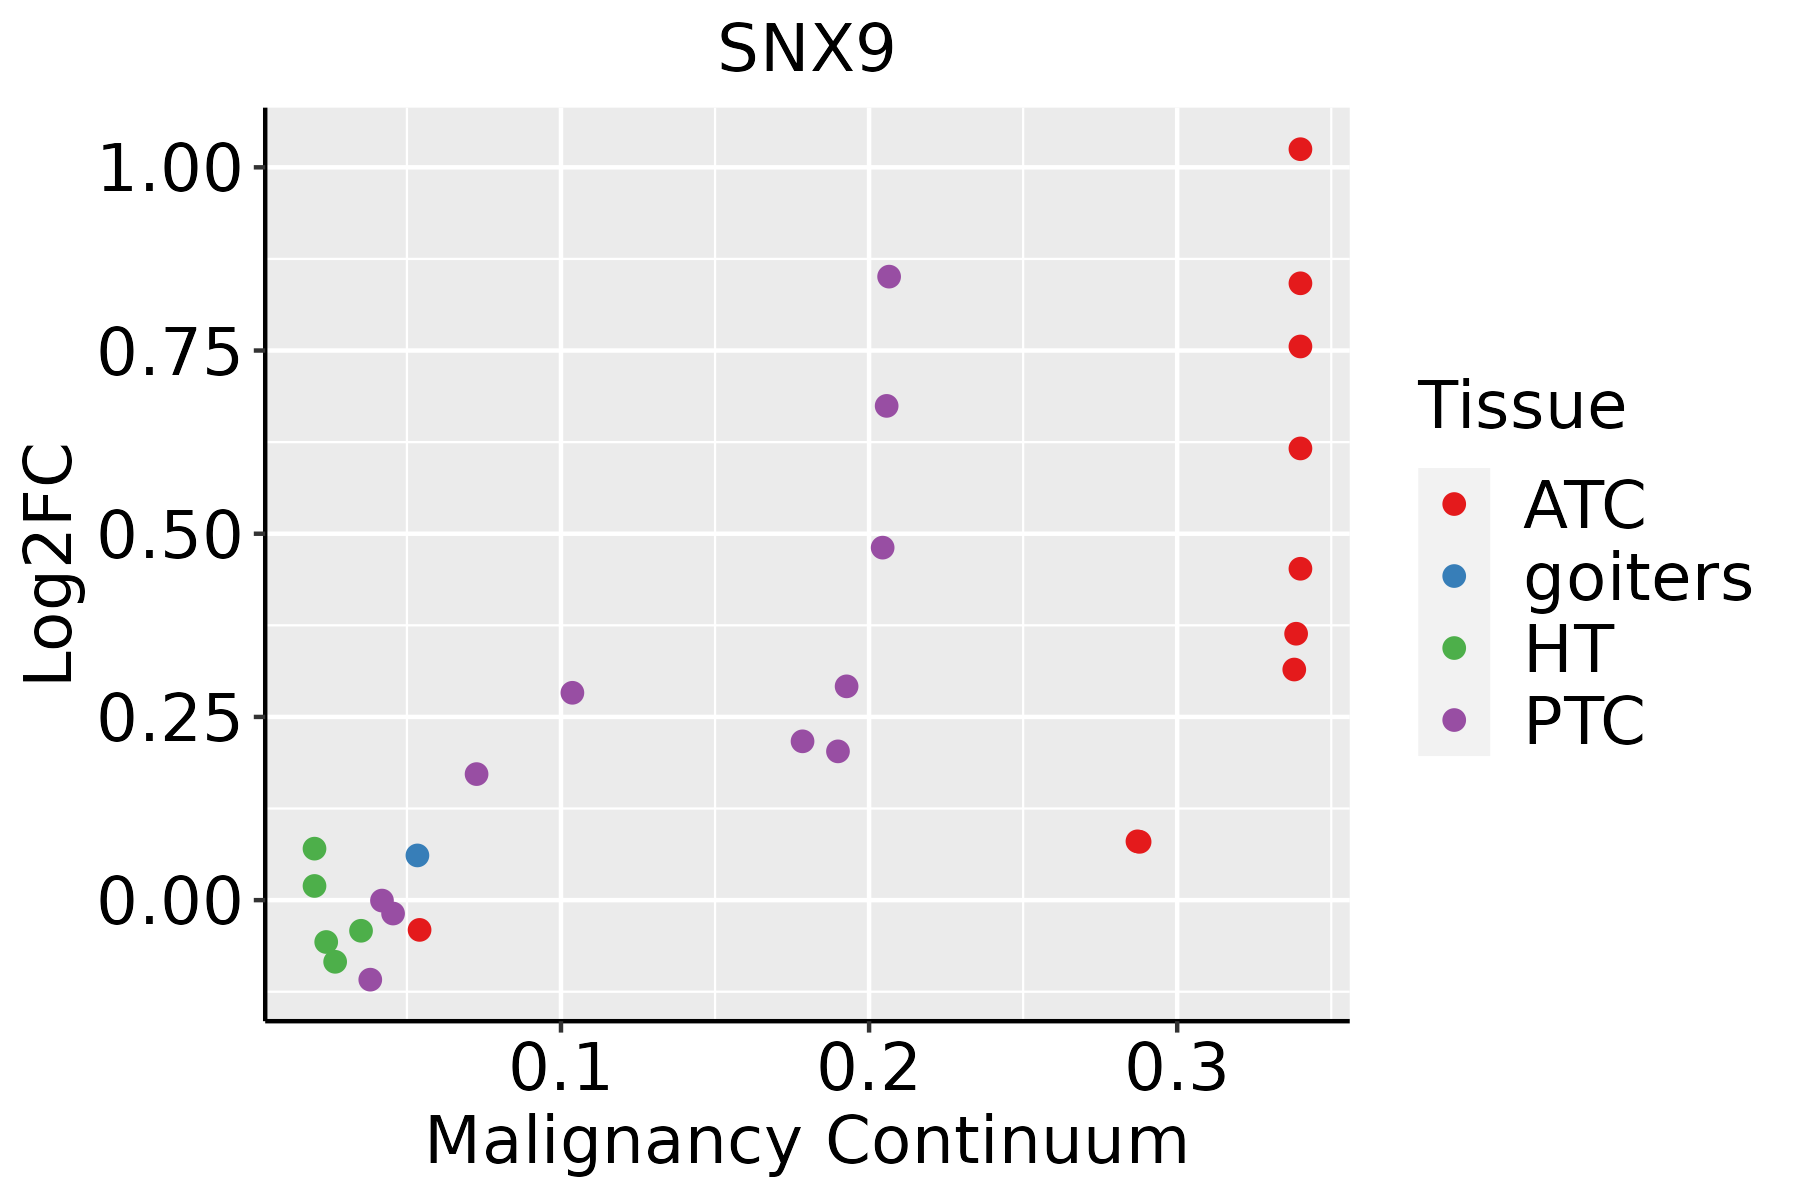 | ATC: Anaplastic thyroid cancer |
| HT: Hashimoto's thyroiditis | ||
| PTC: Papillary thyroid cancer |
| ∗log2FC in expression of this searched gene in stem-like cells from each diseased tissue sample relative to stem-like cells in normal samples in each tissue plotted against the malignancy continuum. Samples are colored based on if they are from different disease stage. |
Top |
Malignant transformation related pathway analysis |
| Find out the enriched GO biological processes and KEGG pathways involved in transition from healthy to precancer to cancer |
| Tissue | Disease Stage | Enriched GO biological Processes |
| Colorectum | AD |  |
| Colorectum | SER |  |
| Colorectum | MSS |  |
| Colorectum | MSI-H |  |
| Colorectum | FAP |  |
| ∗Top 15 enriched GO BP terms are showed in the bar plot of each disease state in each tissue. Each row represents a significant GO biological process which is colored according to the -log10(p.adjust). |
| Page: 1 2 3 4 5 6 7 8 9 |
| GO ID | Tissue | Disease Stage | Description | Gene Ratio | Bg Ratio | pvalue | p.adjust | Count |
| GO:00325062 | Colorectum | MSS | cytokinetic process | 14/3467 | 39/18723 | 7.79e-03 | 4.84e-02 | 14 |
| GO:0006509 | Colorectum | MSS | membrane protein ectodomain proteolysis | 15/3467 | 43/18723 | 8.06e-03 | 4.91e-02 | 15 |
| GO:00070154 | Colorectum | FAP | actin filament organization | 125/2622 | 442/18723 | 1.97e-15 | 3.03e-12 | 125 |
| GO:00098964 | Colorectum | FAP | positive regulation of catabolic process | 126/2622 | 492/18723 | 3.76e-12 | 2.56e-09 | 126 |
| GO:00421764 | Colorectum | FAP | regulation of protein catabolic process | 106/2622 | 391/18723 | 5.00e-12 | 3.06e-09 | 106 |
| GO:00329704 | Colorectum | FAP | regulation of actin filament-based process | 105/2622 | 397/18723 | 3.15e-11 | 1.38e-08 | 105 |
| GO:00313314 | Colorectum | FAP | positive regulation of cellular catabolic process | 110/2622 | 427/18723 | 6.09e-11 | 2.19e-08 | 110 |
| GO:00325353 | Colorectum | FAP | regulation of cellular component size | 99/2622 | 383/18723 | 4.53e-10 | 1.16e-07 | 99 |
| GO:01100534 | Colorectum | FAP | regulation of actin filament organization | 75/2622 | 278/18723 | 8.11e-09 | 1.10e-06 | 75 |
| GO:00329564 | Colorectum | FAP | regulation of actin cytoskeleton organization | 90/2622 | 358/18723 | 1.20e-08 | 1.39e-06 | 90 |
| GO:00432544 | Colorectum | FAP | regulation of protein-containing complex assembly | 101/2622 | 428/18723 | 5.18e-08 | 4.07e-06 | 101 |
| GO:19029034 | Colorectum | FAP | regulation of supramolecular fiber organization | 92/2622 | 383/18723 | 8.48e-08 | 5.77e-06 | 92 |
| GO:00081544 | Colorectum | FAP | actin polymerization or depolymerization | 60/2622 | 218/18723 | 1.15e-07 | 7.43e-06 | 60 |
| GO:00430873 | Colorectum | FAP | regulation of GTPase activity | 85/2622 | 348/18723 | 1.20e-07 | 7.68e-06 | 85 |
| GO:00322714 | Colorectum | FAP | regulation of protein polymerization | 62/2622 | 233/18723 | 2.64e-07 | 1.53e-05 | 62 |
| GO:19029054 | Colorectum | FAP | positive regulation of supramolecular fiber organization | 57/2622 | 209/18723 | 3.28e-07 | 1.83e-05 | 57 |
| GO:00457324 | Colorectum | FAP | positive regulation of protein catabolic process | 61/2622 | 231/18723 | 4.38e-07 | 2.35e-05 | 61 |
| GO:00514954 | Colorectum | FAP | positive regulation of cytoskeleton organization | 60/2622 | 226/18723 | 4.45e-07 | 2.37e-05 | 60 |
| GO:00300414 | Colorectum | FAP | actin filament polymerization | 53/2622 | 191/18723 | 4.65e-07 | 2.46e-05 | 53 |
| GO:00313344 | Colorectum | FAP | positive regulation of protein-containing complex assembly | 62/2622 | 237/18723 | 5.03e-07 | 2.61e-05 | 62 |
| Page: 1 2 3 4 5 6 7 8 9 10 11 12 13 14 15 16 17 18 19 20 21 22 23 24 25 26 27 28 29 30 31 32 33 34 35 36 |
| Pathway ID | Tissue | Disease Stage | Description | Gene Ratio | Bg Ratio | pvalue | p.adjust | qvalue | Count |
| hsa05132 | Colorectum | AD | Salmonella infection | 102/2092 | 249/8465 | 7.65e-09 | 1.28e-07 | 8.17e-08 | 102 |
| hsa051321 | Colorectum | AD | Salmonella infection | 102/2092 | 249/8465 | 7.65e-09 | 1.28e-07 | 8.17e-08 | 102 |
| hsa051322 | Colorectum | SER | Salmonella infection | 77/1580 | 249/8465 | 1.56e-06 | 2.35e-05 | 1.71e-05 | 77 |
| hsa051323 | Colorectum | SER | Salmonella infection | 77/1580 | 249/8465 | 1.56e-06 | 2.35e-05 | 1.71e-05 | 77 |
| hsa051328 | Colorectum | FAP | Salmonella infection | 67/1404 | 249/8465 | 2.04e-05 | 2.52e-04 | 1.53e-04 | 67 |
| hsa051329 | Colorectum | FAP | Salmonella infection | 67/1404 | 249/8465 | 2.04e-05 | 2.52e-04 | 1.53e-04 | 67 |
| hsa0513210 | Colorectum | CRC | Salmonella infection | 48/1091 | 249/8465 | 2.43e-03 | 1.69e-02 | 1.15e-02 | 48 |
| hsa0513211 | Colorectum | CRC | Salmonella infection | 48/1091 | 249/8465 | 2.43e-03 | 1.69e-02 | 1.15e-02 | 48 |
| hsa0513226 | Endometrium | AEH | Salmonella infection | 71/1197 | 249/8465 | 1.69e-09 | 3.44e-08 | 2.52e-08 | 71 |
| hsa05132112 | Endometrium | AEH | Salmonella infection | 71/1197 | 249/8465 | 1.69e-09 | 3.44e-08 | 2.52e-08 | 71 |
| hsa0513227 | Endometrium | EEC | Salmonella infection | 71/1237 | 249/8465 | 7.11e-09 | 1.30e-07 | 9.69e-08 | 71 |
| hsa0513236 | Endometrium | EEC | Salmonella infection | 71/1237 | 249/8465 | 7.11e-09 | 1.30e-07 | 9.69e-08 | 71 |
| hsa0513239 | Esophagus | HGIN | Salmonella infection | 69/1383 | 249/8465 | 3.02e-06 | 4.47e-05 | 3.55e-05 | 69 |
| hsa05132115 | Esophagus | HGIN | Salmonella infection | 69/1383 | 249/8465 | 3.02e-06 | 4.47e-05 | 3.55e-05 | 69 |
| hsa05132211 | Esophagus | ESCC | Salmonella infection | 191/4205 | 249/8465 | 6.51e-19 | 5.45e-17 | 2.79e-17 | 191 |
| hsa05132310 | Esophagus | ESCC | Salmonella infection | 191/4205 | 249/8465 | 6.51e-19 | 5.45e-17 | 2.79e-17 | 191 |
| hsa0513214 | Liver | NAFLD | Salmonella infection | 55/1043 | 249/8465 | 8.48e-06 | 3.09e-04 | 2.49e-04 | 55 |
| hsa0513215 | Liver | NAFLD | Salmonella infection | 55/1043 | 249/8465 | 8.48e-06 | 3.09e-04 | 2.49e-04 | 55 |
| hsa0513222 | Liver | Cirrhotic | Salmonella infection | 121/2530 | 249/8465 | 2.47e-10 | 5.13e-09 | 3.16e-09 | 121 |
| hsa0513232 | Liver | Cirrhotic | Salmonella infection | 121/2530 | 249/8465 | 2.47e-10 | 5.13e-09 | 3.16e-09 | 121 |
| Page: 1 2 |
Top |
Cell-cell communication analysis |
| Identification of potential cell-cell interactions between two cell types and their ligand-receptor pairs for different disease states |
| Ligand | Receptor | LRpair | Pathway | Tissue | Disease Stage |
| Page: 1 |
Top |
Single-cell gene regulatory network inference analysis |
| Find out the significant the regulons (TFs) and the target genes of each regulon across cell types for different disease states |
| TF | Cell Type | Tissue | Disease Stage | Target Gene | RSS | Regulon Activity |
| ∗The dot plots of a searched regulon are shown for all cell subpopulations in each disease state of each tissue based on the regulon specific score inferred using pySCENIC and by calculating the average expression. |
| Page: 1 |
Top |
Somatic mutation of malignant transformation related genes |
| Annotation of somatic variants for genes involved in malignant transformation |
| Hugo Symbol | Variant Class | Variant Classification | dbSNP RS | HGVSc | HGVSp | HGVSp Short | SWISSPROT | BIOTYPE | SIFT | PolyPhen | Tumor Sample Barcode | Tissue | Histology | Sex | Age | Stage | Therapy Types | Drugs | Outcome |
| SNX9 | SNV | Missense_Mutation | novel | c.1123G>A | p.Ala375Thr | p.A375T | Q9Y5X1 | protein_coding | deleterious(0.01) | benign(0.007) | TCGA-A2-A0CP-01 | Breast | breast invasive carcinoma | Female | <65 | I/II | Chemotherapy | cytoxan | SD |
| SNX9 | SNV | Missense_Mutation | c.1597G>C | p.Asp533His | p.D533H | Q9Y5X1 | protein_coding | deleterious(0.04) | probably_damaging(1) | TCGA-AC-A23H-01 | Breast | breast invasive carcinoma | Female | >=65 | I/II | Unknown | Unknown | PD | |
| SNX9 | SNV | Missense_Mutation | c.28G>A | p.Asp10Asn | p.D10N | Q9Y5X1 | protein_coding | tolerated(0.07) | benign(0.092) | TCGA-AN-A046-01 | Breast | breast invasive carcinoma | Female | >=65 | I/II | Unknown | Unknown | SD | |
| SNX9 | insertion | Nonsense_Mutation | novel | c.205_206insAGTTTAAATAGATTTTTTTAAGTGCATATCTCAGTTC | p.Ser69Ter | p.S69* | Q9Y5X1 | protein_coding | TCGA-B6-A0IK-01 | Breast | breast invasive carcinoma | Female | <65 | III/IV | Unknown | Unknown | PD | ||
| SNX9 | SNV | Missense_Mutation | c.28N>C | p.Asp10His | p.D10H | Q9Y5X1 | protein_coding | deleterious(0) | probably_damaging(0.949) | TCGA-EK-A2RC-01 | Cervix | cervical & endocervical cancer | Female | <65 | I/II | Unknown | Unknown | SD | |
| SNX9 | SNV | Missense_Mutation | c.1757N>T | p.Arg586Met | p.R586M | Q9Y5X1 | protein_coding | deleterious(0) | possibly_damaging(0.857) | TCGA-AA-3864-01 | Colorectum | colon adenocarcinoma | Male | >=65 | I/II | Unknown | Unknown | SD | |
| SNX9 | SNV | Missense_Mutation | novel | c.1005G>A | p.Met335Ile | p.M335I | Q9Y5X1 | protein_coding | deleterious(0) | possibly_damaging(0.793) | TCGA-D5-6539-01 | Colorectum | colon adenocarcinoma | Female | <65 | I/II | Unknown | Unknown | SD |
| SNX9 | SNV | Missense_Mutation | novel | c.700N>T | p.Ile234Phe | p.I234F | Q9Y5X1 | protein_coding | deleterious(0) | possibly_damaging(0.905) | TCGA-AG-3726-01 | Colorectum | rectum adenocarcinoma | Female | <65 | I/II | Unknown | Unknown | SD |
| SNX9 | SNV | Missense_Mutation | novel | c.1205N>G | p.Val402Gly | p.V402G | Q9Y5X1 | protein_coding | deleterious(0) | probably_damaging(0.939) | TCGA-AG-A002-01 | Colorectum | rectum adenocarcinoma | Male | <65 | I/II | Unknown | Unknown | SD |
| SNX9 | SNV | Missense_Mutation | novel | c.502N>A | p.Asp168Asn | p.D168N | Q9Y5X1 | protein_coding | tolerated(0.45) | possibly_damaging(0.678) | TCGA-AG-A01N-01 | Colorectum | rectum adenocarcinoma | Female | >=65 | III/IV | Chemotherapy | capecitabine | SD |
| Page: 1 2 3 4 5 |
Top |
Related drugs of malignant transformation related genes |
| Identification of chemicals and drugs interact with genes involved in malignant transfromation |
| (DGIdb 4.0) |
| Entrez ID | Symbol | Category | Interaction Types | Drug Claim Name | Drug Name | PMIDs |
| Page: 1 |

Copyright 2023-Present -The University of Texas Health Science Center at Houston |