| Tissue | Expression Dynamics | Abbreviation |
| Breast | 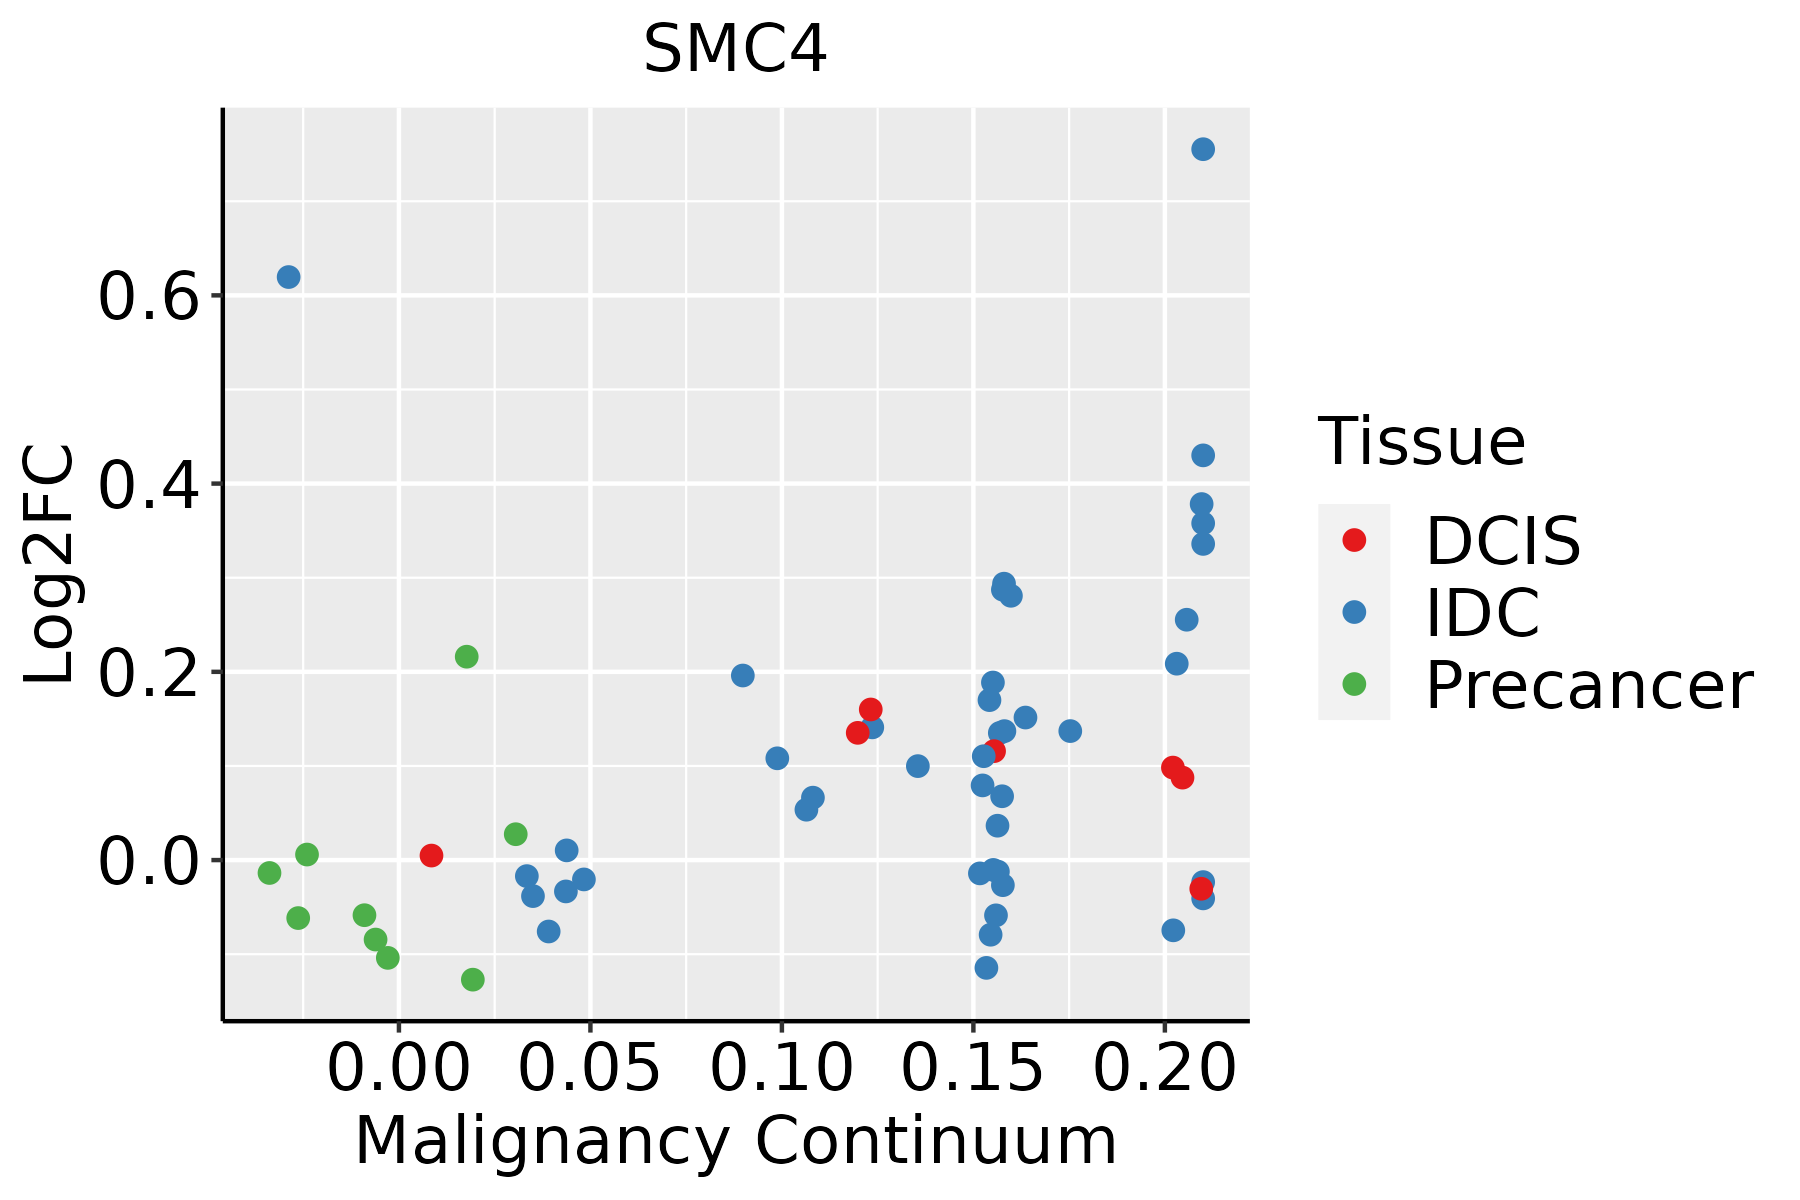 | IDC: Invasive ductal carcinoma |
| DCIS: Ductal carcinoma in situ |
| Precancer(BRCA1-mut): Precancerous lesion from BRCA1 mutation carriers |
| Cervix | 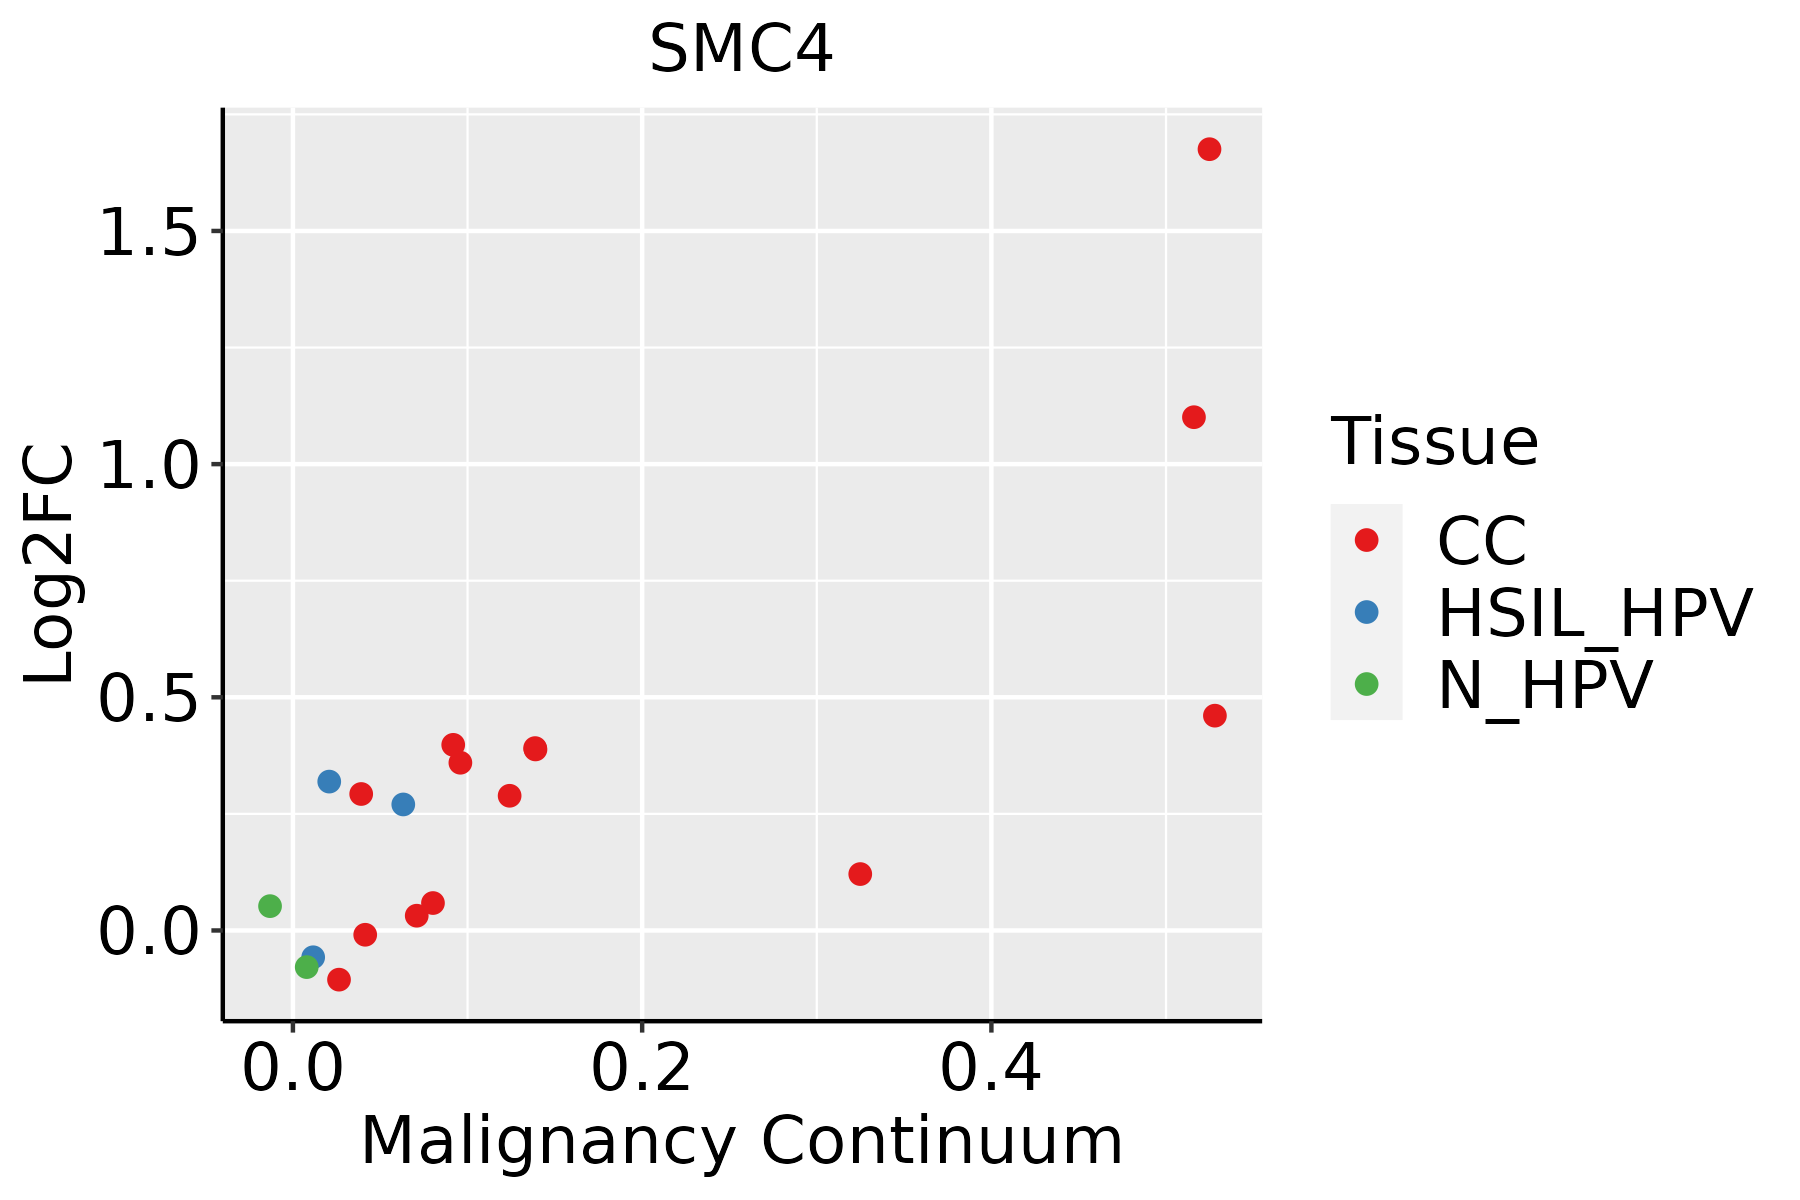 | CC: Cervix cancer |
| HSIL_HPV: HPV-infected high-grade squamous intraepithelial lesions |
| N_HPV: HPV-infected normal cervix |
| Esophagus | 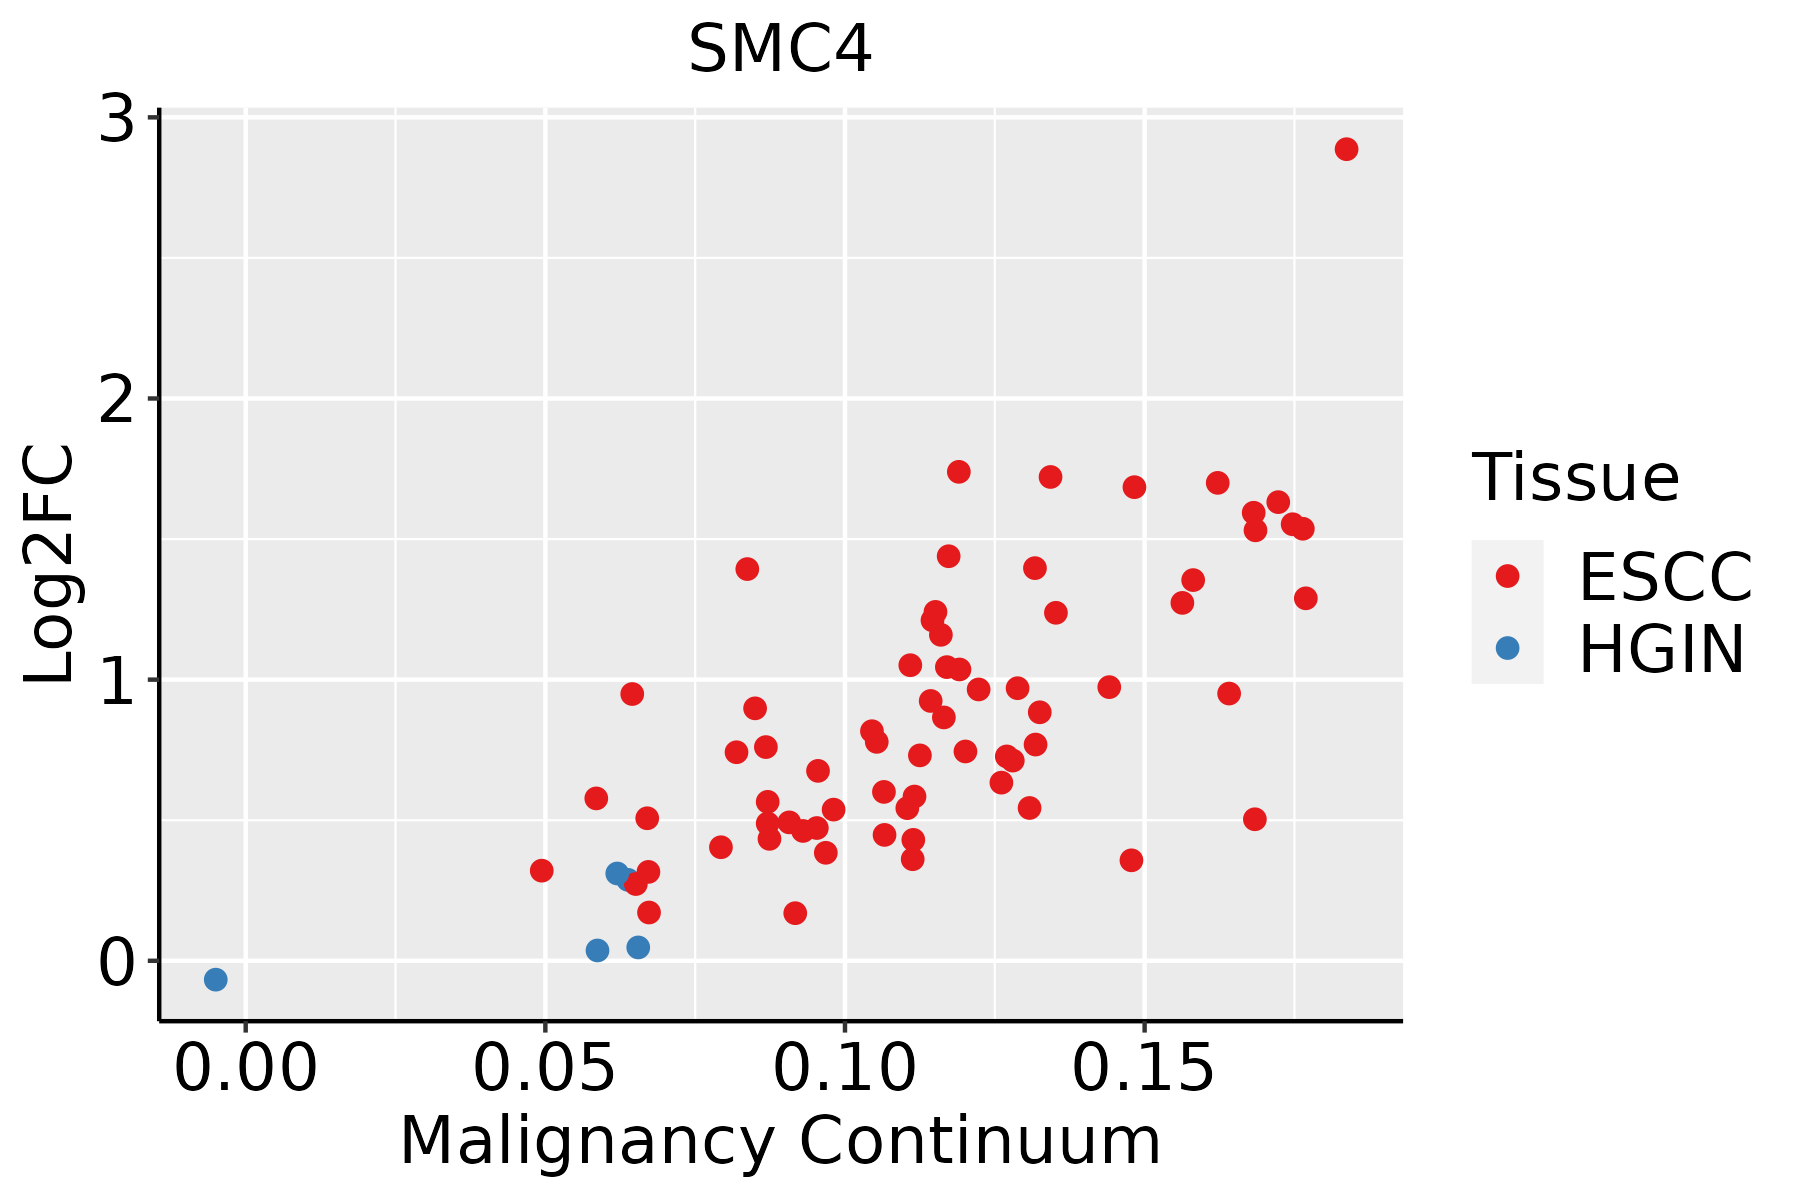 | ESCC: Esophageal squamous cell carcinoma |
| HGIN: High-grade intraepithelial neoplasias |
| LGIN: Low-grade intraepithelial neoplasias |
| Liver | 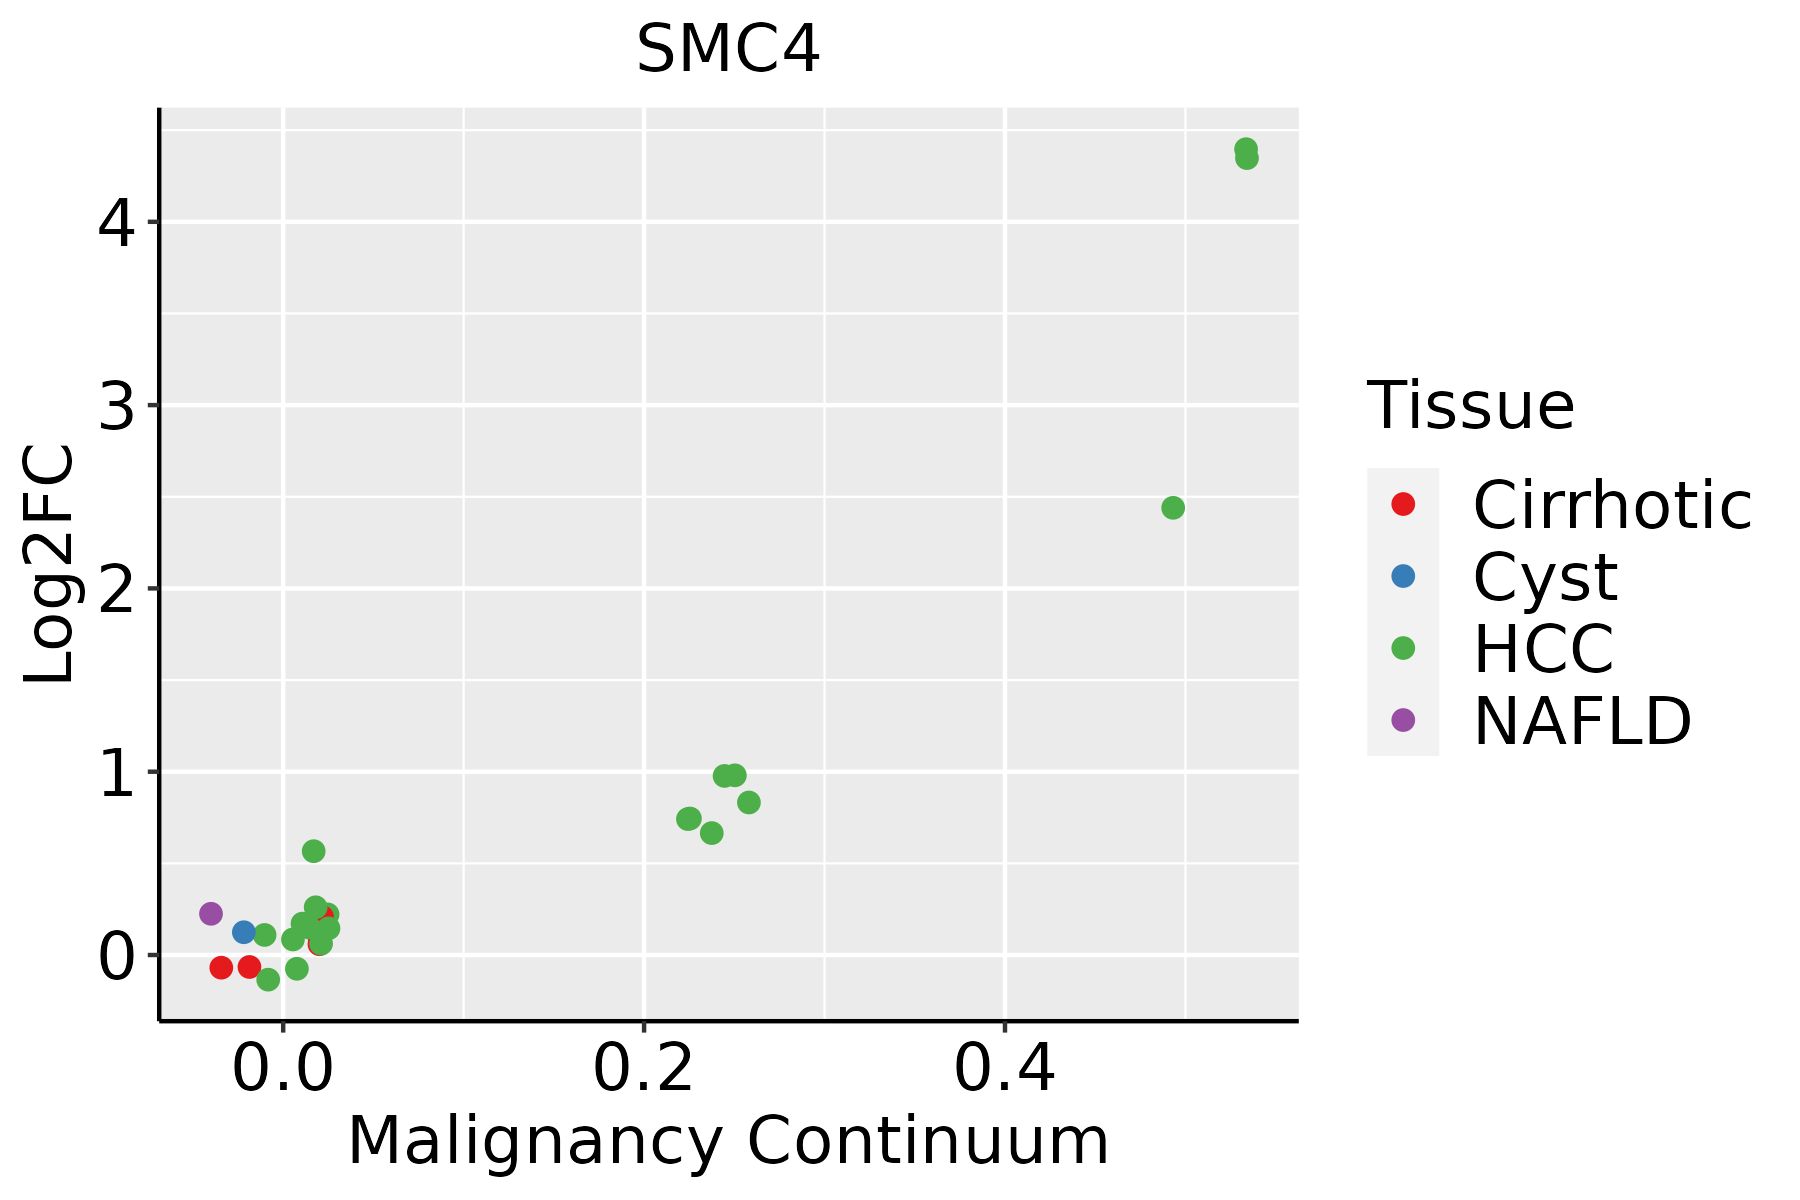 | HCC: Hepatocellular carcinoma |
| NAFLD: Non-alcoholic fatty liver disease |
| Oral Cavity |  | EOLP: Erosive Oral lichen planus |
| LP: leukoplakia |
| NEOLP: Non-erosive oral lichen planus |
| OSCC: Oral squamous cell carcinoma |
| Skin | 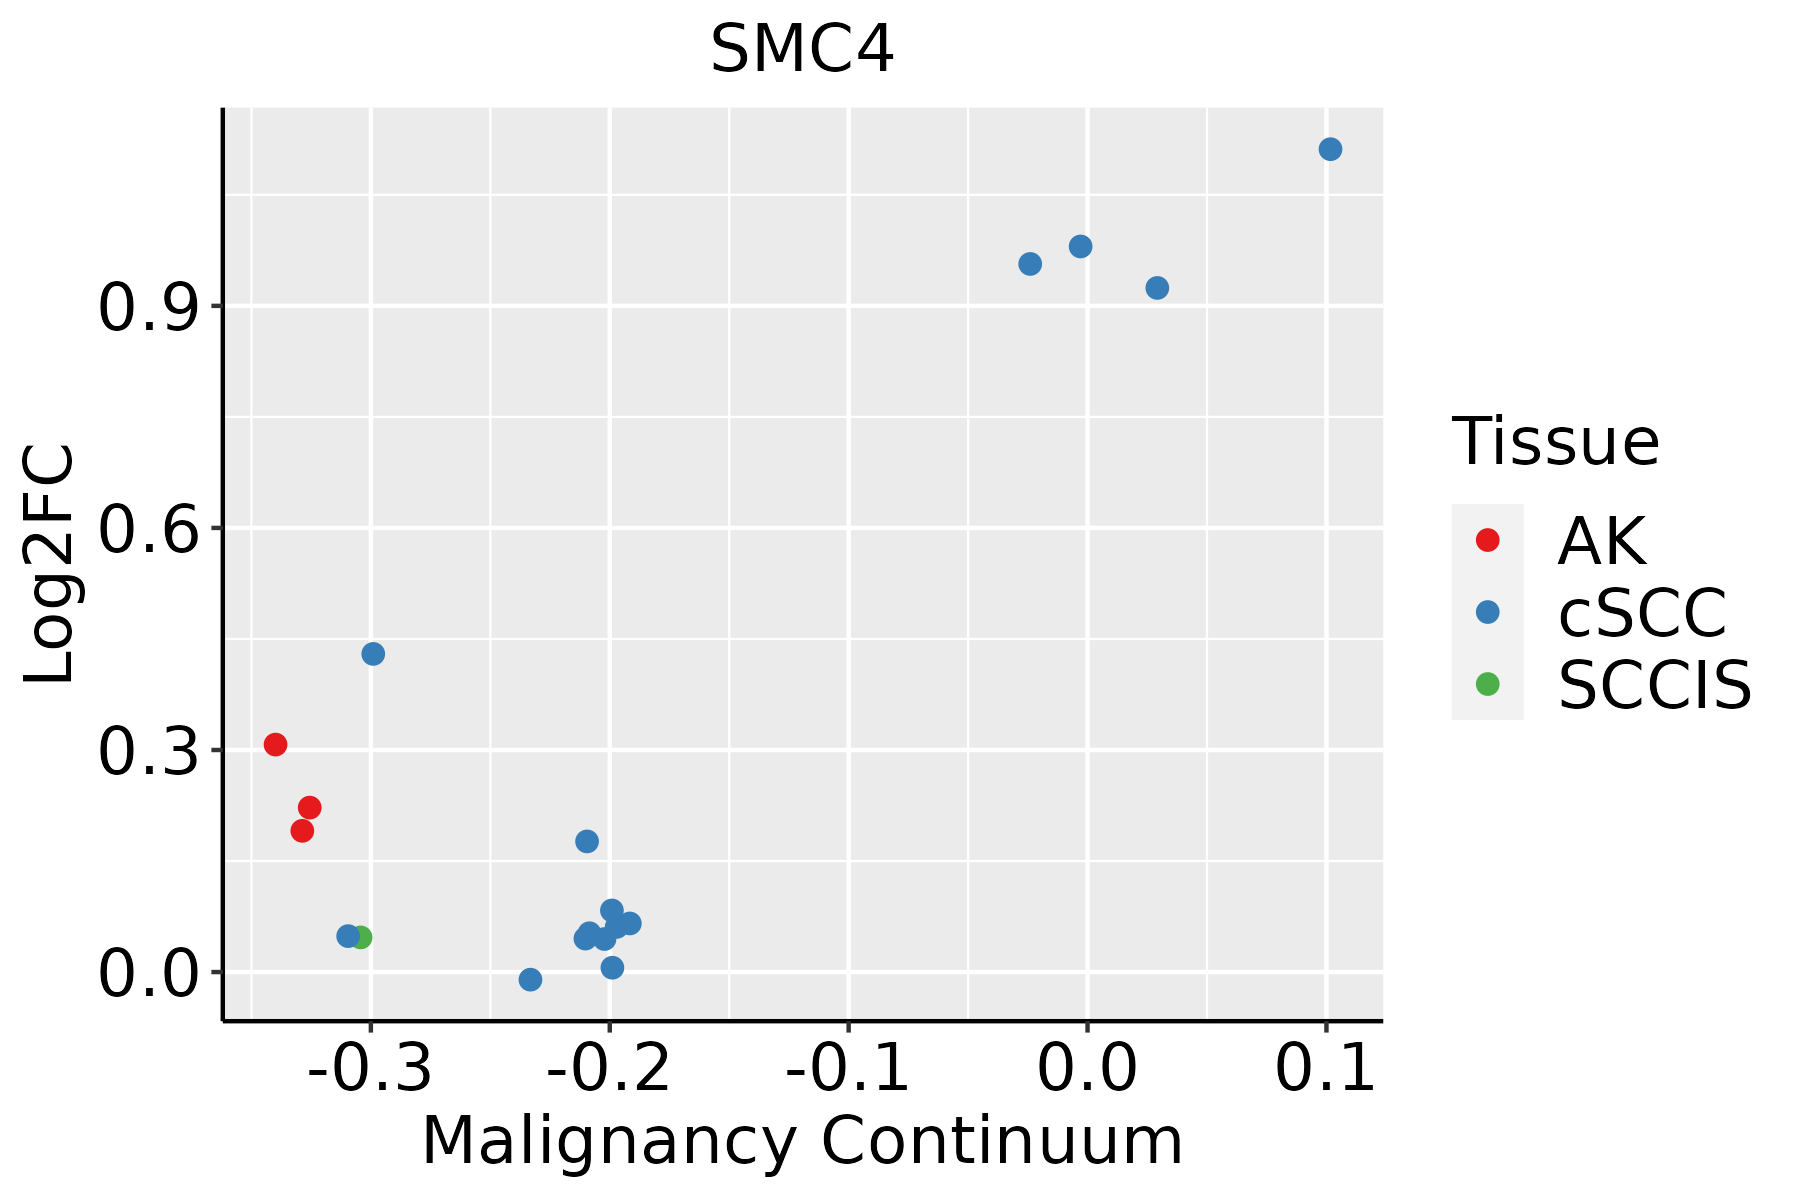 | AK: Actinic keratosis |
| cSCC: Cutaneous squamous cell carcinoma |
| SCCIS:squamous cell carcinoma in situ |
| Thyroid |  | ATC: Anaplastic thyroid cancer |
| HT: Hashimoto's thyroiditis |
| PTC: Papillary thyroid cancer |
| GO ID | Tissue | Disease Stage | Description | Gene Ratio | Bg Ratio | pvalue | p.adjust | Count |
| GO:1903050111 | Esophagus | ESCC | regulation of proteolysis involved in cellular protein catabolic process | 163/8552 | 221/18723 | 1.44e-17 | 1.27e-15 | 163 |
| GO:0061136111 | Esophagus | ESCC | regulation of proteasomal protein catabolic process | 142/8552 | 187/18723 | 2.40e-17 | 2.00e-15 | 142 |
| GO:0045732111 | Esophagus | ESCC | positive regulation of protein catabolic process | 167/8552 | 231/18723 | 1.47e-16 | 1.14e-14 | 167 |
| GO:000170119 | Esophagus | ESCC | in utero embryonic development | 243/8552 | 367/18723 | 1.00e-15 | 6.86e-14 | 243 |
| GO:1903364111 | Esophagus | ESCC | positive regulation of cellular protein catabolic process | 117/8552 | 155/18723 | 3.25e-14 | 1.66e-12 | 117 |
| GO:1901800110 | Esophagus | ESCC | positive regulation of proteasomal protein catabolic process | 91/8552 | 114/18723 | 6.74e-14 | 3.34e-12 | 91 |
| GO:00482853 | Esophagus | ESCC | organelle fission | 301/8552 | 488/18723 | 4.64e-13 | 2.12e-11 | 301 |
| GO:1903052110 | Esophagus | ESCC | positive regulation of proteolysis involved in cellular protein catabolic process | 101/8552 | 133/18723 | 9.58e-13 | 4.19e-11 | 101 |
| GO:00988133 | Esophagus | ESCC | nuclear chromosome segregation | 187/8552 | 281/18723 | 1.00e-12 | 4.36e-11 | 187 |
| GO:00002802 | Esophagus | ESCC | nuclear division | 270/8552 | 439/18723 | 1.17e-11 | 4.24e-10 | 270 |
| GO:000182412 | Esophagus | ESCC | blastocyst development | 73/8552 | 106/18723 | 1.13e-06 | 1.40e-05 | 73 |
| GO:00513831 | Esophagus | ESCC | kinetochore organization | 21/8552 | 23/18723 | 5.69e-06 | 5.90e-05 | 21 |
| GO:00070761 | Esophagus | ESCC | mitotic chromosome condensation | 15/8552 | 17/18723 | 3.48e-04 | 2.03e-03 | 15 |
| GO:001049812 | Liver | Cirrhotic | proteasomal protein catabolic process | 216/4634 | 490/18723 | 2.52e-21 | 9.29e-19 | 216 |
| GO:004217612 | Liver | Cirrhotic | regulation of protein catabolic process | 181/4634 | 391/18723 | 7.94e-21 | 2.77e-18 | 181 |
| GO:000989612 | Liver | Cirrhotic | positive regulation of catabolic process | 215/4634 | 492/18723 | 1.13e-20 | 3.56e-18 | 215 |
| GO:003133112 | Liver | Cirrhotic | positive regulation of cellular catabolic process | 190/4634 | 427/18723 | 1.94e-19 | 4.18e-17 | 190 |
| GO:004316112 | Liver | Cirrhotic | proteasome-mediated ubiquitin-dependent protein catabolic process | 184/4634 | 412/18723 | 4.52e-19 | 8.85e-17 | 184 |
| GO:190336212 | Liver | Cirrhotic | regulation of cellular protein catabolic process | 124/4634 | 255/18723 | 9.85e-17 | 1.26e-14 | 124 |
| GO:004586212 | Liver | Cirrhotic | positive regulation of proteolysis | 163/4634 | 372/18723 | 4.18e-16 | 5.14e-14 | 163 |
| Hugo Symbol | Variant Class | Variant Classification | dbSNP RS | HGVSc | HGVSp | HGVSp Short | SWISSPROT | BIOTYPE | SIFT | PolyPhen | Tumor Sample Barcode | Tissue | Histology | Sex | Age | Stage | Therapy Types | Drugs | Outcome |
| SMC4 | SNV | Missense_Mutation | | c.160N>C | p.Asp54His | p.D54H | Q9NTJ3 | protein_coding | deleterious(0) | probably_damaging(0.998) | TCGA-A8-A094-01 | Breast | breast invasive carcinoma | Female | >=65 | I/II | Unknown | Unknown | SD |
| SMC4 | SNV | Missense_Mutation | novel | c.1980N>C | p.Arg660Ser | p.R660S | Q9NTJ3 | protein_coding | tolerated(0.21) | benign(0.079) | TCGA-AN-A046-01 | Breast | breast invasive carcinoma | Female | >=65 | I/II | Unknown | Unknown | SD |
| SMC4 | SNV | Missense_Mutation | rs753147258 | c.641N>A | p.Arg214Gln | p.R214Q | Q9NTJ3 | protein_coding | deleterious(0) | benign(0.315) | TCGA-BH-A18P-01 | Breast | breast invasive carcinoma | Female | <65 | I/II | Unknown | Unknown | PD |
| SMC4 | SNV | Missense_Mutation | | c.2726N>G | p.Ile909Arg | p.I909R | Q9NTJ3 | protein_coding | deleterious(0) | probably_damaging(0.917) | TCGA-C8-A12W-01 | Breast | breast invasive carcinoma | Female | <65 | III/IV | Unknown | Unknown | SD |
| SMC4 | SNV | Missense_Mutation | rs748833024 | c.2083N>C | p.Asp695His | p.D695H | Q9NTJ3 | protein_coding | deleterious(0) | probably_damaging(0.998) | TCGA-D8-A1JC-01 | Breast | breast invasive carcinoma | Female | <65 | III/IV | Chemotherapy | adriamycin | SD |
| SMC4 | SNV | Missense_Mutation | | c.1189N>A | p.Asp397Asn | p.D397N | Q9NTJ3 | protein_coding | deleterious(0.03) | possibly_damaging(0.658) | TCGA-JL-A3YW-01 | Breast | breast invasive carcinoma | Female | <65 | I/II | Unknown | Unknown | SD |
| SMC4 | SNV | Missense_Mutation | | c.3253N>A | p.Glu1085Lys | p.E1085K | Q9NTJ3 | protein_coding | tolerated(0.29) | benign(0.009) | TCGA-C5-A1MK-01 | Cervix | cervical & endocervical cancer | Female | >=65 | III/IV | Chemotherapy | carboplatin | PD |
| SMC4 | SNV | Missense_Mutation | novel | c.606N>C | p.Lys202Asn | p.K202N | Q9NTJ3 | protein_coding | deleterious(0) | probably_damaging(0.995) | TCGA-C5-A2LZ-01 | Cervix | cervical & endocervical cancer | Female | >=65 | III/IV | Unknown | Unknown | PD |
| SMC4 | SNV | Missense_Mutation | novel | c.2188C>G | p.Gln730Glu | p.Q730E | Q9NTJ3 | protein_coding | tolerated(0.31) | benign(0.009) | TCGA-DS-A1OB-01 | Cervix | cervical & endocervical cancer | Female | <65 | I/II | Chemotherapy | carboplatin | PD |
| SMC4 | SNV | Missense_Mutation | | c.3676N>C | p.Asp1226His | p.D1226H | Q9NTJ3 | protein_coding | deleterious(0) | probably_damaging(1) | TCGA-EK-A2PG-01 | Cervix | cervical & endocervical cancer | Female | >=65 | I/II | Unknown | Unknown | SD |


