
|
|||||
|
 | |
| |
| |
| |
| |
| |
|
Gene: SLC1A1 |
Gene summary for SLC1A1 |
| Gene information | Species | Human | Gene symbol | SLC1A1 | Gene ID | 6505 |
| Gene name | solute carrier family 1 member 1 | |
| Gene Alias | DCBXA | |
| Cytomap | 9p24.2 | |
| Gene Type | protein-coding | GO ID | GO:0000041 | UniProtAcc | P43005 |
Top |
Malignant transformation analysis |
| Identification of the aberrant gene expression in precancerous and cancerous lesions by comparing the gene expression of stem-like cells in diseased tissues with normal stem cells |
| Entrez ID | Symbol | Replicates | Species | Organ | Tissue | Adj P-value | Log2FC | Malignancy |
| 6505 | SLC1A1 | NAFLD1 | Human | Liver | NAFLD | 2.25e-09 | 1.09e+00 | -0.04 |
| 6505 | SLC1A1 | S41 | Human | Liver | Cirrhotic | 6.78e-04 | 5.12e-01 | -0.0343 |
| 6505 | SLC1A1 | S43 | Human | Liver | Cirrhotic | 4.85e-05 | -1.15e-02 | -0.0187 |
| 6505 | SLC1A1 | HCC1_Meng | Human | Liver | HCC | 2.28e-09 | -2.61e-01 | 0.0246 |
| 6505 | SLC1A1 | HCC2_Meng | Human | Liver | HCC | 5.27e-17 | -1.22e-01 | 0.0107 |
| 6505 | SLC1A1 | Pt13.a | Human | Liver | HCC | 5.99e-07 | -2.52e-01 | 0.021 |
| 6505 | SLC1A1 | Pt14.d | Human | Liver | HCC | 3.96e-06 | -2.51e-01 | 0.0143 |
| 6505 | SLC1A1 | S016 | Human | Liver | HCC | 4.20e-03 | -2.62e-01 | 0.2243 |
| 6505 | SLC1A1 | S027 | Human | Liver | HCC | 1.39e-02 | 4.54e-01 | 0.2446 |
| 6505 | SLC1A1 | S028 | Human | Liver | HCC | 2.04e-04 | 2.55e-01 | 0.2503 |
| 6505 | SLC1A1 | S029 | Human | Liver | HCC | 1.14e-06 | 3.49e-01 | 0.2581 |
| 6505 | SLC1A1 | RNA-P25T1-P25T1-1 | Human | Lung | AIS | 1.97e-14 | 8.25e-01 | -0.2116 |
| 6505 | SLC1A1 | RNA-P25T1-P25T1-3 | Human | Lung | AIS | 2.21e-02 | 5.76e-01 | -0.2107 |
| 6505 | SLC1A1 | RNA-P25T1-P25T1-4 | Human | Lung | AIS | 3.13e-15 | 7.67e-01 | -0.2119 |
| 6505 | SLC1A1 | RNA-P7T1-P7T1-4 | Human | Lung | AIS | 6.09e-04 | 4.77e-01 | -0.0809 |
| Page: 1 |
| Tissue | Expression Dynamics | Abbreviation |
| Liver |  | HCC: Hepatocellular carcinoma |
| NAFLD: Non-alcoholic fatty liver disease | ||
| Lung | 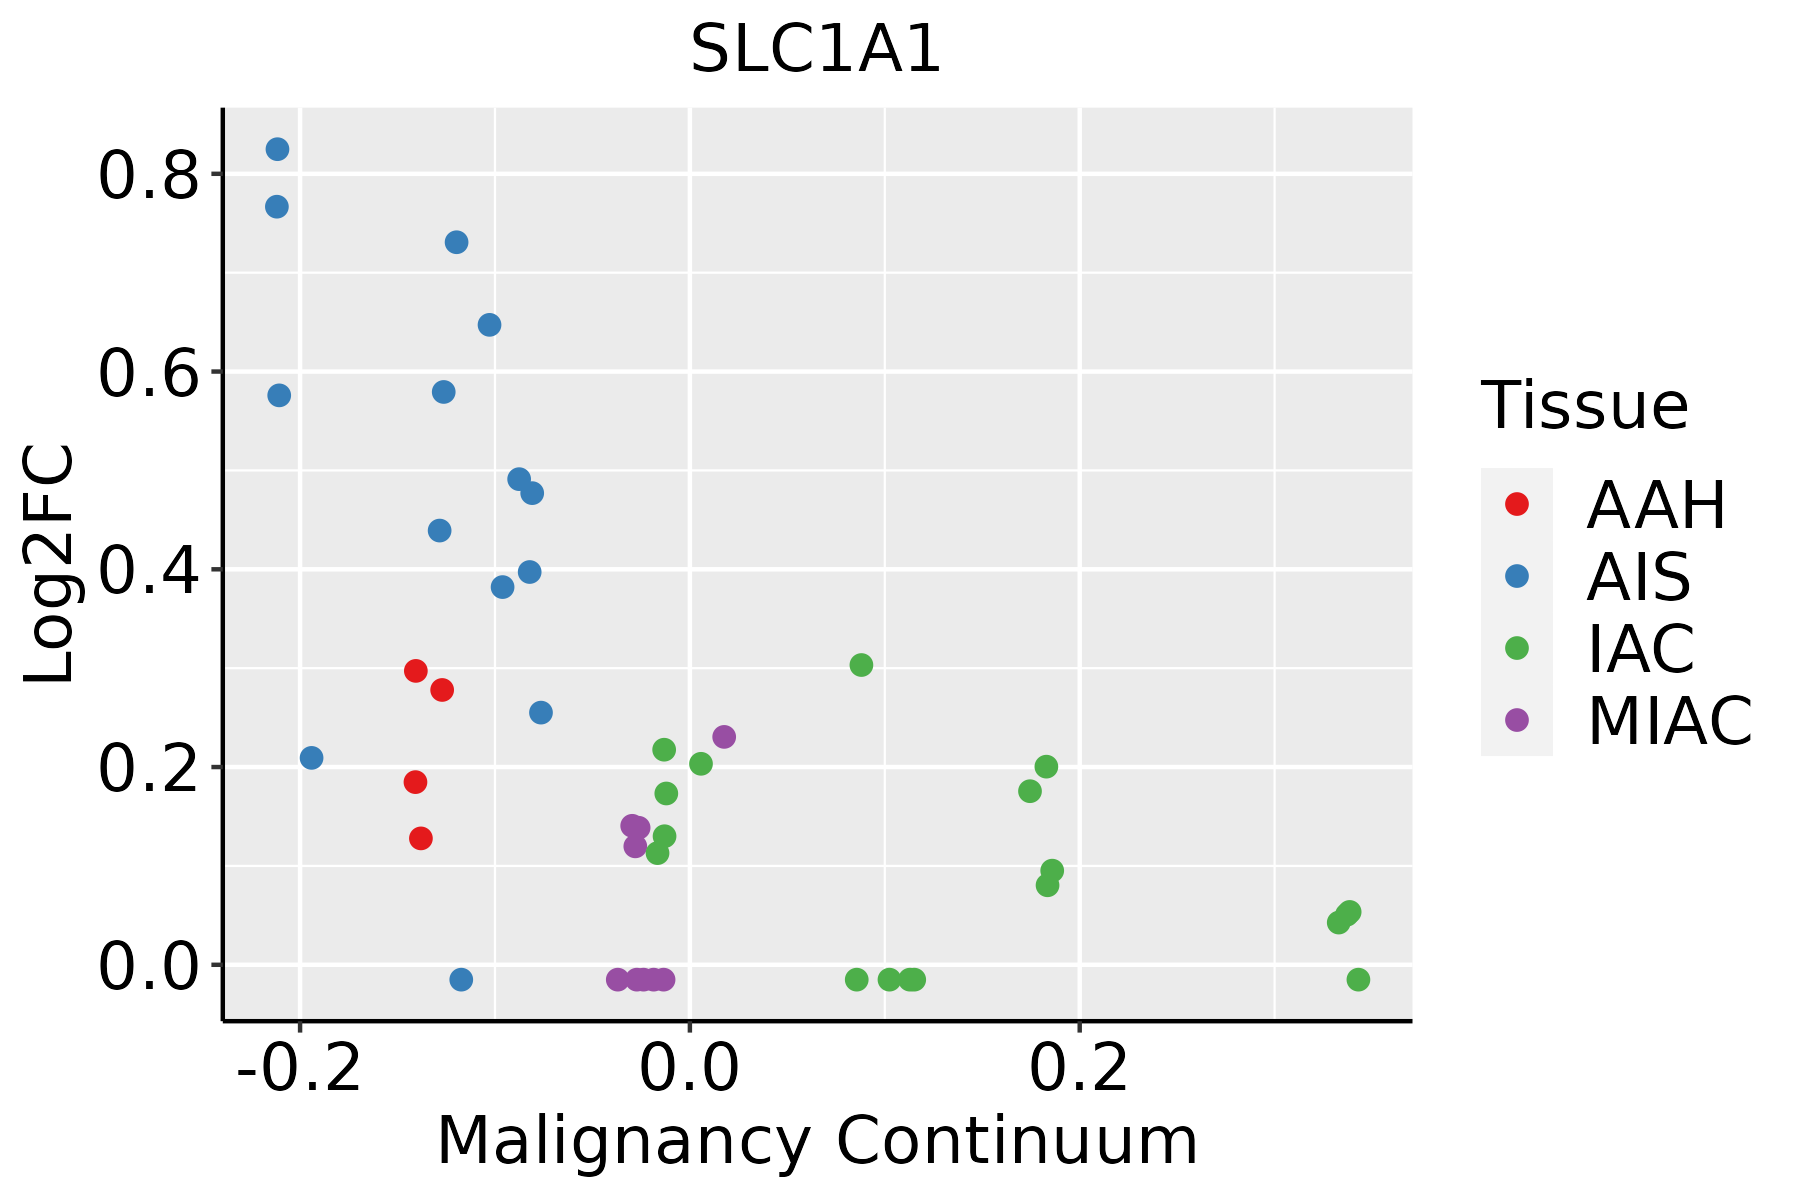 | AAH: Atypical adenomatous hyperplasia |
| AIS: Adenocarcinoma in situ | ||
| IAC: Invasive lung adenocarcinoma | ||
| MIA: Minimally invasive adenocarcinoma |
| ∗log2FC in expression of this searched gene in stem-like cells from each diseased tissue sample relative to stem-like cells in normal samples in each tissue plotted against the malignancy continuum. Samples are colored based on if they are from different disease stage. |
Top |
Malignant transformation related pathway analysis |
| Find out the enriched GO biological processes and KEGG pathways involved in transition from healthy to precancer to cancer |
| Tissue | Disease Stage | Enriched GO biological Processes |
| Colorectum | AD |  |
| Colorectum | SER |  |
| Colorectum | MSS |  |
| Colorectum | MSI-H |  |
| Colorectum | FAP |  |
| ∗Top 15 enriched GO BP terms are showed in the bar plot of each disease state in each tissue. Each row represents a significant GO biological process which is colored according to the -log10(p.adjust). |
| Page: 1 2 3 4 5 6 7 8 9 |
| GO ID | Tissue | Disease Stage | Description | Gene Ratio | Bg Ratio | pvalue | p.adjust | Count |
| GO:005254722 | Liver | HCC | regulation of peptidase activity | 247/7958 | 461/18723 | 8.28e-07 | 1.27e-05 | 247 |
| GO:00315031 | Liver | HCC | protein-containing complex localization | 129/7958 | 220/18723 | 9.38e-07 | 1.42e-05 | 129 |
| GO:003629312 | Liver | HCC | response to decreased oxygen levels | 179/7958 | 322/18723 | 1.29e-06 | 1.87e-05 | 179 |
| GO:007048212 | Liver | HCC | response to oxygen levels | 191/7958 | 347/18723 | 1.42e-06 | 2.03e-05 | 191 |
| GO:005254822 | Liver | HCC | regulation of endopeptidase activity | 230/7958 | 432/18723 | 3.58e-06 | 4.68e-05 | 230 |
| GO:004239821 | Liver | HCC | cellular modified amino acid biosynthetic process | 34/7958 | 46/18723 | 1.53e-05 | 1.67e-04 | 34 |
| GO:000674911 | Liver | HCC | glutathione metabolic process | 44/7958 | 64/18723 | 1.95e-05 | 2.09e-04 | 44 |
| GO:001810511 | Liver | HCC | peptidyl-serine phosphorylation | 169/7958 | 315/18723 | 3.86e-05 | 3.81e-04 | 169 |
| GO:005140212 | Liver | HCC | neuron apoptotic process | 135/7958 | 246/18723 | 5.64e-05 | 5.26e-04 | 135 |
| GO:005507612 | Liver | HCC | transition metal ion homeostasis | 81/7958 | 138/18723 | 8.87e-05 | 7.72e-04 | 81 |
| GO:001095212 | Liver | HCC | positive regulation of peptidase activity | 110/7958 | 197/18723 | 1.04e-04 | 8.98e-04 | 110 |
| GO:004352312 | Liver | HCC | regulation of neuron apoptotic process | 117/7958 | 212/18723 | 1.25e-04 | 1.03e-03 | 117 |
| GO:001820911 | Liver | HCC | peptidyl-serine modification | 177/7958 | 338/18723 | 1.45e-04 | 1.17e-03 | 177 |
| GO:190121512 | Liver | HCC | negative regulation of neuron death | 113/7958 | 208/18723 | 3.68e-04 | 2.54e-03 | 113 |
| GO:00066121 | Liver | HCC | protein targeting to membrane | 75/7958 | 131/18723 | 4.58e-04 | 3.04e-03 | 75 |
| GO:004691611 | Liver | HCC | cellular transition metal ion homeostasis | 67/7958 | 115/18723 | 4.64e-04 | 3.08e-03 | 67 |
| GO:004586021 | Liver | HCC | positive regulation of protein kinase activity | 194/7958 | 386/18723 | 1.16e-03 | 6.54e-03 | 194 |
| GO:007124112 | Liver | HCC | cellular response to inorganic substance | 119/7958 | 226/18723 | 1.26e-03 | 6.92e-03 | 119 |
| GO:003647511 | Liver | HCC | neuron death in response to oxidative stress | 22/7958 | 31/18723 | 1.27e-03 | 6.92e-03 | 22 |
| GO:001095012 | Liver | HCC | positive regulation of endopeptidase activity | 96/7958 | 179/18723 | 1.68e-03 | 8.79e-03 | 96 |
| Page: 1 2 3 4 5 6 7 8 9 |
| Pathway ID | Tissue | Disease Stage | Description | Gene Ratio | Bg Ratio | pvalue | p.adjust | qvalue | Count |
| Page: 1 |
Top |
Cell-cell communication analysis |
| Identification of potential cell-cell interactions between two cell types and their ligand-receptor pairs for different disease states |
| Ligand | Receptor | LRpair | Pathway | Tissue | Disease Stage |
| Page: 1 |
Top |
Single-cell gene regulatory network inference analysis |
| Find out the significant the regulons (TFs) and the target genes of each regulon across cell types for different disease states |
| TF | Cell Type | Tissue | Disease Stage | Target Gene | RSS | Regulon Activity |
| ∗The dot plots of a searched regulon are shown for all cell subpopulations in each disease state of each tissue based on the regulon specific score inferred using pySCENIC and by calculating the average expression. |
| Page: 1 |
Top |
Somatic mutation of malignant transformation related genes |
| Annotation of somatic variants for genes involved in malignant transformation |
| Hugo Symbol | Variant Class | Variant Classification | dbSNP RS | HGVSc | HGVSp | HGVSp Short | SWISSPROT | BIOTYPE | SIFT | PolyPhen | Tumor Sample Barcode | Tissue | Histology | Sex | Age | Stage | Therapy Types | Drugs | Outcome |
| SLC1A1 | SNV | Missense_Mutation | c.1471N>C | p.Ile491Leu | p.I491L | P43005 | protein_coding | tolerated(0.46) | benign(0) | TCGA-D8-A1XK-01 | Breast | breast invasive carcinoma | Female | <65 | I/II | Chemotherapy | doxorubicine+cyclophosphamide | SD | |
| SLC1A1 | SNV | Missense_Mutation | rs199857691 | c.1288N>A | p.Ala430Thr | p.A430T | P43005 | protein_coding | tolerated(1) | benign(0.057) | TCGA-OL-A6VR-01 | Breast | breast invasive carcinoma | Female | <65 | I/II | Unknown | Unknown | SD |
| SLC1A1 | SNV | Missense_Mutation | c.979G>A | p.Ala327Thr | p.A327T | P43005 | protein_coding | deleterious(0) | probably_damaging(0.998) | TCGA-A6-2686-01 | Colorectum | colon adenocarcinoma | Female | >=65 | I/II | Unknown | Unknown | SD | |
| SLC1A1 | SNV | Missense_Mutation | novel | c.1508N>G | p.Tyr503Cys | p.Y503C | P43005 | protein_coding | tolerated(0.09) | probably_damaging(0.94) | TCGA-AA-3815-01 | Colorectum | colon adenocarcinoma | Female | >=65 | I/II | Unknown | Unknown | SD |
| SLC1A1 | SNV | Missense_Mutation | rs752394755 | c.256N>A | p.Val86Ile | p.V86I | P43005 | protein_coding | tolerated(0.08) | benign(0.015) | TCGA-AA-3947-01 | Colorectum | colon adenocarcinoma | Female | <65 | I/II | Unknown | Unknown | SD |
| SLC1A1 | SNV | Missense_Mutation | rs748031544 | c.383C>T | p.Ala128Val | p.A128V | P43005 | protein_coding | tolerated(0.38) | benign(0.01) | TCGA-AA-A010-01 | Colorectum | colon adenocarcinoma | Female | <65 | I/II | Chemotherapy | folinic | CR |
| SLC1A1 | SNV | Missense_Mutation | c.1013C>A | p.Pro338His | p.P338H | P43005 | protein_coding | deleterious(0) | probably_damaging(1) | TCGA-AA-A010-01 | Colorectum | colon adenocarcinoma | Female | <65 | I/II | Chemotherapy | folinic | CR | |
| SLC1A1 | SNV | Missense_Mutation | c.443N>T | p.Asn148Ile | p.N148I | P43005 | protein_coding | deleterious(0) | probably_damaging(0.997) | TCGA-CK-4951-01 | Colorectum | colon adenocarcinoma | Female | >=65 | I/II | Unknown | Unknown | PD | |
| SLC1A1 | SNV | Missense_Mutation | c.1415N>C | p.Gln472Pro | p.Q472P | P43005 | protein_coding | tolerated(0.12) | benign(0) | TCGA-D5-6530-01 | Colorectum | colon adenocarcinoma | Male | <65 | I/II | Unknown | Unknown | SD | |
| SLC1A1 | SNV | Missense_Mutation | c.905N>T | p.Pro302Leu | p.P302L | P43005 | protein_coding | deleterious(0.03) | probably_damaging(0.985) | TCGA-AG-3592-01 | Colorectum | rectum adenocarcinoma | Male | >=65 | I/II | Unknown | Unknown | SD |
| Page: 1 2 3 4 5 6 |
Top |
Related drugs of malignant transformation related genes |
| Identification of chemicals and drugs interact with genes involved in malignant transfromation |
| (DGIdb 4.0) |
| Entrez ID | Symbol | Category | Interaction Types | Drug Claim Name | Drug Name | PMIDs |
| 6505 | SLC1A1 | TRANSPORTER, CELL SURFACE, DRUGGABLE GENOME | CLOZAPINE | CLOZAPINE | 12873733 | |
| 6505 | SLC1A1 | TRANSPORTER, CELL SURFACE, DRUGGABLE GENOME | inhibitor | 178101343 | ||
| 6505 | SLC1A1 | TRANSPORTER, CELL SURFACE, DRUGGABLE GENOME | WORTMANNIN | WORTMANNIN | 12401608,9502808,14574224 | |
| 6505 | SLC1A1 | TRANSPORTER, CELL SURFACE, DRUGGABLE GENOME | PMA | 15707698,9502808,14574224 | ||
| 6505 | SLC1A1 | TRANSPORTER, CELL SURFACE, DRUGGABLE GENOME | 178101255 | |||
| 6505 | SLC1A1 | TRANSPORTER, CELL SURFACE, DRUGGABLE GENOME | Selective serotonin reuptake inhibitors | 22776887 | ||
| 6505 | SLC1A1 | TRANSPORTER, CELL SURFACE, DRUGGABLE GENOME | ETHANOL | ALCOHOL | 14574224 | |
| 6505 | SLC1A1 | TRANSPORTER, CELL SURFACE, DRUGGABLE GENOME | inhibitor | 178101344 | ||
| 6505 | SLC1A1 | TRANSPORTER, CELL SURFACE, DRUGGABLE GENOME | LIDOCAINE | LIDOCAINE | 12401608 | |
| 6505 | SLC1A1 | TRANSPORTER, CELL SURFACE, DRUGGABLE GENOME | STAUROSPORINE | STAUROSPORINE | 12401608,12759177 |
| Page: 1 2 |

Copyright 2023-Present -The University of Texas Health Science Center at Houston |