
|
|||||
|
 | |
| |
| |
| |
| |
| |
|
Gene: SF3B6 |
Gene summary for SF3B6 |
| Gene information | Species | Human | Gene symbol | SF3B6 | Gene ID | 51639 |
| Gene name | splicing factor 3b subunit 6 | |
| Gene Alias | CGI-110 | |
| Cytomap | 2p23.3 | |
| Gene Type | protein-coding | GO ID | GO:0000375 | UniProtAcc | Q9Y3B4 |
Top |
Malignant transformation analysis |
| Identification of the aberrant gene expression in precancerous and cancerous lesions by comparing the gene expression of stem-like cells in diseased tissues with normal stem cells |
| Entrez ID | Symbol | Replicates | Species | Organ | Tissue | Adj P-value | Log2FC | Malignancy |
| 51639 | SF3B6 | GSM4909277 | Human | Breast | Precancer | 2.06e-03 | 2.14e-01 | 0.0177 |
| 51639 | SF3B6 | GSM4909281 | Human | Breast | IDC | 9.52e-04 | 3.03e-01 | 0.21 |
| 51639 | SF3B6 | GSM4909285 | Human | Breast | IDC | 3.26e-74 | 8.37e-01 | 0.21 |
| 51639 | SF3B6 | GSM4909286 | Human | Breast | IDC | 7.06e-05 | -1.03e-01 | 0.1081 |
| 51639 | SF3B6 | GSM4909290 | Human | Breast | IDC | 4.78e-04 | 3.16e-01 | 0.2096 |
| 51639 | SF3B6 | GSM4909294 | Human | Breast | IDC | 9.28e-12 | 1.33e-01 | 0.2022 |
| 51639 | SF3B6 | GSM4909296 | Human | Breast | IDC | 5.92e-15 | -2.44e-01 | 0.1524 |
| 51639 | SF3B6 | GSM4909297 | Human | Breast | IDC | 7.14e-24 | -1.15e-01 | 0.1517 |
| 51639 | SF3B6 | GSM4909302 | Human | Breast | IDC | 1.60e-06 | -3.41e-01 | 0.1545 |
| 51639 | SF3B6 | GSM4909309 | Human | Breast | IDC | 1.24e-04 | -1.51e-01 | 0.0483 |
| 51639 | SF3B6 | GSM4909311 | Human | Breast | IDC | 1.36e-52 | -4.75e-01 | 0.1534 |
| 51639 | SF3B6 | GSM4909312 | Human | Breast | IDC | 3.35e-15 | -4.31e-02 | 0.1552 |
| 51639 | SF3B6 | GSM4909313 | Human | Breast | IDC | 7.68e-09 | -3.66e-01 | 0.0391 |
| 51639 | SF3B6 | GSM4909316 | Human | Breast | IDC | 2.64e-02 | 9.25e-02 | 0.21 |
| 51639 | SF3B6 | GSM4909318 | Human | Breast | IDC | 5.98e-08 | 4.14e-01 | 0.2031 |
| 51639 | SF3B6 | GSM4909319 | Human | Breast | IDC | 7.74e-56 | -5.88e-01 | 0.1563 |
| 51639 | SF3B6 | GSM4909320 | Human | Breast | IDC | 9.52e-09 | -4.06e-01 | 0.1575 |
| 51639 | SF3B6 | GSM4909321 | Human | Breast | IDC | 9.79e-23 | -3.64e-01 | 0.1559 |
| 51639 | SF3B6 | brca1 | Human | Breast | Precancer | 3.99e-07 | 3.36e-01 | -0.0338 |
| 51639 | SF3B6 | brca3 | Human | Breast | Precancer | 1.86e-04 | 3.01e-01 | -0.0263 |
| Page: 1 2 3 4 5 6 7 8 9 10 11 12 13 14 |
| Tissue | Expression Dynamics | Abbreviation |
| Breast |  | IDC: Invasive ductal carcinoma |
| DCIS: Ductal carcinoma in situ | ||
| Precancer(BRCA1-mut): Precancerous lesion from BRCA1 mutation carriers | ||
| Cervix | 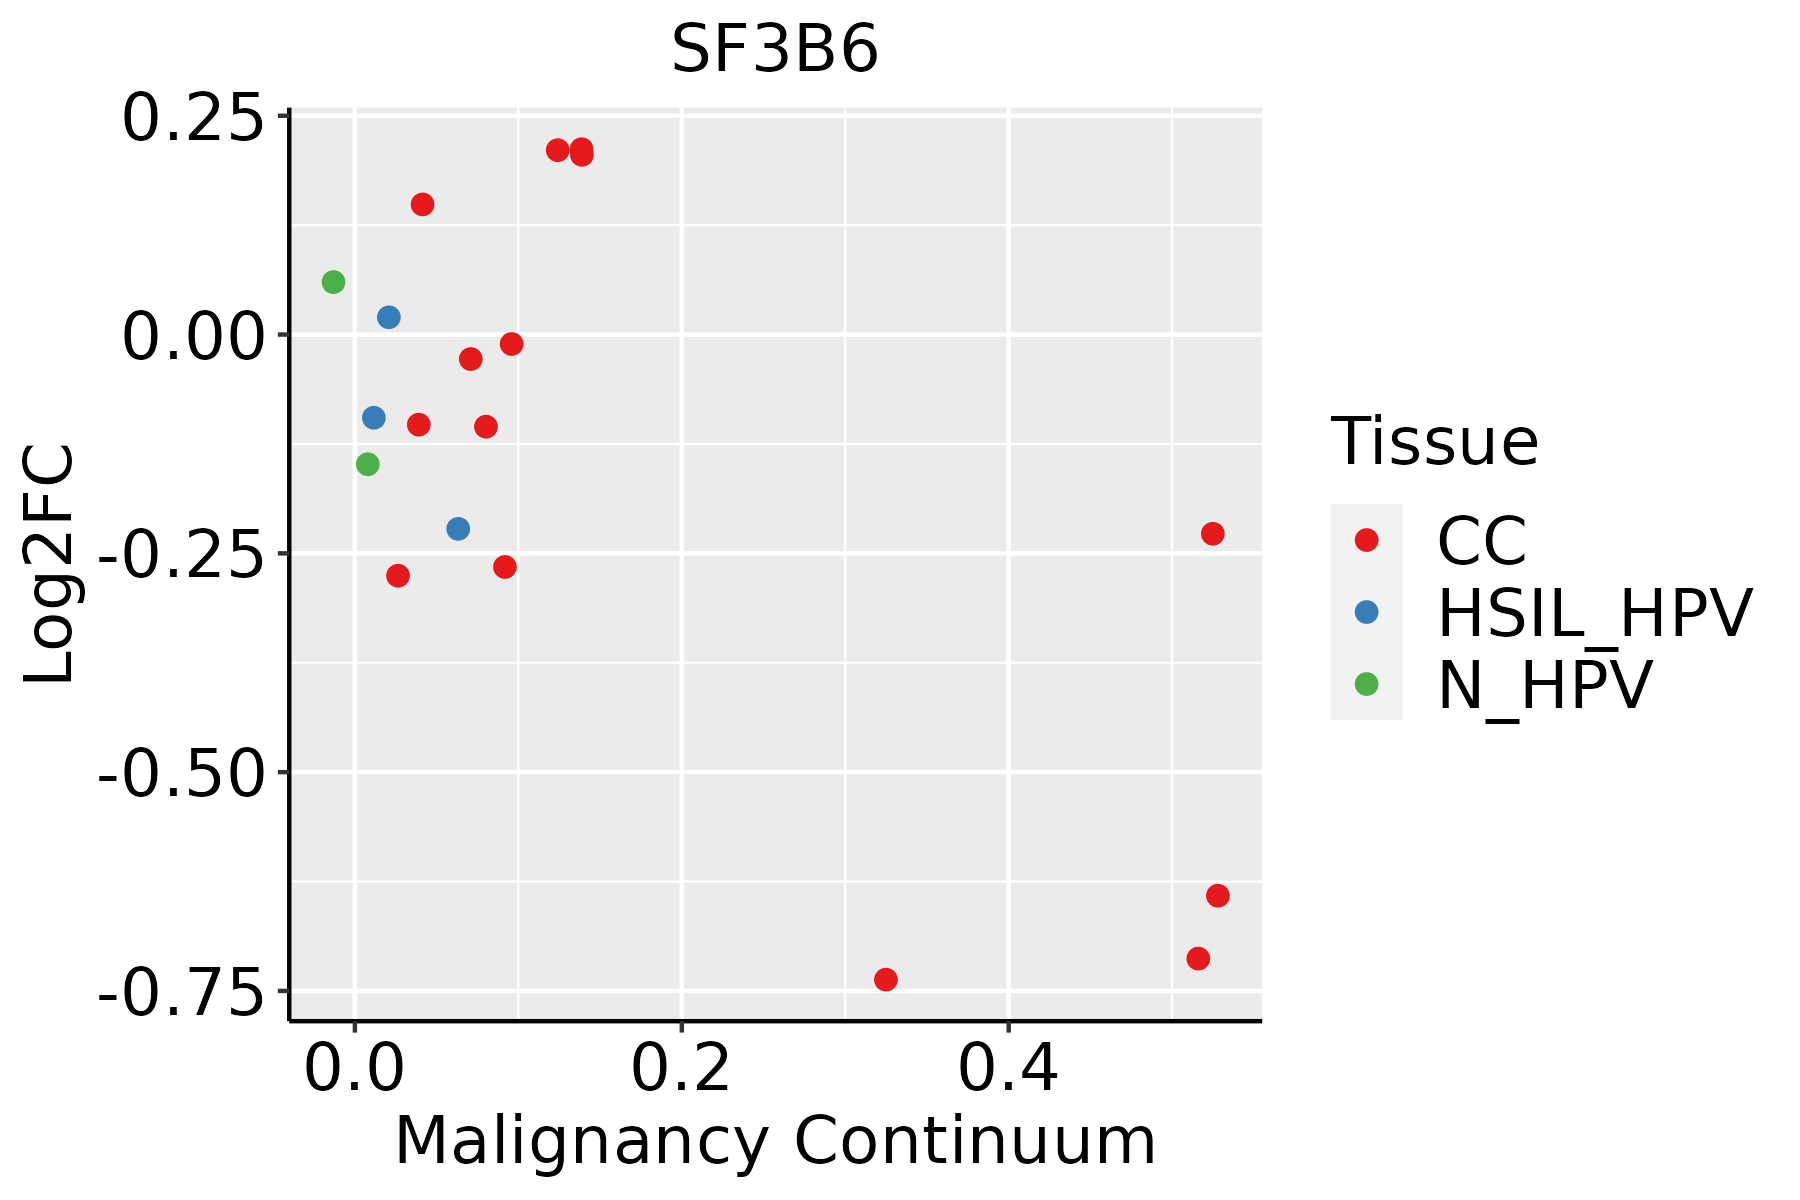 | CC: Cervix cancer |
| HSIL_HPV: HPV-infected high-grade squamous intraepithelial lesions | ||
| N_HPV: HPV-infected normal cervix | ||
| Colorectum (GSE201348) |  | FAP: Familial adenomatous polyposis |
| CRC: Colorectal cancer | ||
| Colorectum (HTA11) |  | AD: Adenomas |
| SER: Sessile serrated lesions | ||
| MSI-H: Microsatellite-high colorectal cancer | ||
| MSS: Microsatellite stable colorectal cancer | ||
| Endometrium | 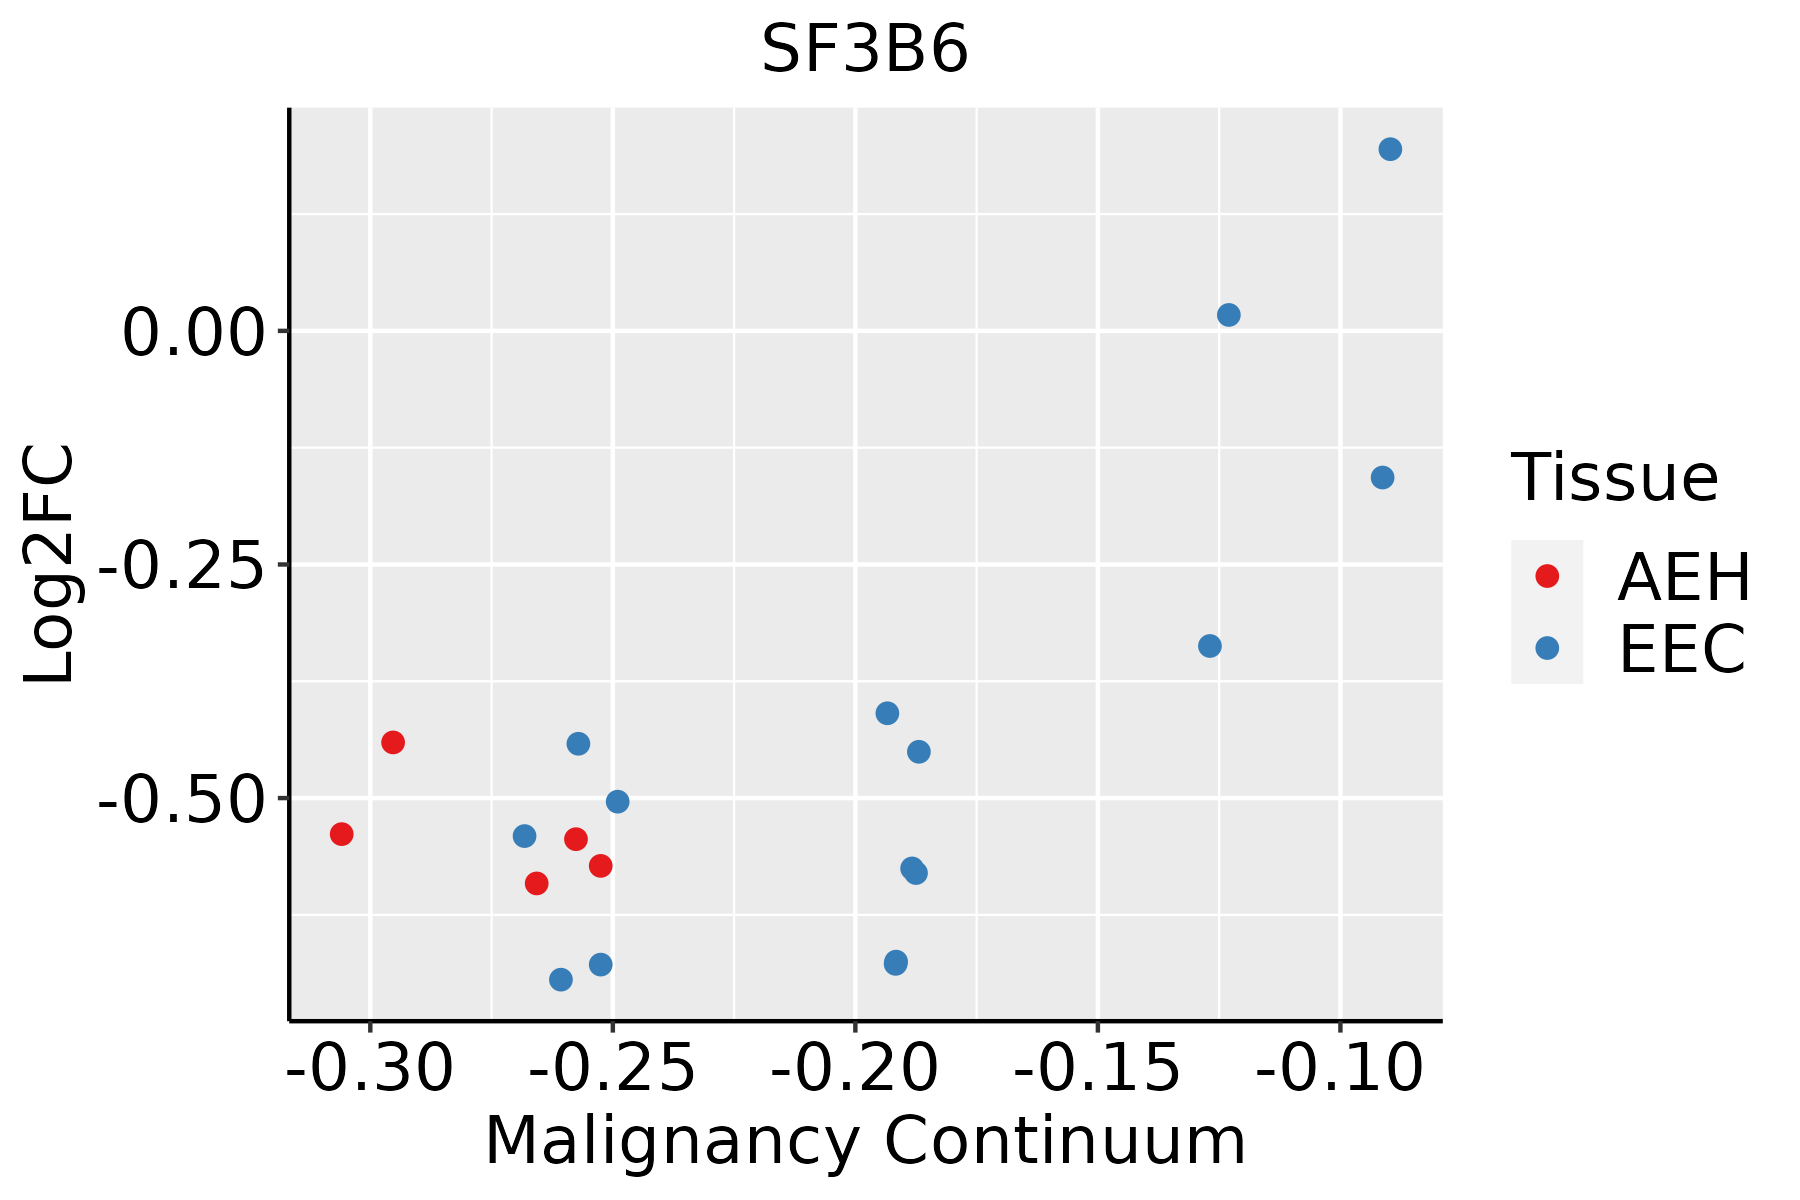 | AEH: Atypical endometrial hyperplasia |
| EEC: Endometrioid Cancer | ||
| Esophagus | 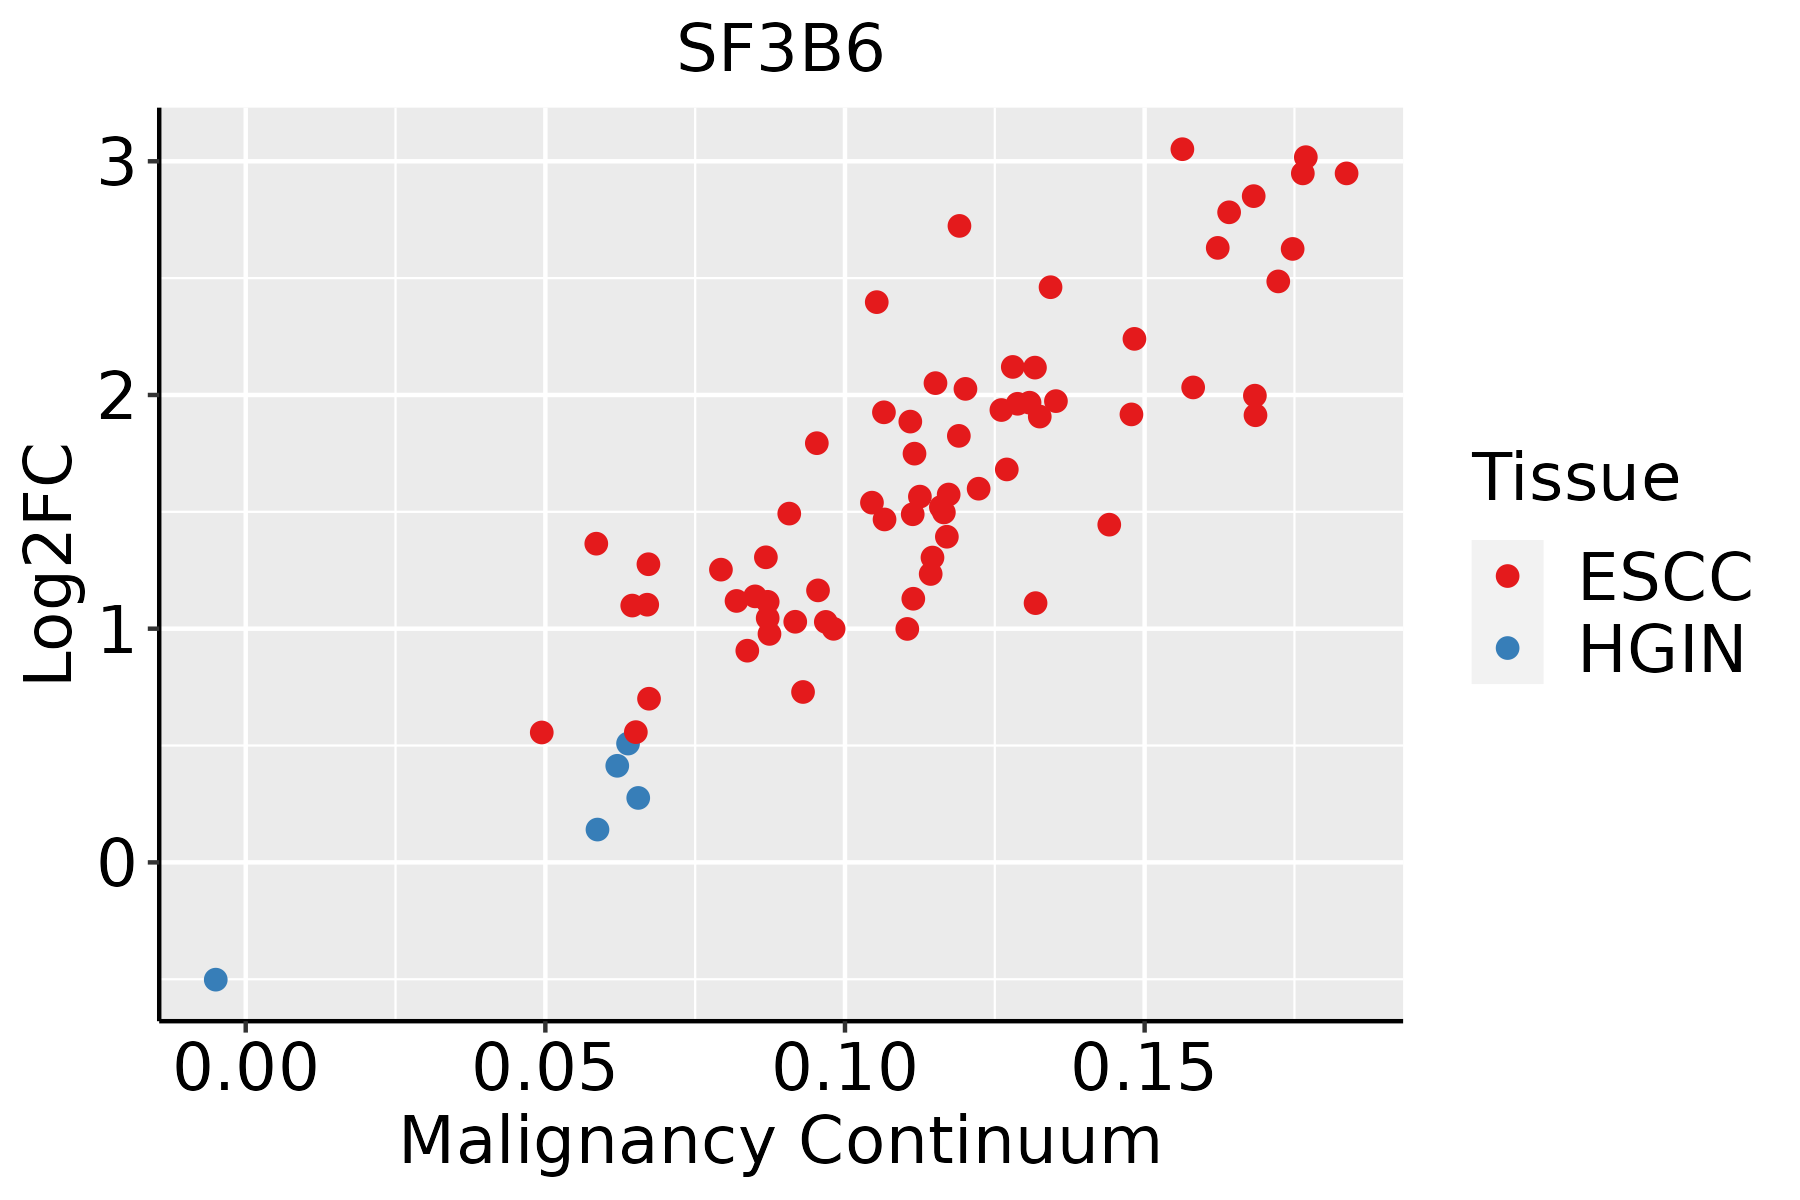 | ESCC: Esophageal squamous cell carcinoma |
| HGIN: High-grade intraepithelial neoplasias | ||
| LGIN: Low-grade intraepithelial neoplasias | ||
| GC | 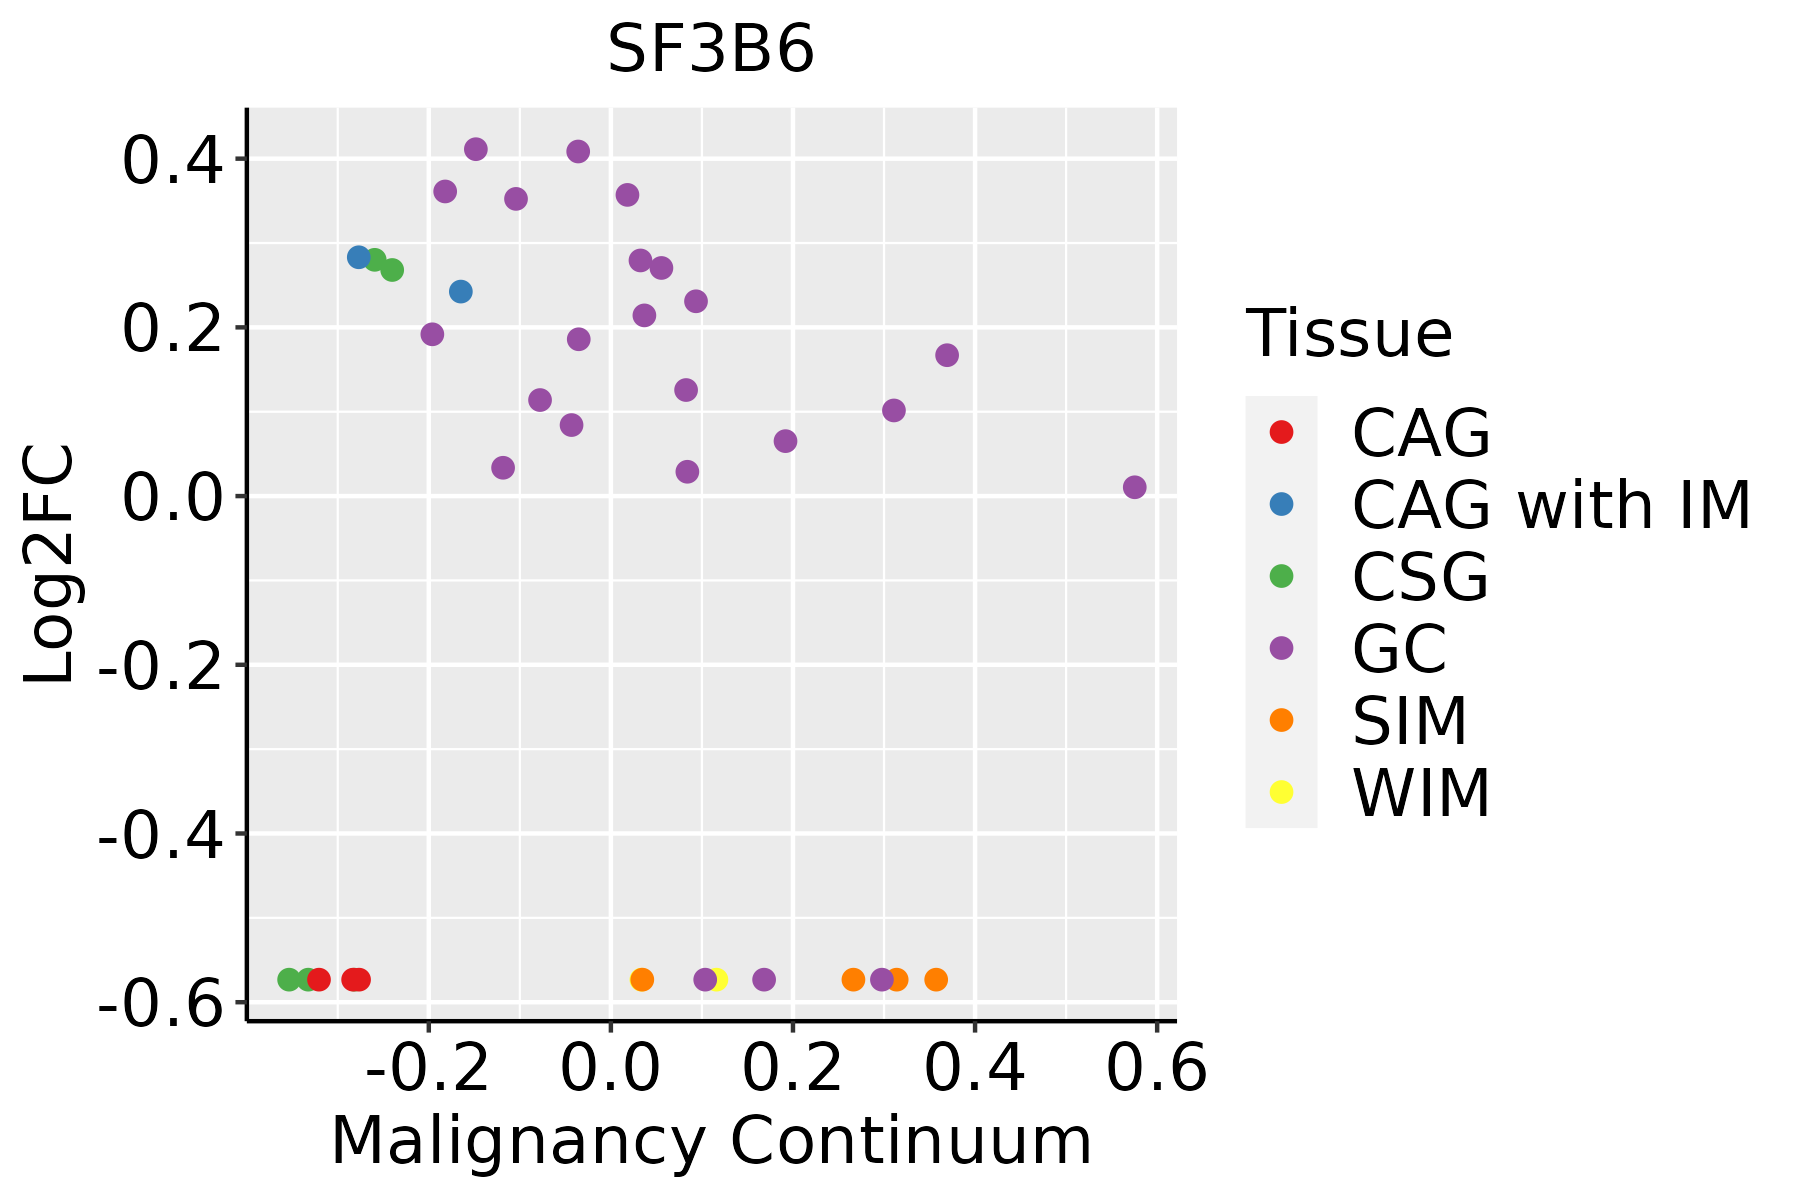 | CAG: Chronic atrophic gastritis |
| CAG with IM: Chronic atrophic gastritis with intestinal metaplasia | ||
| CSG: Chronic superficial gastritis | ||
| GC: Gastric cancer | ||
| SIM: Severe intestinal metaplasia | ||
| WIM: Wild intestinal metaplasia | ||
| Liver | 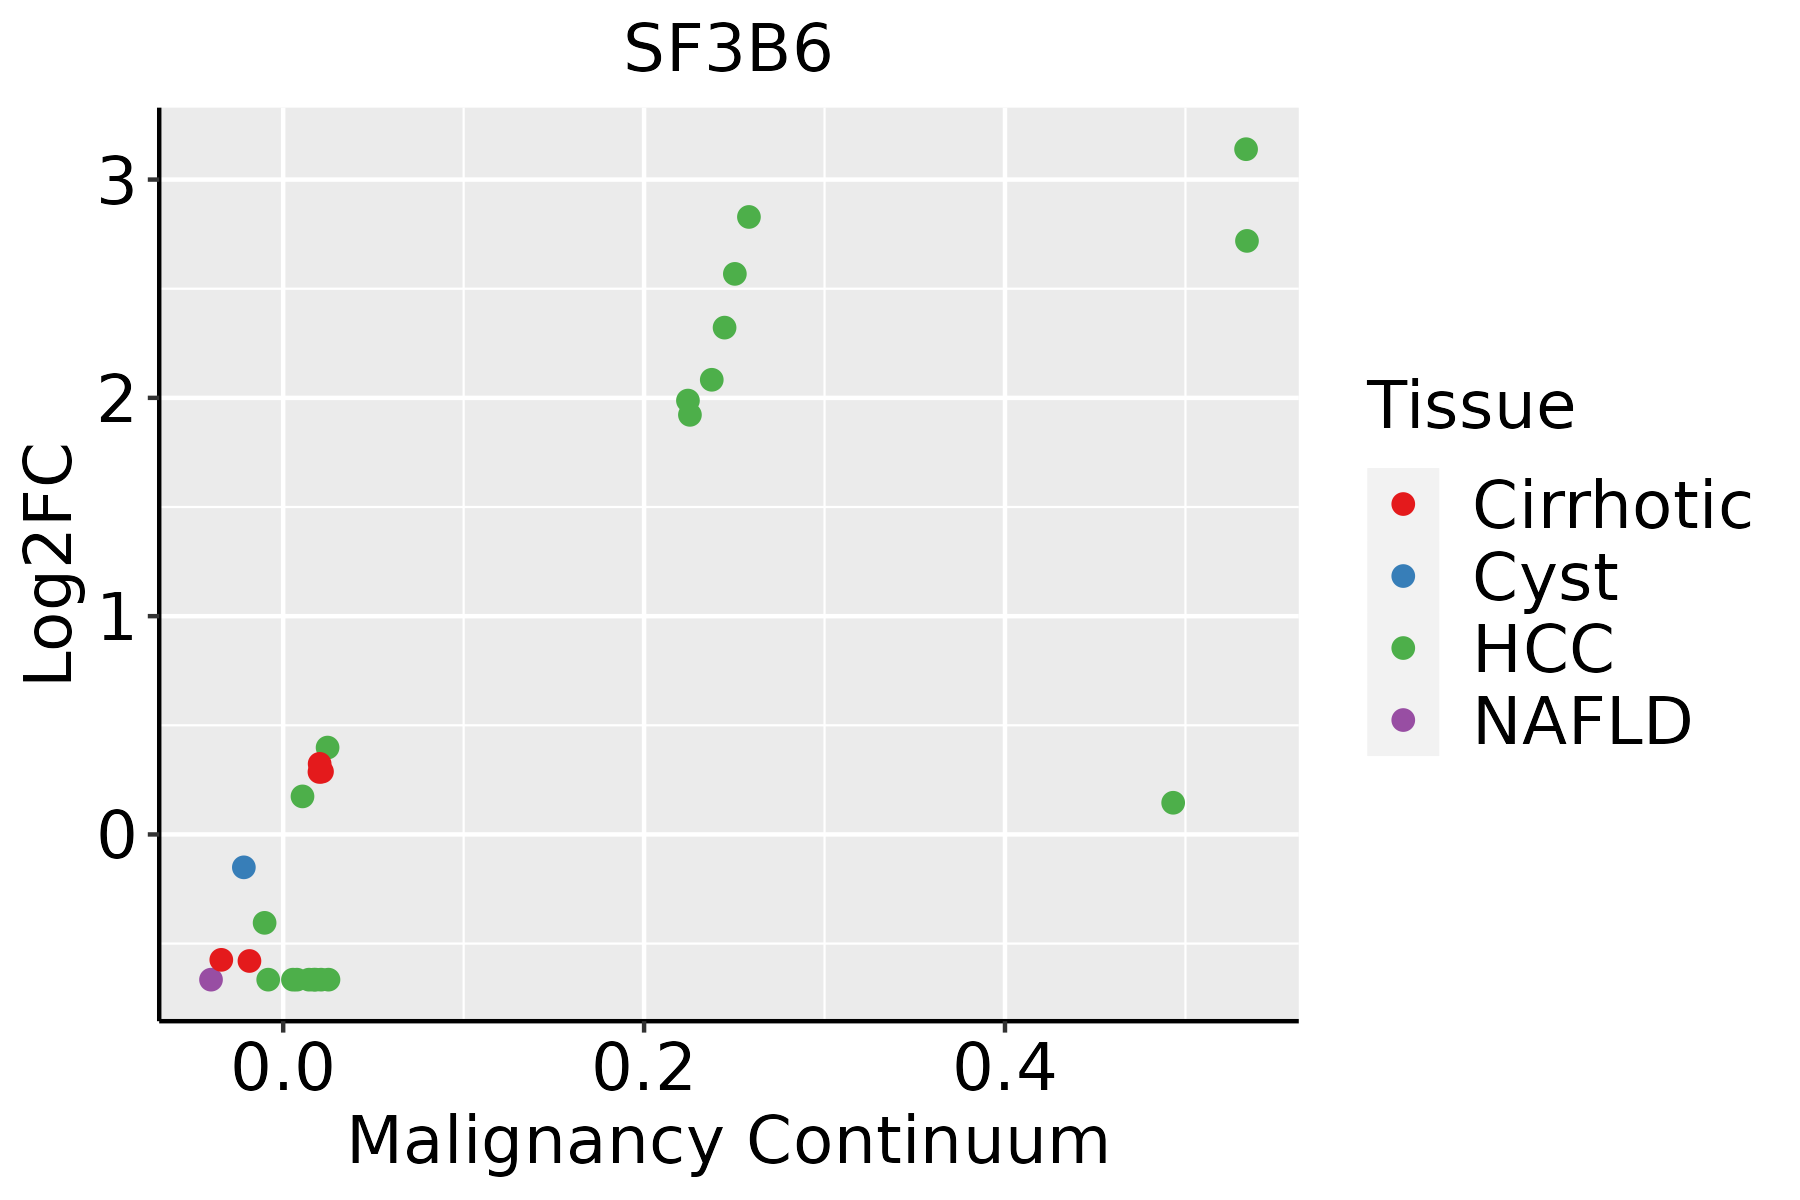 | HCC: Hepatocellular carcinoma |
| NAFLD: Non-alcoholic fatty liver disease | ||
| Oral Cavity | 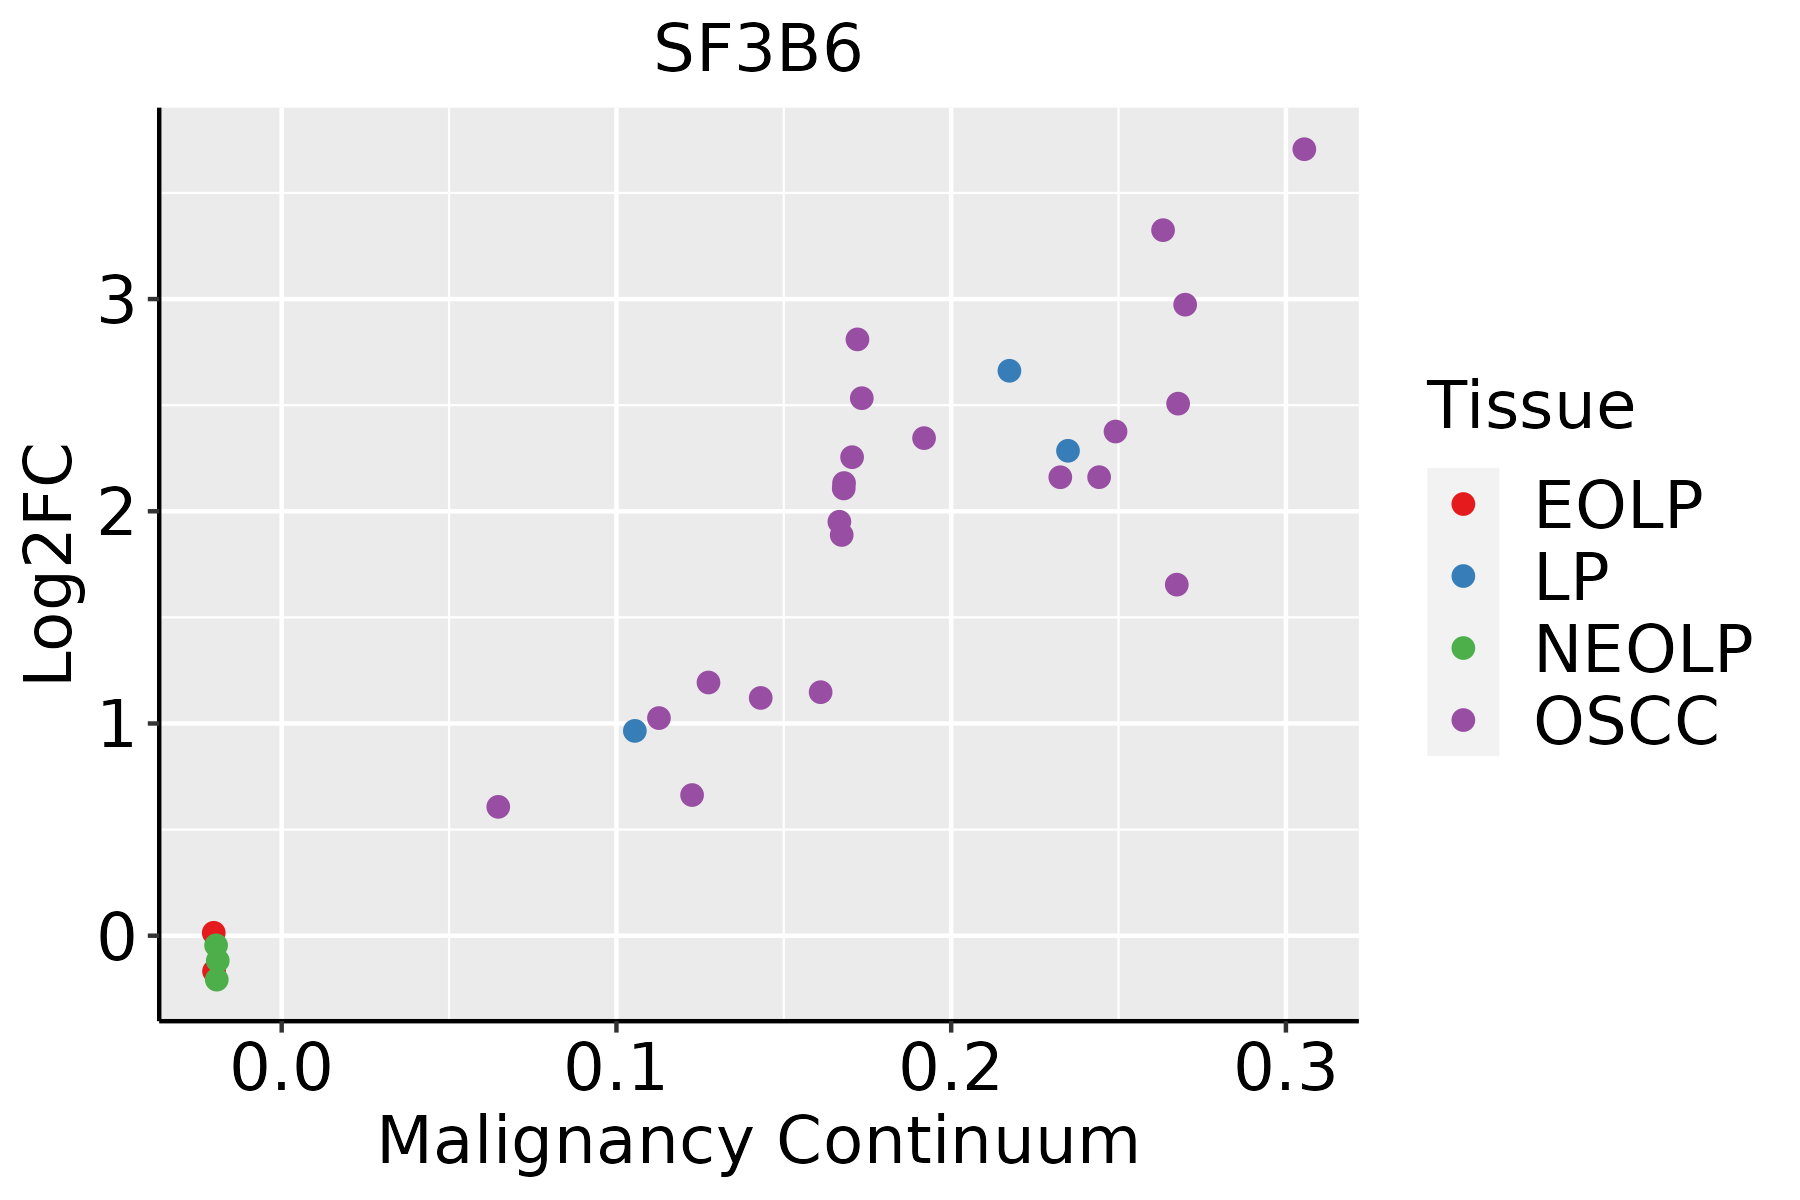 | EOLP: Erosive Oral lichen planus |
| LP: leukoplakia | ||
| NEOLP: Non-erosive oral lichen planus | ||
| OSCC: Oral squamous cell carcinoma | ||
| Prostate | 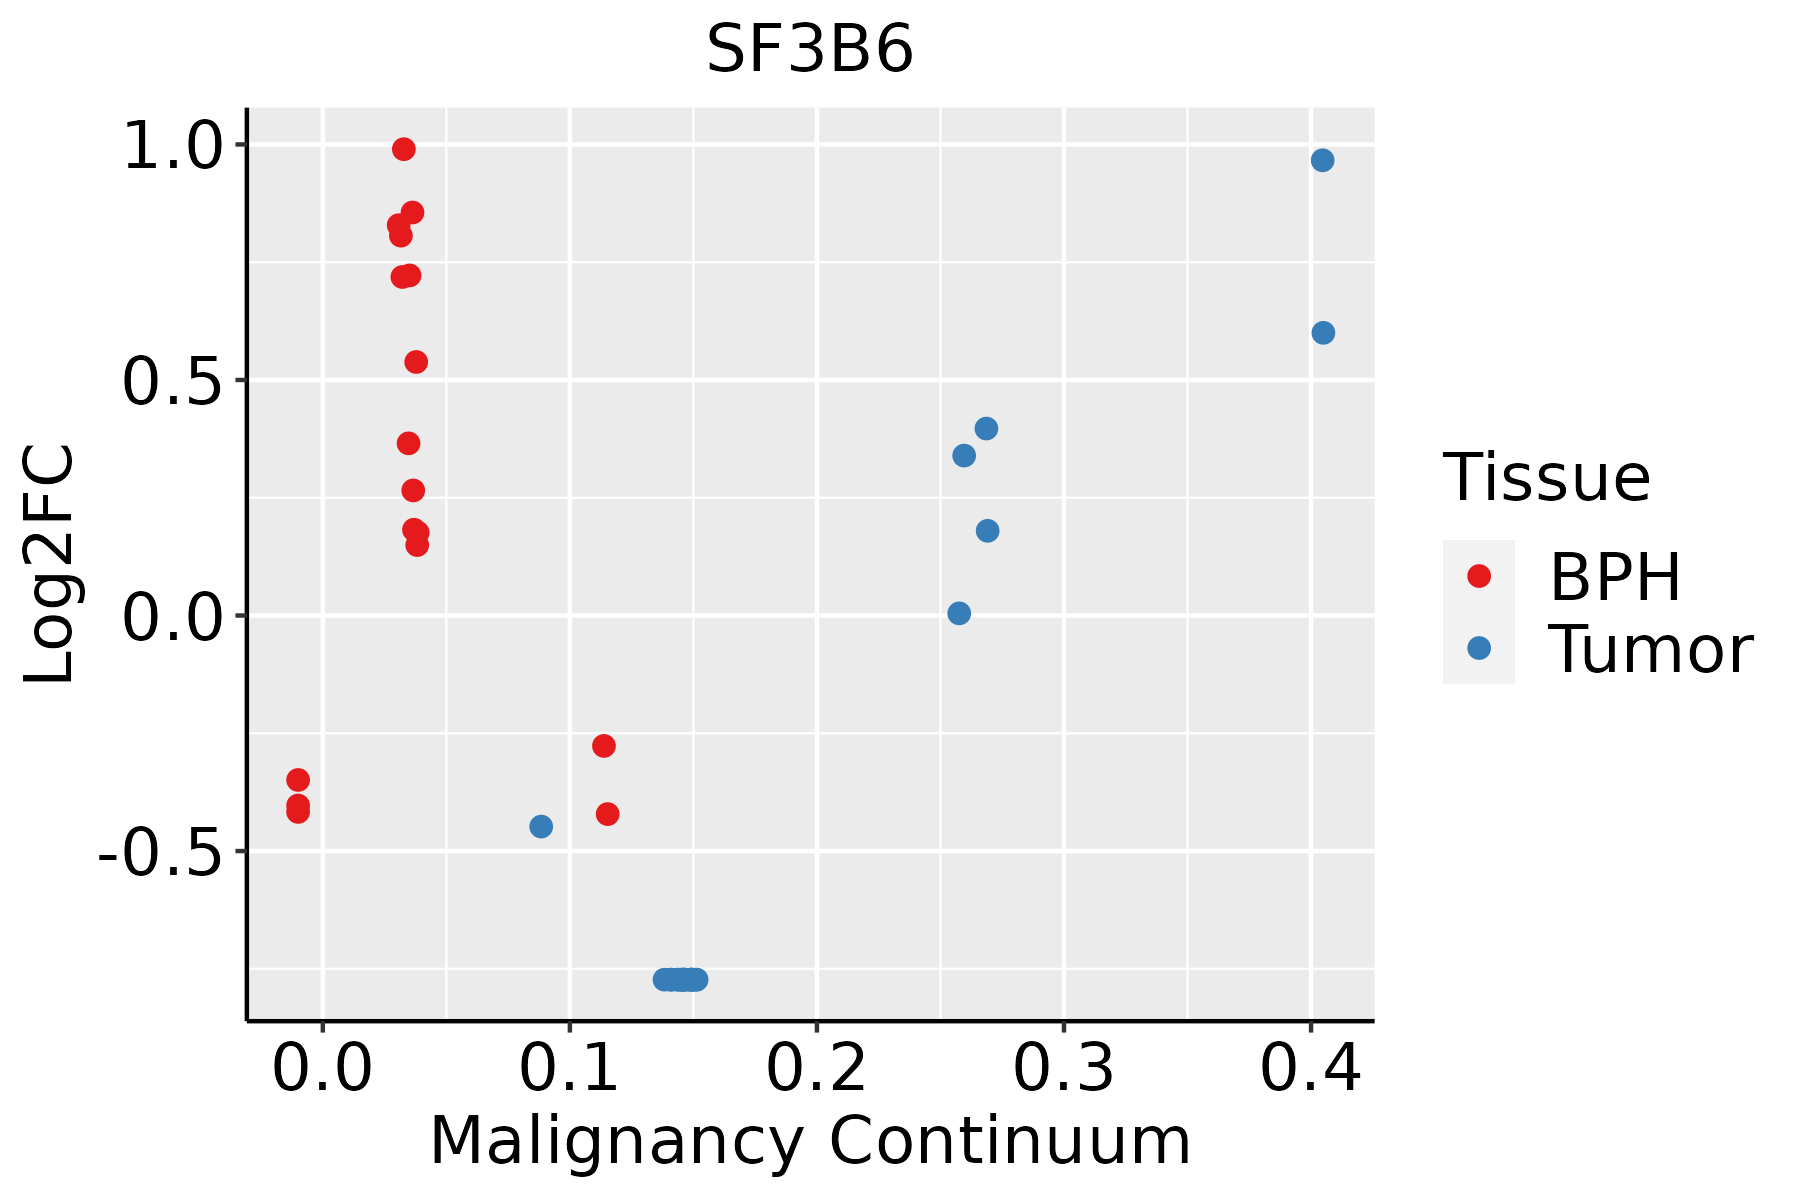 | BPH: Benign Prostatic Hyperplasia |
| Skin |  | AK: Actinic keratosis |
| cSCC: Cutaneous squamous cell carcinoma | ||
| SCCIS:squamous cell carcinoma in situ | ||
| Thyroid |  | ATC: Anaplastic thyroid cancer |
| HT: Hashimoto's thyroiditis | ||
| PTC: Papillary thyroid cancer |
| ∗log2FC in expression of this searched gene in stem-like cells from each diseased tissue sample relative to stem-like cells in normal samples in each tissue plotted against the malignancy continuum. Samples are colored based on if they are from different disease stage. |
Top |
Malignant transformation related pathway analysis |
| Find out the enriched GO biological processes and KEGG pathways involved in transition from healthy to precancer to cancer |
| Tissue | Disease Stage | Enriched GO biological Processes |
| Colorectum | AD |  |
| Colorectum | SER |  |
| Colorectum | MSS |  |
| Colorectum | MSI-H |  |
| Colorectum | FAP |  |
| ∗Top 15 enriched GO BP terms are showed in the bar plot of each disease state in each tissue. Each row represents a significant GO biological process which is colored according to the -log10(p.adjust). |
| Page: 1 2 3 4 5 6 7 8 9 |
| GO ID | Tissue | Disease Stage | Description | Gene Ratio | Bg Ratio | pvalue | p.adjust | Count |
| GO:0008380112 | Skin | cSCC | RNA splicing | 263/4864 | 434/18723 | 2.45e-53 | 5.13e-50 | 263 |
| GO:0000375112 | Skin | cSCC | RNA splicing, via transesterification reactions | 201/4864 | 324/18723 | 4.07e-43 | 5.10e-40 | 201 |
| GO:0000377112 | Skin | cSCC | RNA splicing, via transesterification reactions with bulged adenosine as nucleophile | 197/4864 | 320/18723 | 1.45e-41 | 1.14e-38 | 197 |
| GO:0000398112 | Skin | cSCC | mRNA splicing, via spliceosome | 197/4864 | 320/18723 | 1.45e-41 | 1.14e-38 | 197 |
| GO:000170124 | Skin | cSCC | in utero embryonic development | 150/4864 | 367/18723 | 2.47e-10 | 1.04e-08 | 150 |
| GO:000182413 | Skin | cSCC | blastocyst development | 53/4864 | 106/18723 | 9.74e-08 | 2.32e-06 | 53 |
| GO:000182512 | Skin | cSCC | blastocyst formation | 21/4864 | 38/18723 | 1.17e-04 | 1.08e-03 | 21 |
| GO:00083806 | Stomach | CAG with IM | RNA splicing | 39/1050 | 434/18723 | 2.55e-03 | 2.49e-02 | 39 |
| GO:00003776 | Stomach | CAG with IM | RNA splicing, via transesterification reactions with bulged adenosine as nucleophile | 30/1050 | 320/18723 | 4.15e-03 | 3.56e-02 | 30 |
| GO:00003986 | Stomach | CAG with IM | mRNA splicing, via spliceosome | 30/1050 | 320/18723 | 4.15e-03 | 3.56e-02 | 30 |
| GO:00003756 | Stomach | CAG with IM | RNA splicing, via transesterification reactions | 30/1050 | 324/18723 | 4.95e-03 | 4.01e-02 | 30 |
| GO:000838011 | Stomach | CSG | RNA splicing | 40/1034 | 434/18723 | 1.07e-03 | 1.35e-02 | 40 |
| GO:000037711 | Stomach | CSG | RNA splicing, via transesterification reactions with bulged adenosine as nucleophile | 31/1034 | 320/18723 | 1.74e-03 | 1.89e-02 | 31 |
| GO:000039811 | Stomach | CSG | mRNA splicing, via spliceosome | 31/1034 | 320/18723 | 1.74e-03 | 1.89e-02 | 31 |
| GO:000037511 | Stomach | CSG | RNA splicing, via transesterification reactions | 31/1034 | 324/18723 | 2.11e-03 | 2.17e-02 | 31 |
| GO:000838021 | Stomach | CAG | RNA splicing | 32/552 | 434/18723 | 2.08e-06 | 1.16e-04 | 32 |
| GO:000037721 | Stomach | CAG | RNA splicing, via transesterification reactions with bulged adenosine as nucleophile | 24/552 | 320/18723 | 2.97e-05 | 1.02e-03 | 24 |
| GO:000039821 | Stomach | CAG | mRNA splicing, via spliceosome | 24/552 | 320/18723 | 2.97e-05 | 1.02e-03 | 24 |
| GO:000037521 | Stomach | CAG | RNA splicing, via transesterification reactions | 24/552 | 324/18723 | 3.62e-05 | 1.18e-03 | 24 |
| GO:000838031 | Stomach | WIM | RNA splicing | 23/426 | 434/18723 | 1.66e-04 | 4.08e-03 | 23 |
| Page: 1 2 3 4 5 6 7 8 |
| Pathway ID | Tissue | Disease Stage | Description | Gene Ratio | Bg Ratio | pvalue | p.adjust | qvalue | Count |
| hsa030408 | Breast | Precancer | Spliceosome | 39/684 | 217/8465 | 1.44e-06 | 2.27e-05 | 1.74e-05 | 39 |
| hsa0304013 | Breast | Precancer | Spliceosome | 39/684 | 217/8465 | 1.44e-06 | 2.27e-05 | 1.74e-05 | 39 |
| hsa0304023 | Breast | IDC | Spliceosome | 40/867 | 217/8465 | 1.53e-04 | 1.42e-03 | 1.06e-03 | 40 |
| hsa0304033 | Breast | IDC | Spliceosome | 40/867 | 217/8465 | 1.53e-04 | 1.42e-03 | 1.06e-03 | 40 |
| hsa0304043 | Breast | DCIS | Spliceosome | 40/846 | 217/8465 | 8.97e-05 | 8.52e-04 | 6.28e-04 | 40 |
| hsa0304053 | Breast | DCIS | Spliceosome | 40/846 | 217/8465 | 8.97e-05 | 8.52e-04 | 6.28e-04 | 40 |
| hsa03040 | Colorectum | AD | Spliceosome | 73/2092 | 217/8465 | 1.73e-03 | 9.68e-03 | 6.18e-03 | 73 |
| hsa030401 | Colorectum | AD | Spliceosome | 73/2092 | 217/8465 | 1.73e-03 | 9.68e-03 | 6.18e-03 | 73 |
| hsa030402 | Colorectum | MSS | Spliceosome | 66/1875 | 217/8465 | 2.58e-03 | 1.27e-02 | 7.81e-03 | 66 |
| hsa030403 | Colorectum | MSS | Spliceosome | 66/1875 | 217/8465 | 2.58e-03 | 1.27e-02 | 7.81e-03 | 66 |
| hsa030409 | Endometrium | AEH | Spliceosome | 54/1197 | 217/8465 | 1.47e-05 | 1.65e-04 | 1.21e-04 | 54 |
| hsa0304014 | Endometrium | AEH | Spliceosome | 54/1197 | 217/8465 | 1.47e-05 | 1.65e-04 | 1.21e-04 | 54 |
| hsa0304024 | Endometrium | EEC | Spliceosome | 54/1237 | 217/8465 | 3.78e-05 | 3.88e-04 | 2.89e-04 | 54 |
| hsa0304034 | Endometrium | EEC | Spliceosome | 54/1237 | 217/8465 | 3.78e-05 | 3.88e-04 | 2.89e-04 | 54 |
| hsa0304027 | Esophagus | ESCC | Spliceosome | 128/4205 | 217/8465 | 3.31e-03 | 8.79e-03 | 4.50e-03 | 128 |
| hsa0304037 | Esophagus | ESCC | Spliceosome | 128/4205 | 217/8465 | 3.31e-03 | 8.79e-03 | 4.50e-03 | 128 |
| hsa030407 | Liver | Cirrhotic | Spliceosome | 102/2530 | 217/8465 | 5.69e-08 | 9.47e-07 | 5.84e-07 | 102 |
| hsa0304012 | Liver | Cirrhotic | Spliceosome | 102/2530 | 217/8465 | 5.69e-08 | 9.47e-07 | 5.84e-07 | 102 |
| hsa0304022 | Liver | HCC | Spliceosome | 122/4020 | 217/8465 | 5.55e-03 | 1.60e-02 | 8.91e-03 | 122 |
| hsa0304032 | Liver | HCC | Spliceosome | 122/4020 | 217/8465 | 5.55e-03 | 1.60e-02 | 8.91e-03 | 122 |
| Page: 1 2 |
Top |
Cell-cell communication analysis |
| Identification of potential cell-cell interactions between two cell types and their ligand-receptor pairs for different disease states |
| Ligand | Receptor | LRpair | Pathway | Tissue | Disease Stage |
| Page: 1 |
Top |
Single-cell gene regulatory network inference analysis |
| Find out the significant the regulons (TFs) and the target genes of each regulon across cell types for different disease states |
| TF | Cell Type | Tissue | Disease Stage | Target Gene | RSS | Regulon Activity |
| ∗The dot plots of a searched regulon are shown for all cell subpopulations in each disease state of each tissue based on the regulon specific score inferred using pySCENIC and by calculating the average expression. |
| Page: 1 |
Top |
Somatic mutation of malignant transformation related genes |
| Annotation of somatic variants for genes involved in malignant transformation |
| Hugo Symbol | Variant Class | Variant Classification | dbSNP RS | HGVSc | HGVSp | HGVSp Short | SWISSPROT | BIOTYPE | SIFT | PolyPhen | Tumor Sample Barcode | Tissue | Histology | Sex | Age | Stage | Therapy Types | Drugs | Outcome |
| SF3B6 | SNV | Missense_Mutation | novel | c.109N>C | p.Asp37His | p.D37H | Q9Y3B4 | protein_coding | deleterious(0) | probably_damaging(0.944) | TCGA-AC-A3W6-01 | Breast | breast invasive carcinoma | Female | >=65 | III/IV | Unknown | Unknown | SD |
| SF3B6 | SNV | Missense_Mutation | novel | c.139C>A | p.Gln47Lys | p.Q47K | Q9Y3B4 | protein_coding | deleterious(0) | probably_damaging(0.992) | TCGA-B6-A0IM-01 | Breast | breast invasive carcinoma | Female | >=65 | I/II | Unknown | Unknown | SD |
| SF3B6 | insertion | Nonsense_Mutation | novel | c.217_218insGCGTGAACCCCAGGGGGTGGAGCCTGCAGTGAGCCAAGAT | p.Ala73GlyfsTer11 | p.A73Gfs*11 | Q9Y3B4 | protein_coding | TCGA-A2-A0CP-01 | Breast | breast invasive carcinoma | Female | <65 | I/II | Chemotherapy | cytoxan | SD | ||
| SF3B6 | insertion | In_Frame_Ins | novel | c.152_153insTCAAGCTGACTGTCACATCAGGAATACTAA | p.Gly51_Asn52insGlnAlaAspCysHisIleArgAsnThrLys | p.G51_N52insQADCHIRNTK | Q9Y3B4 | protein_coding | TCGA-AO-A128-01 | Breast | breast invasive carcinoma | Female | <65 | I/II | Chemotherapy | doxorubicin | SD | ||
| SF3B6 | SNV | Missense_Mutation | c.13N>T | p.Ala5Ser | p.A5S | Q9Y3B4 | protein_coding | tolerated(0.41) | benign(0.001) | TCGA-CM-4743-01 | Colorectum | colon adenocarcinoma | Male | >=65 | I/II | Chemotherapy | capecitabine | SD | |
| SF3B6 | SNV | Missense_Mutation | novel | c.254N>T | p.Arg85Ile | p.R85I | Q9Y3B4 | protein_coding | deleterious(0) | probably_damaging(0.999) | TCGA-AG-A002-01 | Colorectum | rectum adenocarcinoma | Male | <65 | I/II | Unknown | Unknown | SD |
| SF3B6 | SNV | Missense_Mutation | novel | c.235G>A | p.Gly79Arg | p.G79R | Q9Y3B4 | protein_coding | deleterious(0) | probably_damaging(1) | TCGA-AX-A0J1-01 | Endometrium | uterine corpus endometrioid carcinoma | Female | >=65 | I/II | Unknown | Unknown | SD |
| SF3B6 | SNV | Missense_Mutation | novel | c.161C>A | p.Pro54His | p.P54H | Q9Y3B4 | protein_coding | deleterious(0.03) | possibly_damaging(0.784) | TCGA-77-6845-01 | Lung | lung squamous cell carcinoma | Male | >=65 | I/II | Unknown | Unknown | SD |
| SF3B6 | SNV | Missense_Mutation | novel | c.304N>A | p.Asp102Asn | p.D102N | Q9Y3B4 | protein_coding | tolerated(0.1) | benign(0.012) | TCGA-CN-6992-01 | Oral cavity | head & neck squamous cell carcinoma | Male | <65 | I/II | Chemotherapy | cisplatin | SD |
| SF3B6 | insertion | Frame_Shift_Ins | novel | c.69_70insTA | p.Arg24Ter | p.R24* | Q9Y3B4 | protein_coding | TCGA-HD-A633-01 | Oral cavity | head & neck squamous cell carcinoma | Male | >=65 | I/II | Unknown | Unknown | PD |
| Page: 1 |
Top |
Related drugs of malignant transformation related genes |
| Identification of chemicals and drugs interact with genes involved in malignant transfromation |
| (DGIdb 4.0) |
| Entrez ID | Symbol | Category | Interaction Types | Drug Claim Name | Drug Name | PMIDs |
| Page: 1 |

Copyright 2023-Present -The University of Texas Health Science Center at Houston |