
|
|||||
|
 | |
| |
| |
| |
| |
| |
|
Gene: SDR16C5 |
Gene summary for SDR16C5 |
| Gene information | Species | Human | Gene symbol | SDR16C5 | Gene ID | 195814 |
| Gene name | short chain dehydrogenase/reductase family 16C member 5 | |
| Gene Alias | EPHD-2 | |
| Cytomap | 8q12.1 | |
| Gene Type | protein-coding | GO ID | GO:0000122 | UniProtAcc | B3KT84 |
Top |
Malignant transformation analysis |
| Identification of the aberrant gene expression in precancerous and cancerous lesions by comparing the gene expression of stem-like cells in diseased tissues with normal stem cells |
| Entrez ID | Symbol | Replicates | Species | Organ | Tissue | Adj P-value | Log2FC | Malignancy |
| 195814 | SDR16C5 | HTA11_2487_2000001011 | Human | Colorectum | SER | 6.07e-05 | 2.84e-01 | -0.1808 |
| 195814 | SDR16C5 | HTA11_1938_2000001011 | Human | Colorectum | AD | 5.67e-06 | 2.72e-01 | -0.0811 |
| 195814 | SDR16C5 | HTA11_411_2000001011 | Human | Colorectum | SER | 9.67e-06 | 6.74e-01 | -0.2602 |
| 195814 | SDR16C5 | HTA11_2112_2000001011 | Human | Colorectum | SER | 7.60e-05 | 5.95e-01 | -0.2196 |
| 195814 | SDR16C5 | HTA11_6818_2000001021 | Human | Colorectum | AD | 1.78e-04 | 1.91e-01 | 0.0588 |
| 195814 | SDR16C5 | LZE5T | Human | Esophagus | ESCC | 1.70e-02 | 5.45e-01 | 0.0514 |
| 195814 | SDR16C5 | LZE20T | Human | Esophagus | ESCC | 2.24e-21 | 1.06e+00 | 0.0662 |
| 195814 | SDR16C5 | LZE24T | Human | Esophagus | ESCC | 1.64e-10 | 4.77e-01 | 0.0596 |
| 195814 | SDR16C5 | P1T-E | Human | Esophagus | ESCC | 5.43e-10 | 9.38e-01 | 0.0875 |
| 195814 | SDR16C5 | P2T-E | Human | Esophagus | ESCC | 1.47e-04 | 9.32e-02 | 0.1177 |
| 195814 | SDR16C5 | P4T-E | Human | Esophagus | ESCC | 7.51e-09 | 3.47e-01 | 0.1323 |
| 195814 | SDR16C5 | P5T-E | Human | Esophagus | ESCC | 2.00e-26 | 6.69e-01 | 0.1327 |
| 195814 | SDR16C5 | P8T-E | Human | Esophagus | ESCC | 1.53e-04 | 1.04e-01 | 0.0889 |
| 195814 | SDR16C5 | P10T-E | Human | Esophagus | ESCC | 3.41e-10 | 2.00e-01 | 0.116 |
| 195814 | SDR16C5 | P12T-E | Human | Esophagus | ESCC | 8.88e-20 | 3.31e-01 | 0.1122 |
| 195814 | SDR16C5 | P15T-E | Human | Esophagus | ESCC | 2.25e-02 | 3.69e-02 | 0.1149 |
| 195814 | SDR16C5 | P16T-E | Human | Esophagus | ESCC | 9.14e-03 | 3.16e-02 | 0.1153 |
| 195814 | SDR16C5 | P20T-E | Human | Esophagus | ESCC | 1.28e-04 | 1.09e-01 | 0.1124 |
| 195814 | SDR16C5 | P21T-E | Human | Esophagus | ESCC | 3.91e-47 | 1.00e+00 | 0.1617 |
| 195814 | SDR16C5 | P23T-E | Human | Esophagus | ESCC | 8.19e-51 | 1.84e+00 | 0.108 |
| Page: 1 2 3 4 |
| Tissue | Expression Dynamics | Abbreviation |
| Colorectum (GSE201348) |  | FAP: Familial adenomatous polyposis |
| CRC: Colorectal cancer | ||
| Colorectum (HTA11) | 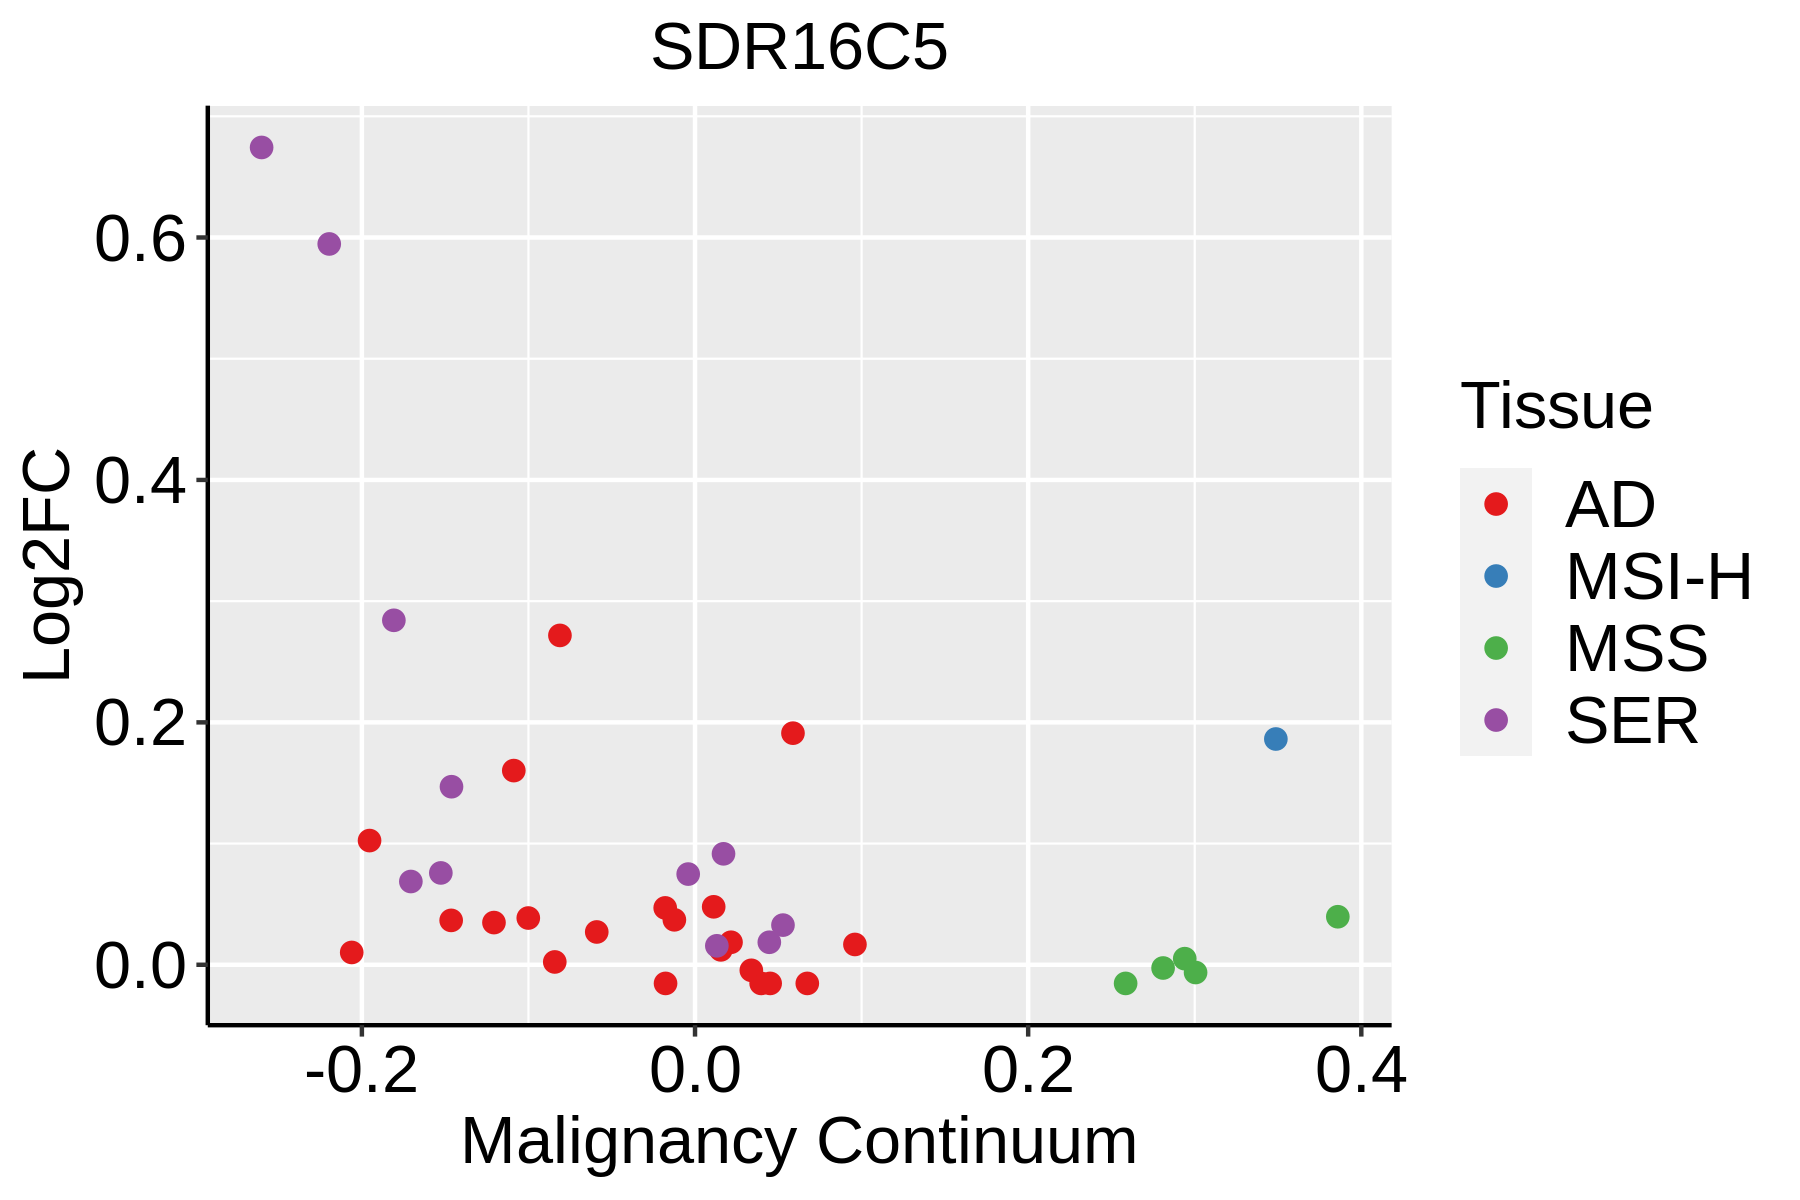 | AD: Adenomas |
| SER: Sessile serrated lesions | ||
| MSI-H: Microsatellite-high colorectal cancer | ||
| MSS: Microsatellite stable colorectal cancer | ||
| Esophagus |  | ESCC: Esophageal squamous cell carcinoma |
| HGIN: High-grade intraepithelial neoplasias | ||
| LGIN: Low-grade intraepithelial neoplasias | ||
| Oral Cavity | 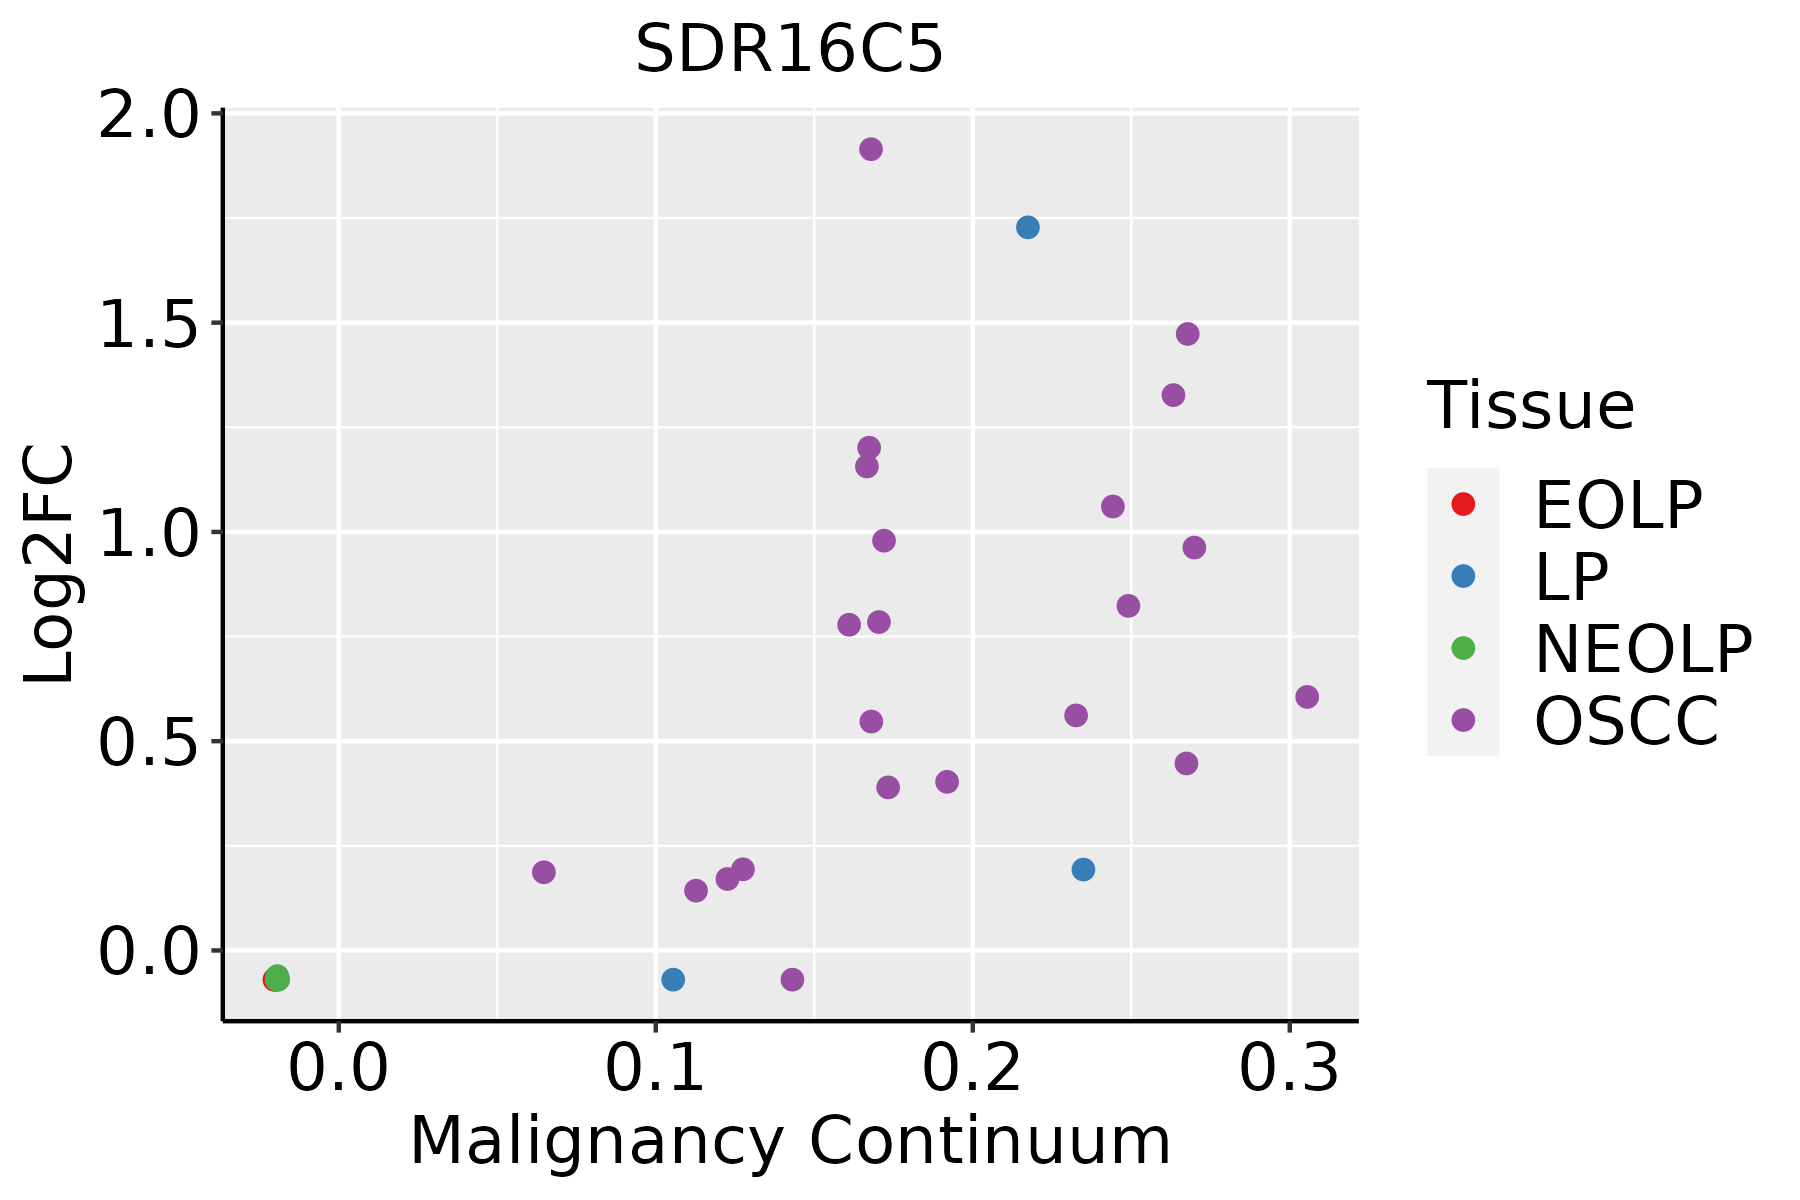 | EOLP: Erosive Oral lichen planus |
| LP: leukoplakia | ||
| NEOLP: Non-erosive oral lichen planus | ||
| OSCC: Oral squamous cell carcinoma | ||
| Skin |  | AK: Actinic keratosis |
| cSCC: Cutaneous squamous cell carcinoma | ||
| SCCIS:squamous cell carcinoma in situ |
| ∗log2FC in expression of this searched gene in stem-like cells from each diseased tissue sample relative to stem-like cells in normal samples in each tissue plotted against the malignancy continuum. Samples are colored based on if they are from different disease stage. |
Top |
Malignant transformation related pathway analysis |
| Find out the enriched GO biological processes and KEGG pathways involved in transition from healthy to precancer to cancer |
| Tissue | Disease Stage | Enriched GO biological Processes |
| Colorectum | AD |  |
| Colorectum | SER |  |
| Colorectum | MSS |  |
| Colorectum | MSI-H |  |
| Colorectum | FAP |  |
| ∗Top 15 enriched GO BP terms are showed in the bar plot of each disease state in each tissue. Each row represents a significant GO biological process which is colored according to the -log10(p.adjust). |
| Page: 1 2 3 4 5 6 7 8 9 |
| GO ID | Tissue | Disease Stage | Description | Gene Ratio | Bg Ratio | pvalue | p.adjust | Count |
| GO:00165755 | Skin | cSCC | histone deacetylation | 40/4864 | 82/18723 | 7.62e-06 | 1.04e-04 | 40 |
| GO:00903123 | Skin | cSCC | positive regulation of protein deacetylation | 17/4864 | 25/18723 | 1.27e-05 | 1.60e-04 | 17 |
| GO:00356016 | Skin | cSCC | protein deacylation | 50/4864 | 112/18723 | 1.42e-05 | 1.77e-04 | 50 |
| GO:000647514 | Skin | cSCC | internal protein amino acid acetylation | 66/4864 | 160/18723 | 1.72e-05 | 2.07e-04 | 66 |
| GO:001839314 | Skin | cSCC | internal peptidyl-lysine acetylation | 65/4864 | 158/18723 | 2.19e-05 | 2.54e-04 | 65 |
| GO:00064766 | Skin | cSCC | protein deacetylation | 45/4864 | 101/18723 | 3.97e-05 | 4.26e-04 | 45 |
| GO:00987326 | Skin | cSCC | macromolecule deacylation | 50/4864 | 116/18723 | 4.47e-05 | 4.69e-04 | 50 |
| GO:001657313 | Skin | cSCC | histone acetylation | 62/4864 | 152/18723 | 4.54e-05 | 4.75e-04 | 62 |
| GO:00310653 | Skin | cSCC | positive regulation of histone deacetylation | 13/4864 | 19/18723 | 1.27e-04 | 1.16e-03 | 13 |
| GO:004361621 | Skin | cSCC | keratinocyte proliferation | 24/4864 | 46/18723 | 1.32e-04 | 1.19e-03 | 24 |
| GO:190198313 | Skin | cSCC | regulation of protein acetylation | 34/4864 | 77/18723 | 4.10e-04 | 3.18e-03 | 34 |
| GO:00060819 | Skin | cSCC | cellular aldehyde metabolic process | 28/4864 | 60/18723 | 4.35e-04 | 3.36e-03 | 28 |
| GO:200075613 | Skin | cSCC | regulation of peptidyl-lysine acetylation | 29/4864 | 63/18723 | 4.61e-04 | 3.50e-03 | 29 |
| GO:00310632 | Skin | cSCC | regulation of histone deacetylation | 17/4864 | 31/18723 | 5.90e-04 | 4.27e-03 | 17 |
| GO:005067324 | Skin | cSCC | epithelial cell proliferation | 144/4864 | 437/18723 | 6.07e-04 | 4.38e-03 | 144 |
| GO:00903115 | Skin | cSCC | regulation of protein deacetylation | 22/4864 | 48/18723 | 2.31e-03 | 1.35e-02 | 22 |
| GO:00350654 | Skin | cSCC | regulation of histone acetylation | 24/4864 | 54/18723 | 2.49e-03 | 1.42e-02 | 24 |
| GO:19019845 | Skin | cSCC | negative regulation of protein acetylation | 12/4864 | 24/18723 | 9.91e-03 | 4.35e-02 | 12 |
| Page: 1 2 3 4 5 6 |
| Pathway ID | Tissue | Disease Stage | Description | Gene Ratio | Bg Ratio | pvalue | p.adjust | qvalue | Count |
| hsa012405 | Esophagus | ESCC | Biosynthesis of cofactors | 97/4205 | 153/8465 | 3.88e-04 | 1.35e-03 | 6.94e-04 | 97 |
| hsa0124012 | Esophagus | ESCC | Biosynthesis of cofactors | 97/4205 | 153/8465 | 3.88e-04 | 1.35e-03 | 6.94e-04 | 97 |
| hsa012404 | Oral cavity | OSCC | Biosynthesis of cofactors | 88/3704 | 153/8465 | 3.84e-04 | 1.20e-03 | 6.12e-04 | 88 |
| hsa0124011 | Oral cavity | OSCC | Biosynthesis of cofactors | 88/3704 | 153/8465 | 3.84e-04 | 1.20e-03 | 6.12e-04 | 88 |
| hsa0124021 | Oral cavity | LP | Biosynthesis of cofactors | 57/2418 | 153/8465 | 1.17e-02 | 3.91e-02 | 2.52e-02 | 57 |
| hsa0124031 | Oral cavity | LP | Biosynthesis of cofactors | 57/2418 | 153/8465 | 1.17e-02 | 3.91e-02 | 2.52e-02 | 57 |
| Page: 1 |
Top |
Cell-cell communication analysis |
| Identification of potential cell-cell interactions between two cell types and their ligand-receptor pairs for different disease states |
| Ligand | Receptor | LRpair | Pathway | Tissue | Disease Stage |
| Page: 1 |
Top |
Single-cell gene regulatory network inference analysis |
| Find out the significant the regulons (TFs) and the target genes of each regulon across cell types for different disease states |
| TF | Cell Type | Tissue | Disease Stage | Target Gene | RSS | Regulon Activity |
| ∗The dot plots of a searched regulon are shown for all cell subpopulations in each disease state of each tissue based on the regulon specific score inferred using pySCENIC and by calculating the average expression. |
| Page: 1 |
Top |
Somatic mutation of malignant transformation related genes |
| Annotation of somatic variants for genes involved in malignant transformation |
| Hugo Symbol | Variant Class | Variant Classification | dbSNP RS | HGVSc | HGVSp | HGVSp Short | SWISSPROT | BIOTYPE | SIFT | PolyPhen | Tumor Sample Barcode | Tissue | Histology | Sex | Age | Stage | Therapy Types | Drugs | Outcome |
| SDR16C5 | SNV | Missense_Mutation | novel | c.199N>G | p.Leu67Val | p.L67V | protein_coding | tolerated(0.23) | benign(0.389) | TCGA-5L-AAT1-01 | Breast | breast invasive carcinoma | Female | <65 | III/IV | Hormone Therapy | letrozol | SD | |
| SDR16C5 | SNV | Missense_Mutation | c.91N>T | p.Leu31Phe | p.L31F | protein_coding | tolerated(0.39) | benign(0.009) | TCGA-A1-A0SE-01 | Breast | breast invasive carcinoma | Female | <65 | I/II | Unknown | Unknown | SD | ||
| SDR16C5 | SNV | Missense_Mutation | c.263N>A | p.Gly88Glu | p.G88E | protein_coding | deleterious(0.01) | probably_damaging(0.977) | TCGA-AC-A23H-01 | Breast | breast invasive carcinoma | Female | >=65 | I/II | Unknown | Unknown | PD | ||
| SDR16C5 | SNV | Missense_Mutation | novel | c.587N>A | p.Ala196Glu | p.A196E | protein_coding | deleterious(0) | probably_damaging(0.98) | TCGA-AC-A8OP-01 | Breast | breast invasive carcinoma | Female | >=65 | I/II | Unknown | Unknown | SD | |
| SDR16C5 | SNV | Missense_Mutation | novel | c.878N>A | p.Ala293Asp | p.A293D | protein_coding | tolerated(0.21) | benign(0.007) | TCGA-AC-A8OR-01 | Breast | breast invasive carcinoma | Female | >=65 | I/II | Unknown | Unknown | SD | |
| SDR16C5 | SNV | Missense_Mutation | c.754N>A | p.Glu252Lys | p.E252K | protein_coding | tolerated(0.98) | benign(0.006) | TCGA-AR-A0TZ-01 | Breast | breast invasive carcinoma | Female | <65 | III/IV | Unspecific | Doxorubicin | PD | ||
| SDR16C5 | SNV | Missense_Mutation | c.694N>C | p.Glu232Gln | p.E232Q | protein_coding | tolerated(0.08) | benign(0.132) | TCGA-PL-A8LV-01 | Breast | breast invasive carcinoma | Female | <65 | III/IV | Unknown | Unknown | SD | ||
| SDR16C5 | SNV | Missense_Mutation | c.659N>C | p.Ile220Thr | p.I220T | protein_coding | deleterious(0.03) | benign(0.274) | TCGA-EK-A2PM-01 | Cervix | cervical & endocervical cancer | Female | >=65 | I/II | Unknown | Unknown | SD | ||
| SDR16C5 | SNV | Missense_Mutation | c.775N>A | p.Leu259Ile | p.L259I | protein_coding | deleterious(0.01) | probably_damaging(0.936) | TCGA-FU-A3HZ-01 | Cervix | cervical & endocervical cancer | Female | <65 | I/II | Chemotherapy | cisplatin | CR | ||
| SDR16C5 | SNV | Missense_Mutation | rs371326324 | c.280G>A | p.Ala94Thr | p.A94T | protein_coding | tolerated(0.54) | benign(0.031) | TCGA-AM-5821-01 | Colorectum | colon adenocarcinoma | Female | >=65 | I/II | Unknown | Unknown | SD |
| Page: 1 2 3 4 |
Top |
Related drugs of malignant transformation related genes |
| Identification of chemicals and drugs interact with genes involved in malignant transfromation |
| (DGIdb 4.0) |
| Entrez ID | Symbol | Category | Interaction Types | Drug Claim Name | Drug Name | PMIDs |
| Page: 1 |

Copyright 2023-Present -The University of Texas Health Science Center at Houston |