Schematic overview of the cellular and molecular mechanisms involved in the cancer progression, including the proposed cellular and molecular mechanisms in cancer cells trajectory. AT1: alveolar type 1 cells; AT2: alveolar type 2 cells; AAH: atypical adenomatous hyperplasia; AIS: adenocarcinoma in situ; MIA: minimally invasive adenocarcinoma; IA: invasive adenocarcinoma; EMT: epithelial-mesenchymal transition

Home

Download

Statistics

Help

Contact

Center for Computational Systems Medicine
leaf

Gene summary

leaf

Malignant transformation analysis

leaf

Malignant transformation related pathway analysis

leaf

Cell-cell communication analysis

leaf

Single-cell gene regulatory network inference analysis

leaf

Somatic mutation of malignant transformation related genes

leaf

Related drugs of malignant transformation related genes

Gene: RRP1

Gene summary for RRP1

check button Gene summary.

Gene informationSpeciesHuman
Gene symbol

RRP1

Gene ID

8568

Gene nameribosomal RNA processing 1
Gene AliasD21S2056E
Cytomap21q22.3
Gene Typeprotein-coding
GO ID

GO:0006139

UniProtAcc

P56182


Top

Malignant transformation analysis

check button Identification of the aberrant gene expression in precancerous and cancerous lesions by comparing the gene expression of stem-like cells in diseased tissues with normal stem cells
check button Malignant transformation involving gene list.
Entrez IDSymbolReplicatesSpeciesOrganTissueAdj P-valueLog2FCMalignancy
8568RRP1LZE2THumanEsophagusESCC6.82e-032.10e-010.082
8568RRP1LZE5THumanEsophagusESCC4.65e-051.53e-010.0514
8568RRP1LZE7THumanEsophagusESCC8.87e-144.22e-010.0667
8568RRP1LZE8THumanEsophagusESCC1.54e-102.39e-010.067
8568RRP1LZE20THumanEsophagusESCC5.48e-111.31e-010.0662
8568RRP1LZE22D1HumanEsophagusHGIN2.29e-036.43e-020.0595
8568RRP1LZE24THumanEsophagusESCC8.01e-266.53e-010.0596
8568RRP1LZE6THumanEsophagusESCC3.53e-048.97e-020.0845
8568RRP1P1T-EHumanEsophagusESCC2.50e-113.49e-010.0875
8568RRP1P2T-EHumanEsophagusESCC2.11e-224.87e-010.1177
8568RRP1P4T-EHumanEsophagusESCC2.41e-174.82e-010.1323
8568RRP1P5T-EHumanEsophagusESCC2.25e-214.93e-010.1327
8568RRP1P8T-EHumanEsophagusESCC4.70e-091.44e-010.0889
8568RRP1P9T-EHumanEsophagusESCC1.24e-102.46e-010.1131
8568RRP1P10T-EHumanEsophagusESCC4.54e-235.16e-010.116
8568RRP1P11T-EHumanEsophagusESCC2.47e-053.67e-010.1426
8568RRP1P12T-EHumanEsophagusESCC4.81e-204.41e-010.1122
8568RRP1P15T-EHumanEsophagusESCC1.66e-152.12e-010.1149
8568RRP1P16T-EHumanEsophagusESCC5.27e-234.79e-010.1153
8568RRP1P17T-EHumanEsophagusESCC4.69e-135.35e-010.1278
Page: 1 2 3 4 5 6 

check button Transcriptomic changes along malignancy continuum.
TissueExpression DynamicsAbbreviation
EsophagusThe image shows the transcriptomic changes along malignancy continuum.log2FC in expression of this searched gene in stem-like cells from each diseased tissue sample relative to stem-like cells in normal samples in each tissue plotted against the malignancy continuum. Samples are colored based on if they are from different disease stage.
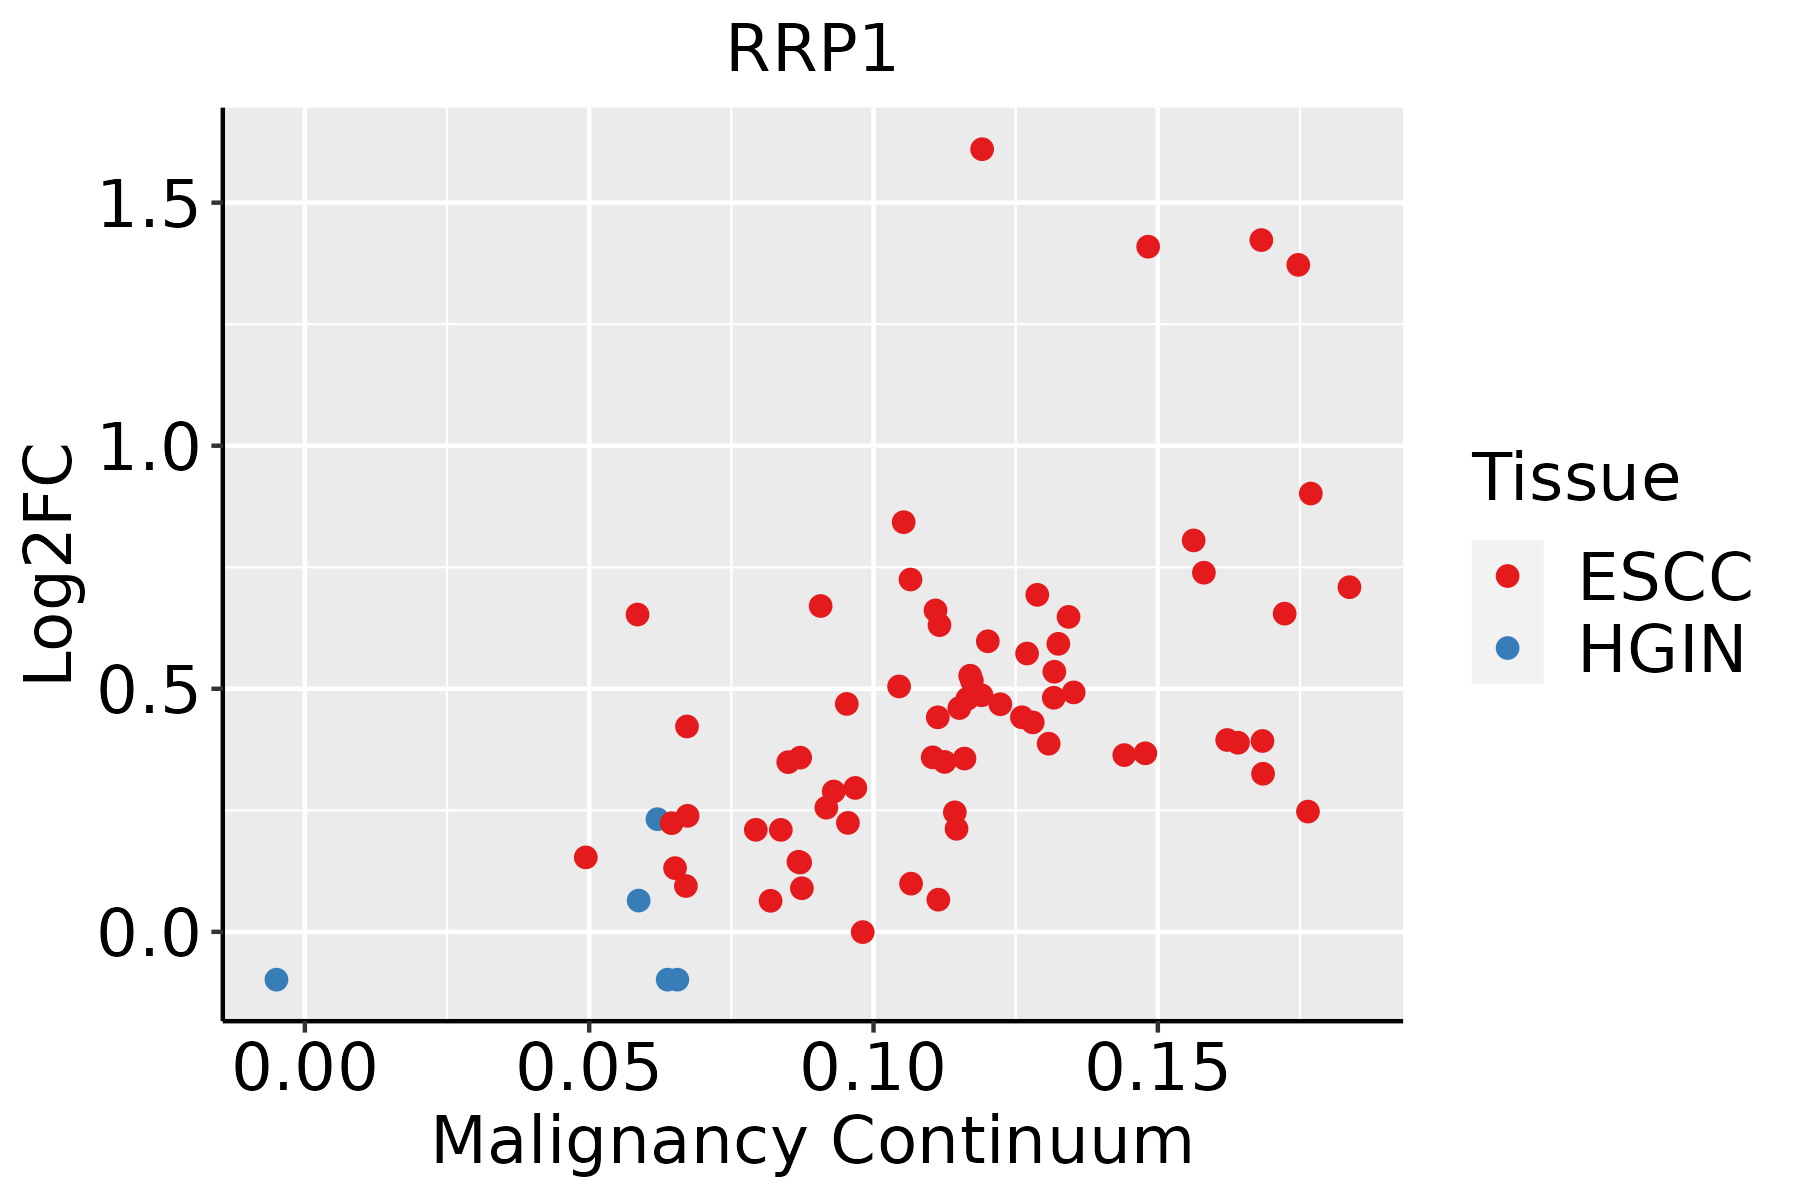
ESCC: Esophageal squamous cell carcinoma
HGIN: High-grade intraepithelial neoplasias
LGIN: Low-grade intraepithelial neoplasias
LiverThe image shows the transcriptomic changes along malignancy continuum.log2FC in expression of this searched gene in stem-like cells from each diseased tissue sample relative to stem-like cells in normal samples in each tissue plotted against the malignancy continuum. Samples are colored based on if they are from different disease stage.HCC: Hepatocellular carcinoma
NAFLD: Non-alcoholic fatty liver disease
Oral CavityThe image shows the transcriptomic changes along malignancy continuum.log2FC in expression of this searched gene in stem-like cells from each diseased tissue sample relative to stem-like cells in normal samples in each tissue plotted against the malignancy continuum. Samples are colored based on if they are from different disease stage.
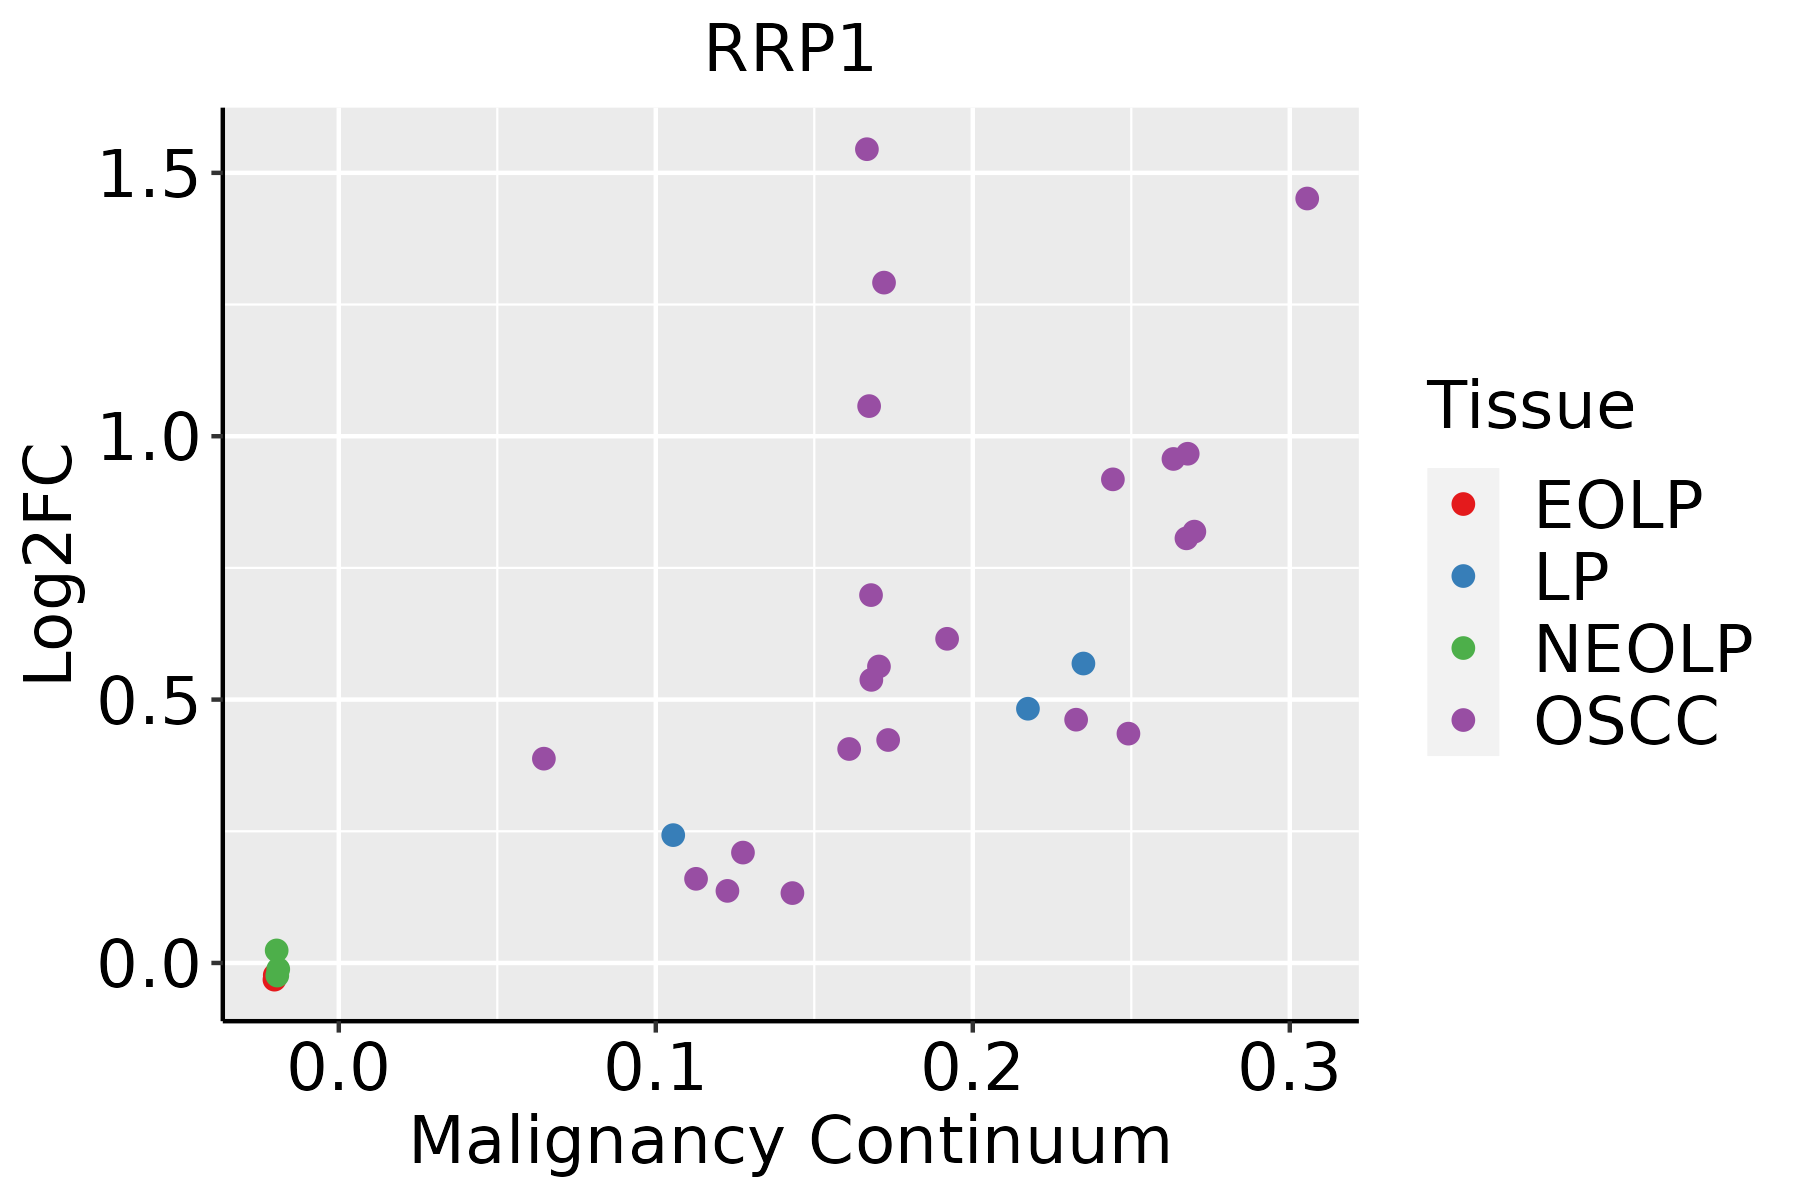
EOLP: Erosive Oral lichen planus
LP: leukoplakia
NEOLP: Non-erosive oral lichen planus
OSCC: Oral squamous cell carcinoma
SkinThe image shows the transcriptomic changes along malignancy continuum.log2FC in expression of this searched gene in stem-like cells from each diseased tissue sample relative to stem-like cells in normal samples in each tissue plotted against the malignancy continuum. Samples are colored based on if they are from different disease stage.
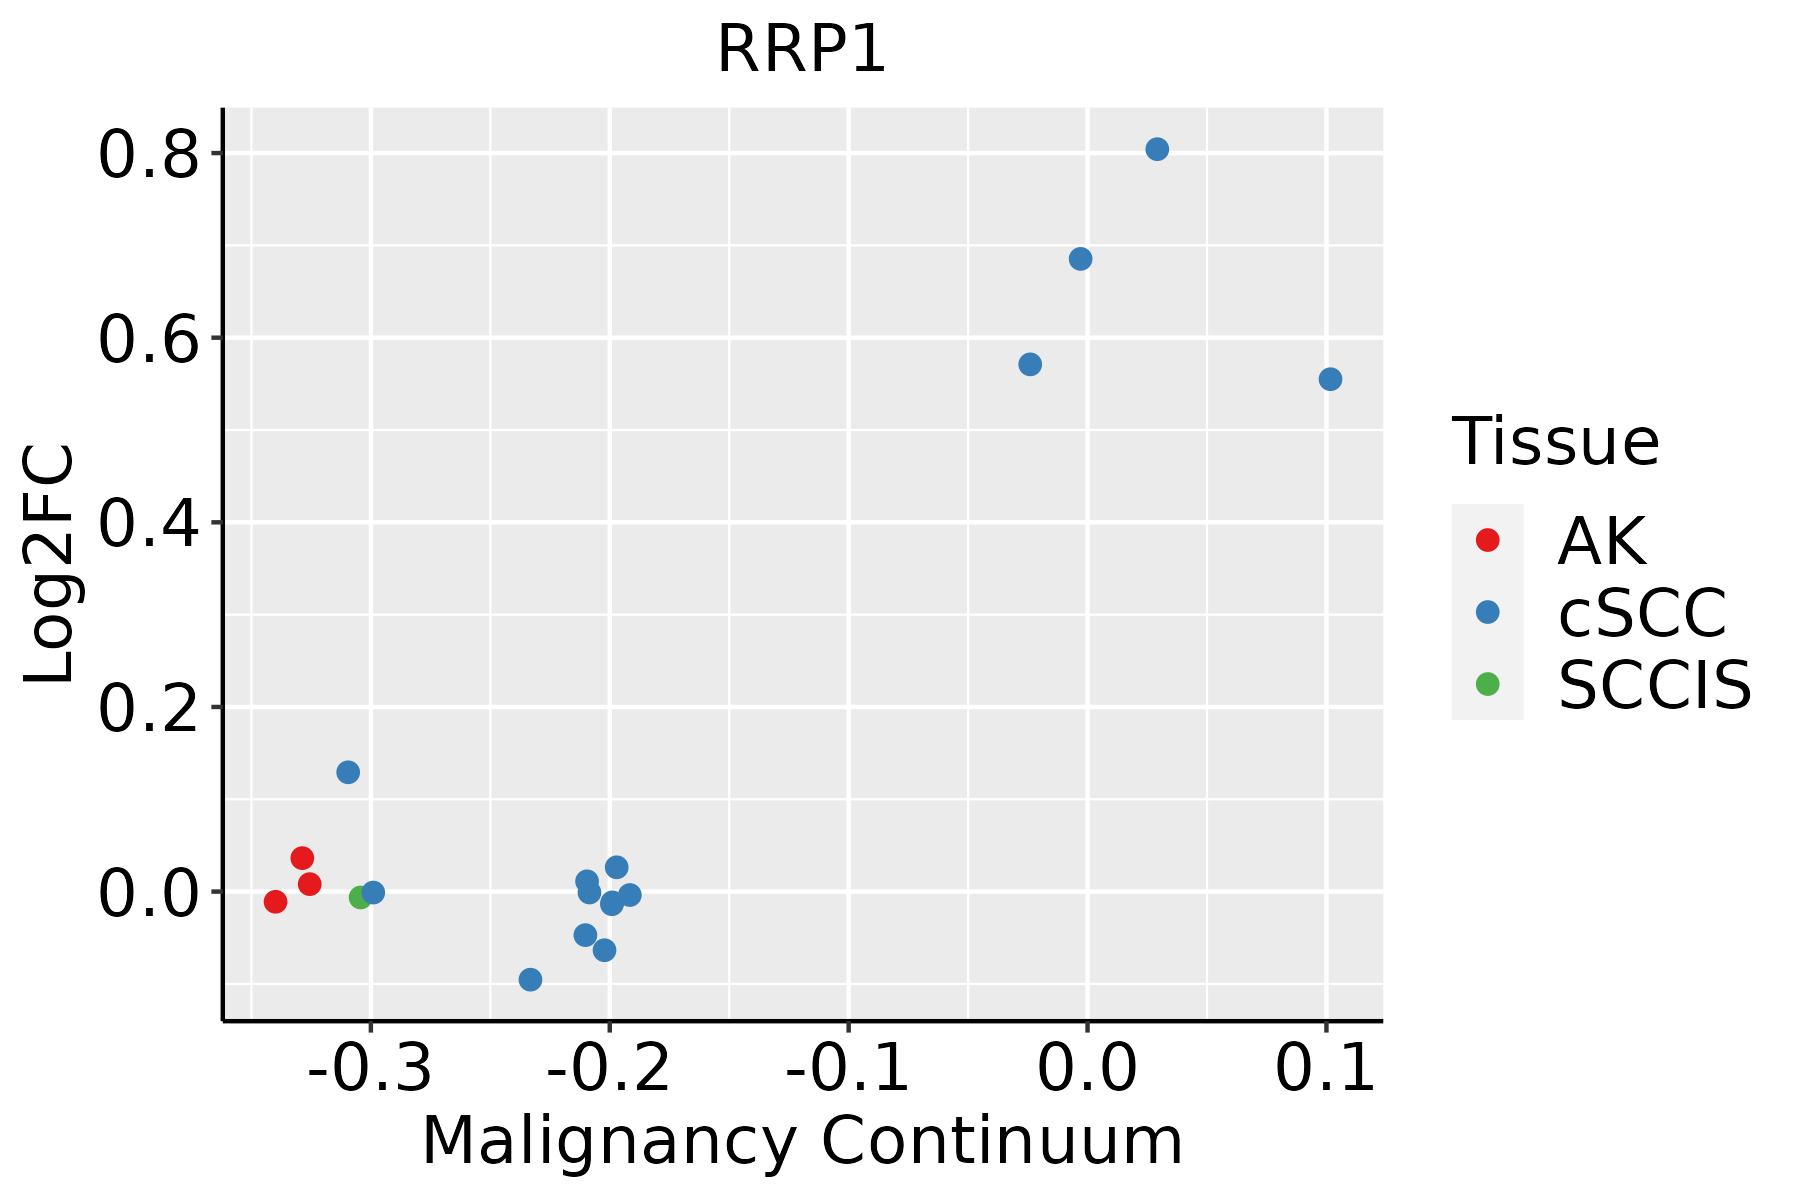
AK: Actinic keratosis
cSCC: Cutaneous squamous cell carcinoma
SCCIS:squamous cell carcinoma in situ
ThyroidThe image shows the transcriptomic changes along malignancy continuum.log2FC in expression of this searched gene in stem-like cells from each diseased tissue sample relative to stem-like cells in normal samples in each tissue plotted against the malignancy continuum. Samples are colored based on if they are from different disease stage.ATC: Anaplastic thyroid cancer
HT: Hashimoto's thyroiditis
PTC: Papillary thyroid cancer
∗log2FC in expression of this searched gene in stem-like cells from each diseased tissue sample relative to stem-like cells in normal samples in each tissue plotted against the malignancy continuum. Samples are colored based on if they are from different disease stage.

Top

Malignant transformation related pathway analysis

check buttonFind out the enriched GO biological processes and KEGG pathways involved in transition from healthy to precancer to cancer
check button Figure of enriched GO biological processes.
TissueDisease StageEnriched GO biological Processes
ColorectumADGO analysis - Figure of enriched GO biological processes: Top 15 enriched GO BP terms are showed in the bar plot of each disease state in each tissue. Each row represents a significant GO biological process which is colored according to the -log10(p.adjust).
ColorectumSERGO analysis - Figure of enriched GO biological processes: Top 15 enriched GO BP terms are showed in the bar plot of each disease state in each tissue. Each row represents a significant GO biological process which is colored according to the -log10(p.adjust).
ColorectumMSSGO analysis - Figure of enriched GO biological processes: Top 15 enriched GO BP terms are showed in the bar plot of each disease state in each tissue. Each row represents a significant GO biological process which is colored according to the -log10(p.adjust).
ColorectumMSI-HGO analysis - Figure of enriched GO biological processes: Top 15 enriched GO BP terms are showed in the bar plot of each disease state in each tissue. Each row represents a significant GO biological process which is colored according to the -log10(p.adjust).
ColorectumFAPGO analysis - Figure of enriched GO biological processes: Top 15 enriched GO BP terms are showed in the bar plot of each disease state in each tissue. Each row represents a significant GO biological process which is colored according to the -log10(p.adjust).
∗Top 15 enriched GO BP terms are showed in the bar plot of each disease state in each tissue. Each row represents a significant GO biological process which is colored according to the -log10(p.adjust).
Page: 1 2 3 4 5 6 7 8 9 

check button Enriched GO biological processes.
GO IDTissueDisease StageDescriptionGene RatioBg Ratiopvaluep.adjustCount
GO:001607224SkincSCCrRNA metabolic process158/4864236/187234.06e-402.83e-37158
GO:003447017SkincSCCncRNA processing215/4864395/187236.83e-344.28e-31215
GO:001603229SkincSCCviral process211/4864415/187237.04e-282.76e-25211
GO:003466013SkincSCCncRNA metabolic process234/4864485/187231.37e-264.77e-24234
GO:004348429SkincSCCregulation of RNA splicing97/4864148/187234.66e-241.08e-2197
GO:004227328SkincSCCribosomal large subunit biogenesis57/486472/187234.90e-218.53e-1957
GO:000961522SkincSCCresponse to virus152/4864367/187235.88e-112.75e-09152
GO:004440328SkincSCCbiological process involved in symbiotic interaction126/4864290/187236.39e-112.97e-09126
GO:000047022SkincSCCmaturation of LSU-rRNA22/486428/187238.75e-092.76e-0722
GO:001908019SkincSCCviral gene expression50/486494/187231.68e-085.04e-0750
GO:00004604SkincSCCmaturation of 5.8S rRNA25/486435/187232.34e-086.68e-0725
GO:005181715SkincSCCmodulation of process of other organism involved in symbiotic interaction38/486481/187233.88e-054.17e-0438
GO:005185116SkincSCCmodulation by host of symbiont process29/486460/187231.62e-041.42e-0329
GO:005134627SkincSCCnegative regulation of hydrolase activity130/4864379/187231.74e-041.49e-03130
GO:003582115SkincSCCmodulation of process of other organism43/4864106/187237.14e-045.03e-0343
GO:005170216SkincSCCbiological process involved in interaction with symbiont39/486494/187237.37e-045.15e-0339
GO:001908313SkincSCCviral transcription23/486450/187231.75e-031.06e-0223
GO:009858622SkincSCCcellular response to virus34/486484/187232.56e-031.45e-0234
GO:004392312SkincSCCpositive regulation by host of viral transcription9/486416/187239.73e-034.31e-029
GO:0022613113ThyroidPTCribonucleoprotein complex biogenesis292/5968463/187233.24e-442.05e-40292
Page: 1 2 3 4 5 6 7 8 9 

check button Enriched KEGG pathways.
Pathway IDTissueDisease StageDescriptionGene RatioBg Ratiopvaluep.adjustqvalueCount
Page: 1 

Top

Cell-cell communication analysis

check buttonIdentification of potential cell-cell interactions between two cell types and their ligand-receptor pairs for different disease states
LigandReceptorLRpairPathwayTissueDisease Stage
Page: 1 

Top

Single-cell gene regulatory network inference analysis

check buttonFind out the significant the regulons (TFs) and the target genes of each regulon across cell types for different disease states
TFCell TypeTissueDisease StageTarget GeneRSSRegulon Activity
∗The dot plots of a searched regulon are shown for all cell subpopulations in each disease state of each tissue based on the regulon specific score inferred using pySCENIC and by calculating the average expression.
Page: 1 

Top

Somatic mutation of malignant transformation related genes

check buttonAnnotation of somatic variants for genes involved in malignant transformation
Hugo SymbolVariant ClassVariant ClassificationdbSNP RSHGVScHGVSpHGVSp ShortSWISSPROTBIOTYPESIFTPolyPhenTumor Sample BarcodeTissueHistologySexAgeStageTherapy TypesDrugsOutcome
RRP1SNVMissense_Mutationnovelc.272N>Tp.Ala91Valp.A91VP56182protein_codingdeleterious(0.02)benign(0.255)TCGA-AN-A046-01Breastbreast invasive carcinomaFemale>=65I/IIUnknownUnknownSD
RRP1SNVMissense_Mutationc.1091N>Cp.Gln364Prop.Q364PP56182protein_codingtolerated(0.28)benign(0.006)TCGA-BH-A0HA-01Breastbreast invasive carcinomaFemale<65I/IIUnknownUnknownSD
RRP1SNVMissense_Mutationc.353N>Gp.Phe118Cysp.F118CP56182protein_codingdeleterious(0)possibly_damaging(0.905)TCGA-BH-A0HY-01Breastbreast invasive carcinomaFemale<65I/IIHormone TherapytaxotereCR
RRP1SNVMissense_Mutationc.677N>Tp.Pro226Leup.P226LP56182protein_codingdeleterious(0)probably_damaging(0.998)TCGA-E2-A15G-01Breastbreast invasive carcinomaFemale>=65I/IIHormone TherapyarimidexSD
RRP1SNVMissense_Mutationrs376330937c.985N>Tp.Arg329Trpp.R329WP56182protein_codingdeleterious(0)probably_damaging(0.913)TCGA-E2-A1BD-01Breastbreast invasive carcinomaFemale<65I/IIHormone TherapyarimidexSD
RRP1insertionNonsense_Mutationnovelc.1073_1074insCGCGTGGCGGATGGAACTGGCATAGGTTATCGp.Gln358HisfsTer9p.Q358Hfs*9P56182protein_codingTCGA-A2-A0EX-01Breastbreast invasive carcinomaFemale<65I/IIHormone TherapytamoxiphenSD
RRP1SNVMissense_Mutationc.601G>Tp.Ala201Serp.A201SP56182protein_codingdeleterious(0)probably_damaging(0.977)TCGA-EK-A2RJ-01Cervixcervical & endocervical cancerFemale<65I/IIUnknownUnknownSD
RRP1SNVMissense_Mutationnovelc.1305G>Cp.Arg435Serp.R435SP56182protein_codingdeleterious_low_confidence(0.03)benign(0.143)TCGA-MA-AA41-01Cervixcervical & endocervical cancerFemale<65I/IIUnknownUnknownSD
RRP1SNVMissense_Mutationrs367993051c.382N>Ap.Glu128Lysp.E128KP56182protein_codingdeleterious(0.01)possibly_damaging(0.833)TCGA-Q1-A6DW-01Cervixcervical & endocervical cancerFemale<65I/IIChemotherapycisplatinSD
RRP1SNVMissense_Mutationnovelc.974N>Gp.Tyr325Cysp.Y325CP56182protein_codingtolerated(0.16)probably_damaging(0.998)TCGA-AD-6895-01Colorectumcolon adenocarcinomaMale>=65III/IVUnknownUnknownSD
Page: 1 2 3 4 

Top

Related drugs of malignant transformation related genes

check buttonIdentification of chemicals and drugs interact with genes involved in malignant transfromation
(DGIdb 4.0)
Entrez IDSymbolCategoryInteraction TypesDrug Claim NameDrug NamePMIDs
Page: 1