
|
|||||
|
 | |
| |
| |
| |
| |
| |
|
Gene: ROS1 |
Gene summary for ROS1 |
| Gene information | Species | Human | Gene symbol | ROS1 | Gene ID | 6098 |
| Gene name | ROS proto-oncogene 1, receptor tyrosine kinase | |
| Gene Alias | MCF3 | |
| Cytomap | 6q22.1 | |
| Gene Type | protein-coding | GO ID | GO:0000003 | UniProtAcc | P08922 |
Top |
Malignant transformation analysis |
| Identification of the aberrant gene expression in precancerous and cancerous lesions by comparing the gene expression of stem-like cells in diseased tissues with normal stem cells |
| Entrez ID | Symbol | Replicates | Species | Organ | Tissue | Adj P-value | Log2FC | Malignancy |
| 6098 | ROS1 | P36T-E | Human | Esophagus | ESCC | 7.91e-07 | 2.65e-01 | 0.1187 |
| 6098 | ROS1 | P49T-E | Human | Esophagus | ESCC | 7.48e-03 | 5.45e-01 | 0.1768 |
| 6098 | ROS1 | P62T-E | Human | Esophagus | ESCC | 2.57e-02 | 1.28e-01 | 0.1302 |
| 6098 | ROS1 | P107T-E | Human | Esophagus | ESCC | 3.76e-35 | 9.87e-01 | 0.171 |
| 6098 | ROS1 | TD9 | Human | Lung | IAC | 2.29e-02 | 4.31e-01 | 0.088 |
| 6098 | ROS1 | RNA-P10T2-P10T2-1 | Human | Lung | AAH | 7.35e-09 | 1.29e+00 | -0.1271 |
| 6098 | ROS1 | RNA-P10T2-P10T2-2 | Human | Lung | AAH | 6.28e-12 | 1.42e+00 | -0.1406 |
| 6098 | ROS1 | RNA-P10T2-P10T2-3 | Human | Lung | AAH | 3.37e-12 | 1.43e+00 | -0.1408 |
| 6098 | ROS1 | RNA-P10T2-P10T2-4 | Human | Lung | AAH | 1.91e-14 | 1.54e+00 | -0.138 |
| 6098 | ROS1 | RNA-P17T-P17T-2 | Human | Lung | IAC | 9.92e-05 | 6.11e-01 | 0.3371 |
| 6098 | ROS1 | RNA-P17T-P17T-4 | Human | Lung | IAC | 1.21e-05 | 5.96e-01 | 0.343 |
| 6098 | ROS1 | RNA-P17T-P17T-6 | Human | Lung | IAC | 6.46e-04 | 5.65e-01 | 0.3385 |
| 6098 | ROS1 | RNA-P17T-P17T-8 | Human | Lung | IAC | 3.82e-05 | 4.47e-01 | 0.3329 |
| 6098 | ROS1 | RNA-P18T-P18T-8 | Human | Lung | IAC | 4.28e-03 | 1.25e+00 | 0.1151 |
| 6098 | ROS1 | RNA-P23T2-P23T2-1 | Human | Lung | MIAC | 5.56e-05 | 1.32e+00 | -0.037 |
| 6098 | ROS1 | RNA-P23T2-P23T2-2 | Human | Lung | MIAC | 7.61e-03 | 1.07e+00 | -0.028 |
| 6098 | ROS1 | RNA-P23T2-P23T2-4 | Human | Lung | MIAC | 1.00e-05 | 1.38e+00 | -0.0272 |
| 6098 | ROS1 | RNA-P24T2-P24T2-2 | Human | Lung | IAC | 4.40e-04 | 1.38e+00 | 0.0057 |
| 6098 | ROS1 | RNA-P25T1-P25T1-1 | Human | Lung | AIS | 5.81e-31 | 1.35e+00 | -0.2116 |
| 6098 | ROS1 | RNA-P25T1-P25T1-2 | Human | Lung | AIS | 7.54e-17 | 1.42e+00 | -0.1941 |
| Page: 1 2 |
| Tissue | Expression Dynamics | Abbreviation |
| Esophagus |  | ESCC: Esophageal squamous cell carcinoma |
| HGIN: High-grade intraepithelial neoplasias | ||
| LGIN: Low-grade intraepithelial neoplasias | ||
| Lung | 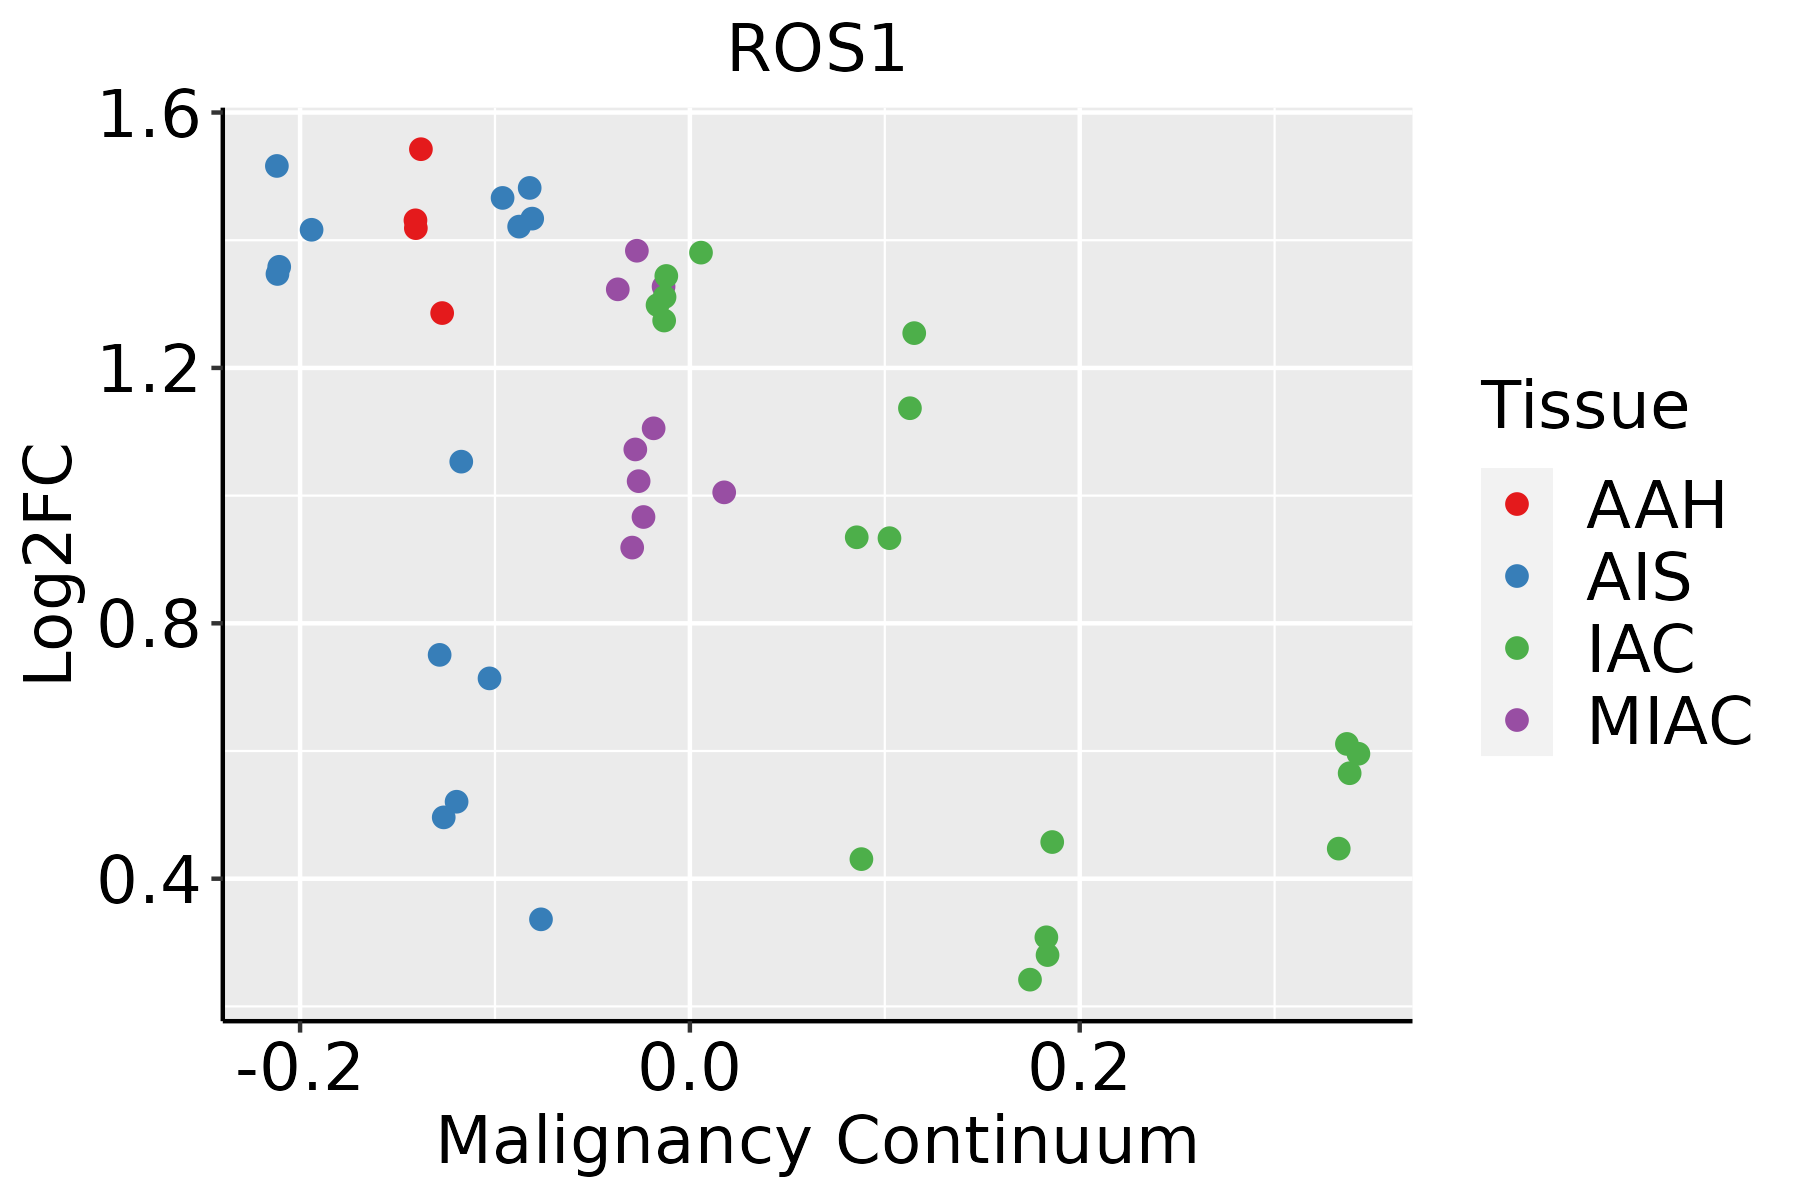 | AAH: Atypical adenomatous hyperplasia |
| AIS: Adenocarcinoma in situ | ||
| IAC: Invasive lung adenocarcinoma | ||
| MIA: Minimally invasive adenocarcinoma |
| ∗log2FC in expression of this searched gene in stem-like cells from each diseased tissue sample relative to stem-like cells in normal samples in each tissue plotted against the malignancy continuum. Samples are colored based on if they are from different disease stage. |
Top |
Malignant transformation related pathway analysis |
| Find out the enriched GO biological processes and KEGG pathways involved in transition from healthy to precancer to cancer |
| Tissue | Disease Stage | Enriched GO biological Processes |
| Colorectum | AD |  |
| Colorectum | SER |  |
| Colorectum | MSS |  |
| Colorectum | MSI-H |  |
| Colorectum | FAP |  |
| ∗Top 15 enriched GO BP terms are showed in the bar plot of each disease state in each tissue. Each row represents a significant GO biological process which is colored according to the -log10(p.adjust). |
| Page: 1 2 3 4 5 6 7 8 9 |
| GO ID | Tissue | Disease Stage | Description | Gene Ratio | Bg Ratio | pvalue | p.adjust | Count |
| GO:005254734 | Thyroid | ATC | regulation of peptidase activity | 200/6293 | 461/18723 | 6.25e-06 | 6.52e-05 | 200 |
| GO:005254834 | Thyroid | ATC | regulation of endopeptidase activity | 181/6293 | 432/18723 | 1.70e-04 | 1.16e-03 | 181 |
| GO:004586134 | Thyroid | ATC | negative regulation of proteolysis | 146/6293 | 351/18723 | 9.84e-04 | 5.22e-03 | 146 |
| GO:005134629 | Thyroid | ATC | negative regulation of hydrolase activity | 155/6293 | 379/18723 | 1.64e-03 | 8.23e-03 | 155 |
| GO:000759618 | Thyroid | ATC | blood coagulation | 93/6293 | 217/18723 | 2.69e-03 | 1.23e-02 | 93 |
| GO:0061041110 | Thyroid | ATC | regulation of wound healing | 61/6293 | 134/18723 | 2.69e-03 | 1.23e-02 | 61 |
| GO:000759918 | Thyroid | ATC | hemostasis | 94/6293 | 222/18723 | 3.92e-03 | 1.70e-02 | 94 |
| GO:005081718 | Thyroid | ATC | coagulation | 94/6293 | 222/18723 | 3.92e-03 | 1.70e-02 | 94 |
| GO:1903034111 | Thyroid | ATC | regulation of response to wounding | 71/6293 | 167/18723 | 9.88e-03 | 3.61e-02 | 71 |
| GO:0050878112 | Thyroid | ATC | regulation of body fluid levels | 149/6293 | 379/18723 | 1.08e-02 | 3.90e-02 | 149 |
| Page: 1 2 3 4 5 6 |
| Pathway ID | Tissue | Disease Stage | Description | Gene Ratio | Bg Ratio | pvalue | p.adjust | qvalue | Count |
| Page: 1 |
Top |
Cell-cell communication analysis |
| Identification of potential cell-cell interactions between two cell types and their ligand-receptor pairs for different disease states |
| Ligand | Receptor | LRpair | Pathway | Tissue | Disease Stage |
| Page: 1 |
Top |
Single-cell gene regulatory network inference analysis |
| Find out the significant the regulons (TFs) and the target genes of each regulon across cell types for different disease states |
| TF | Cell Type | Tissue | Disease Stage | Target Gene | RSS | Regulon Activity |
| ∗The dot plots of a searched regulon are shown for all cell subpopulations in each disease state of each tissue based on the regulon specific score inferred using pySCENIC and by calculating the average expression. |
| Page: 1 |
Top |
Somatic mutation of malignant transformation related genes |
| Annotation of somatic variants for genes involved in malignant transformation |
| Hugo Symbol | Variant Class | Variant Classification | dbSNP RS | HGVSc | HGVSp | HGVSp Short | SWISSPROT | BIOTYPE | SIFT | PolyPhen | Tumor Sample Barcode | Tissue | Histology | Sex | Age | Stage | Therapy Types | Drugs | Outcome |
| ROS1 | SNV | Missense_Mutation | c.580N>T | p.Pro194Ser | p.P194S | P08922 | protein_coding | deleterious(0) | benign(0.433) | TCGA-A2-A0CR-01 | Breast | breast invasive carcinoma | Female | <65 | I/II | Chemotherapy | adriamycin | CR | |
| ROS1 | SNV | Missense_Mutation | novel | c.4714A>C | p.Thr1572Pro | p.T1572P | P08922 | protein_coding | deleterious(0) | benign(0.211) | TCGA-A2-A1FW-01 | Breast | breast invasive carcinoma | Female | <65 | III/IV | Chemotherapy | cytoxan | SD |
| ROS1 | SNV | Missense_Mutation | c.1786N>A | p.Glu596Lys | p.E596K | P08922 | protein_coding | tolerated_low_confidence(0.71) | benign(0.014) | TCGA-A8-A095-01 | Breast | breast invasive carcinoma | Female | <65 | I/II | Chemotherapy | 5-fluorouracil | CR | |
| ROS1 | SNV | Missense_Mutation | c.3546N>T | p.Arg1182Ser | p.R1182S | P08922 | protein_coding | tolerated(0.74) | benign(0.027) | TCGA-A8-A09A-01 | Breast | breast invasive carcinoma | Female | <65 | I/II | Hormone Therapy | tamoxiphen | SD | |
| ROS1 | SNV | Missense_Mutation | c.565C>T | p.His189Tyr | p.H189Y | P08922 | protein_coding | tolerated(0.36) | possibly_damaging(0.747) | TCGA-AC-A23H-01 | Breast | breast invasive carcinoma | Female | >=65 | I/II | Unknown | Unknown | PD | |
| ROS1 | SNV | Missense_Mutation | c.6797C>G | p.Thr2266Arg | p.T2266R | P08922 | protein_coding | deleterious_low_confidence(0) | possibly_damaging(0.83) | TCGA-AR-A0TP-01 | Breast | breast invasive carcinoma | Female | <65 | I/II | Chemotherapy | doxorubicin | SD | |
| ROS1 | SNV | Missense_Mutation | rs62430836 | c.3932G>A | p.Arg1311Gln | p.R1311Q | P08922 | protein_coding | tolerated(0.14) | benign(0) | TCGA-BH-A0E2-01 | Breast | breast invasive carcinoma | Female | <65 | III/IV | Chemotherapy | doxorubicin | SD |
| ROS1 | SNV | Missense_Mutation | novel | c.6443G>A | p.Gly2148Glu | p.G2148E | P08922 | protein_coding | deleterious(0) | probably_damaging(1) | TCGA-BH-A0H5-01 | Breast | breast invasive carcinoma | Female | <65 | I/II | Chemotherapy | cytoxan | CR |
| ROS1 | SNV | Missense_Mutation | c.6702C>A | p.Asn2234Lys | p.N2234K | P08922 | protein_coding | tolerated(0.92) | benign(0.015) | TCGA-BH-A18J-01 | Breast | breast invasive carcinoma | Female | <65 | III/IV | Unknown | Unknown | PD | |
| ROS1 | SNV | Missense_Mutation | rs865940125 | c.1652N>T | p.Ser551Phe | p.S551F | P08922 | protein_coding | tolerated(0.11) | benign(0.006) | TCGA-BH-A18K-01 | Breast | breast invasive carcinoma | Female | <65 | I/II | Unknown | Unknown | PD |
| Page: 1 2 3 4 5 6 7 8 9 10 11 12 13 14 15 16 17 18 19 20 21 22 23 24 25 26 27 28 29 30 31 32 33 34 35 36 |
Top |
Related drugs of malignant transformation related genes |
| Identification of chemicals and drugs interact with genes involved in malignant transfromation |
| (DGIdb 4.0) |
| Entrez ID | Symbol | Category | Interaction Types | Drug Claim Name | Drug Name | PMIDs |
| 6098 | ROS1 | TYROSINE KINASE, CLINICALLY ACTIONABLE, DRUG RESISTANCE, ENZYME, DRUGGABLE GENOME, KINASE, TRANSCRIPTION FACTOR | Imidazo[1,2-b]pyridazine derivative 2 | |||
| 6098 | ROS1 | TYROSINE KINASE, CLINICALLY ACTIONABLE, DRUG RESISTANCE, ENZYME, DRUGGABLE GENOME, KINASE, TRANSCRIPTION FACTOR | ENTRECTINIB | ENTRECTINIB | 28183697 | |
| 6098 | ROS1 | TYROSINE KINASE, CLINICALLY ACTIONABLE, DRUG RESISTANCE, ENZYME, DRUGGABLE GENOME, KINASE, TRANSCRIPTION FACTOR | inhibitor | HESPERADIN | HESPERADIN | 19035792 |
| 6098 | ROS1 | TYROSINE KINASE, CLINICALLY ACTIONABLE, DRUG RESISTANCE, ENZYME, DRUGGABLE GENOME, KINASE, TRANSCRIPTION FACTOR | CRIZOTINIB | CRIZOTINIB | 23724914,25733882,25351743,25688157,26372962 | |
| 6098 | ROS1 | TYROSINE KINASE, CLINICALLY ACTIONABLE, DRUG RESISTANCE, ENZYME, DRUGGABLE GENOME, KINASE, TRANSCRIPTION FACTOR | AZD3463 | 26372962 | ||
| 6098 | ROS1 | TYROSINE KINASE, CLINICALLY ACTIONABLE, DRUG RESISTANCE, ENZYME, DRUGGABLE GENOME, KINASE, TRANSCRIPTION FACTOR | TPX-0005 | |||
| 6098 | ROS1 | TYROSINE KINASE, CLINICALLY ACTIONABLE, DRUG RESISTANCE, ENZYME, DRUGGABLE GENOME, KINASE, TRANSCRIPTION FACTOR | inhibitor | CRIZOTINIB | CRIZOTINIB | |
| 6098 | ROS1 | TYROSINE KINASE, CLINICALLY ACTIONABLE, DRUG RESISTANCE, ENZYME, DRUGGABLE GENOME, KINASE, TRANSCRIPTION FACTOR | DS6051b | |||
| 6098 | ROS1 | TYROSINE KINASE, CLINICALLY ACTIONABLE, DRUG RESISTANCE, ENZYME, DRUGGABLE GENOME, KINASE, TRANSCRIPTION FACTOR | CYC-116 | CYC-116 | ||
| 6098 | ROS1 | TYROSINE KINASE, CLINICALLY ACTIONABLE, DRUG RESISTANCE, ENZYME, DRUGGABLE GENOME, KINASE, TRANSCRIPTION FACTOR | CRIZOTINIB | CRIZOTINIB | 29596029,23724914,25264305,24875859,25922291,22215748,25688157,26372962,25667280,30980071,29333528 |
| Page: 1 2 3 4 5 6 7 |

Copyright 2023-Present -The University of Texas Health Science Center at Houston |