| Tissue | Expression Dynamics | Abbreviation |
| Colorectum (GSE201348) | 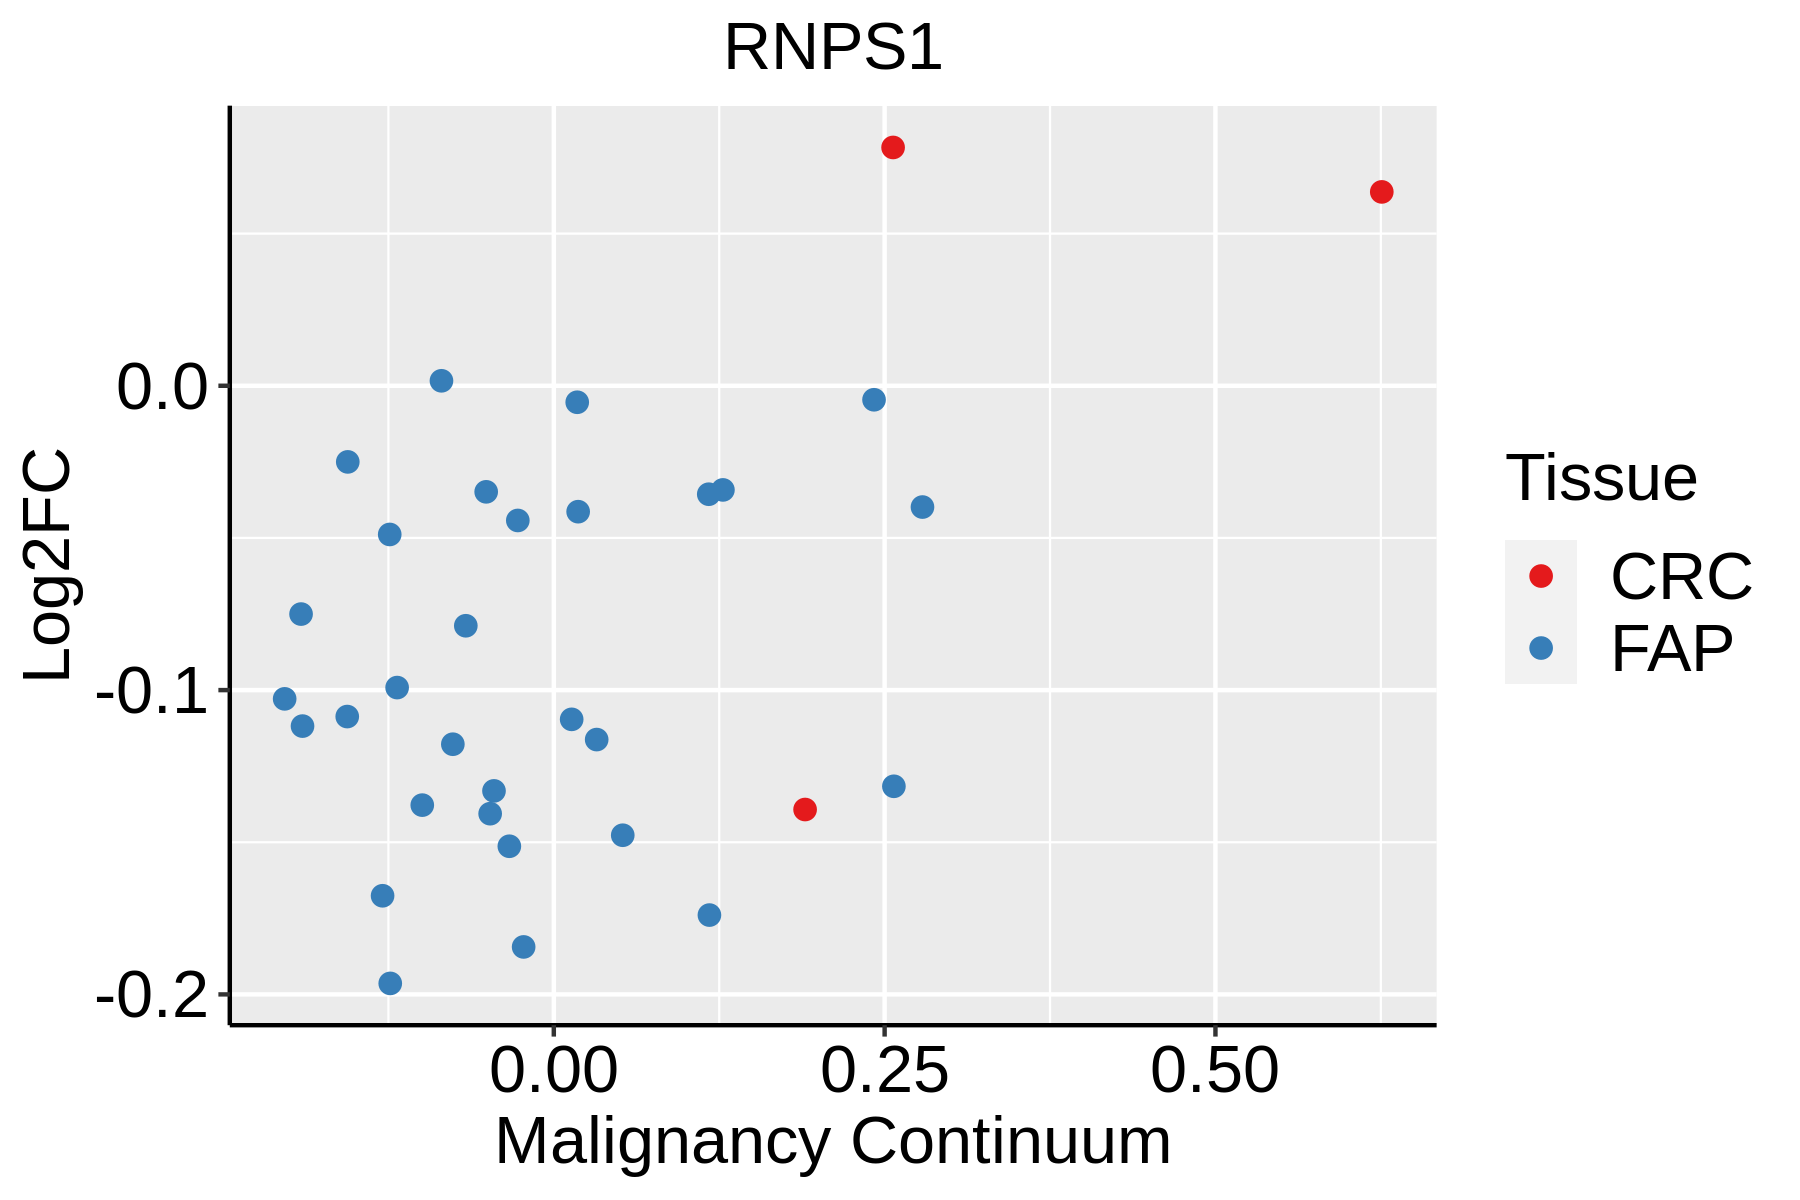 | FAP: Familial adenomatous polyposis |
| CRC: Colorectal cancer |
| Colorectum (HTA11) | 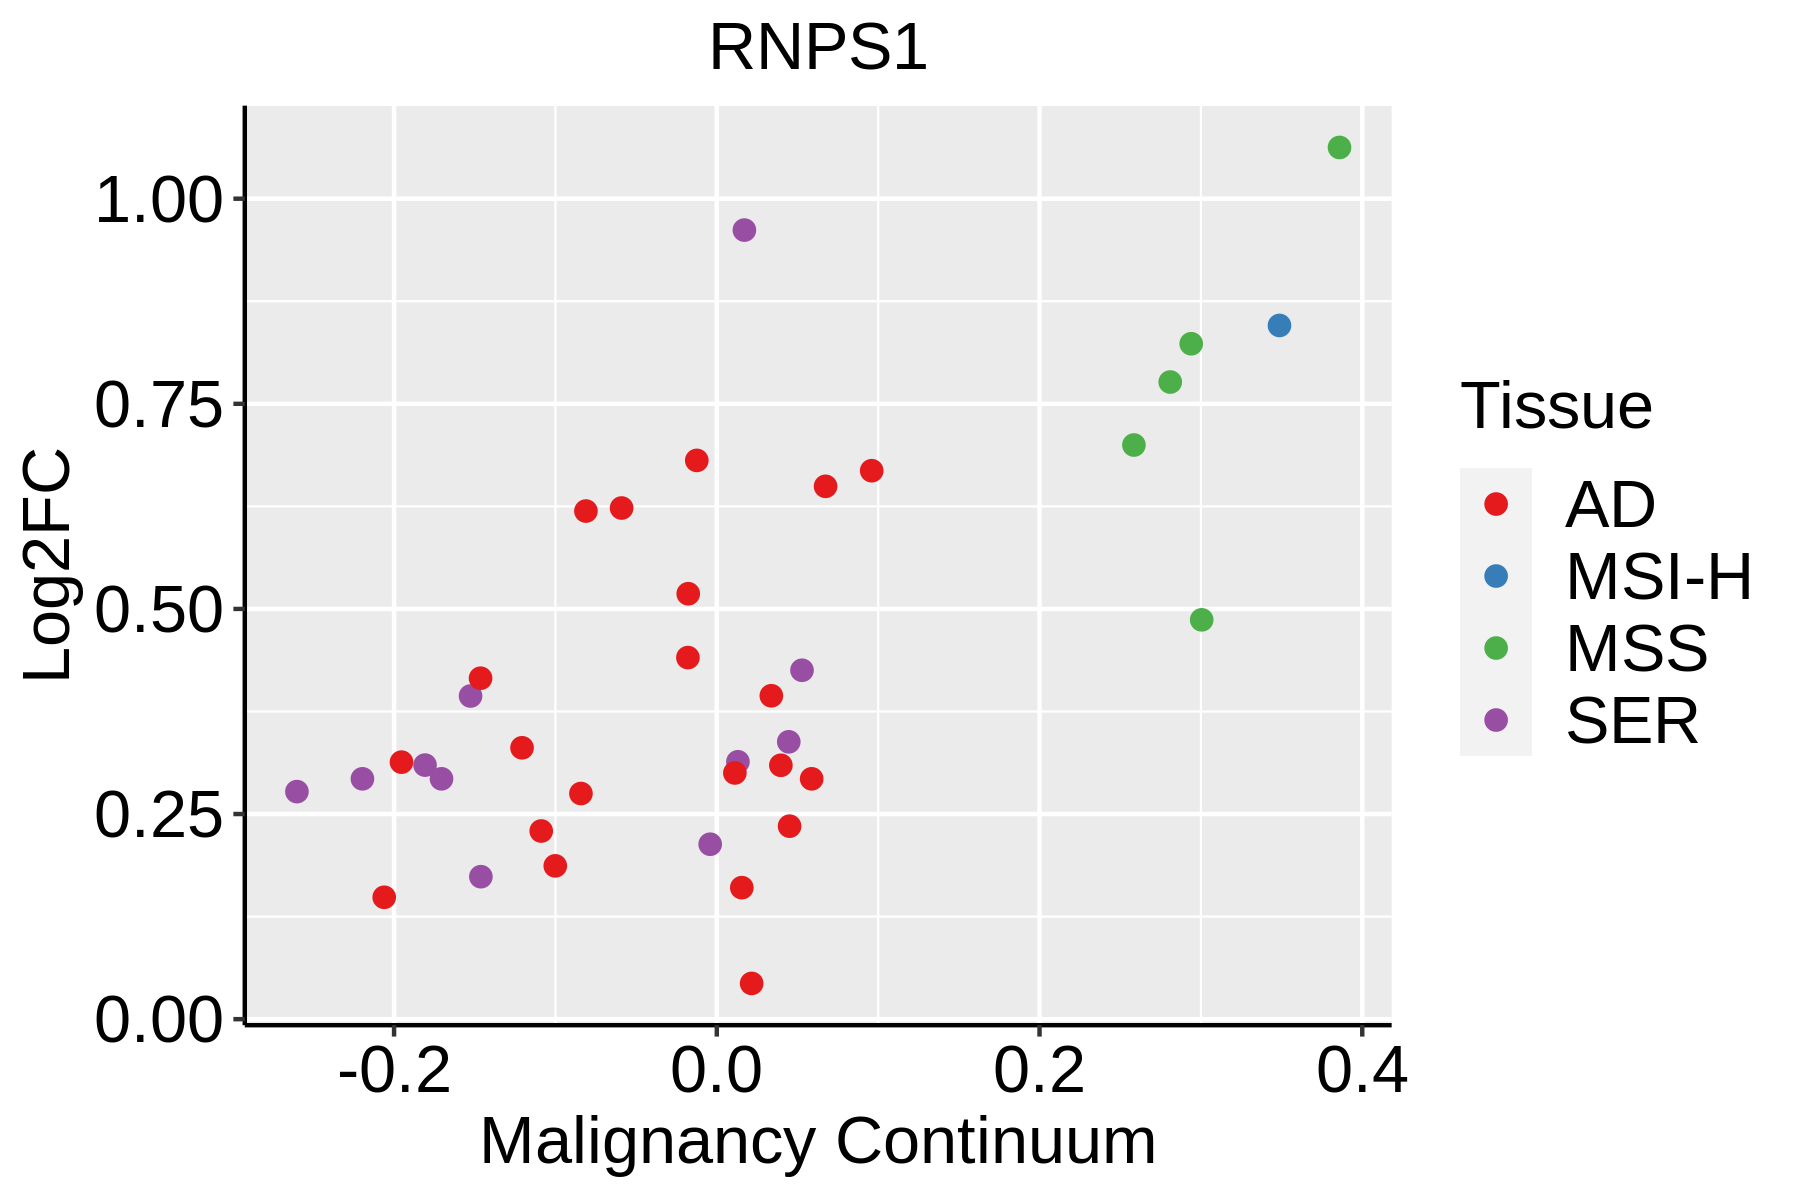 | AD: Adenomas |
| SER: Sessile serrated lesions |
| MSI-H: Microsatellite-high colorectal cancer |
| MSS: Microsatellite stable colorectal cancer |
| Endometrium | 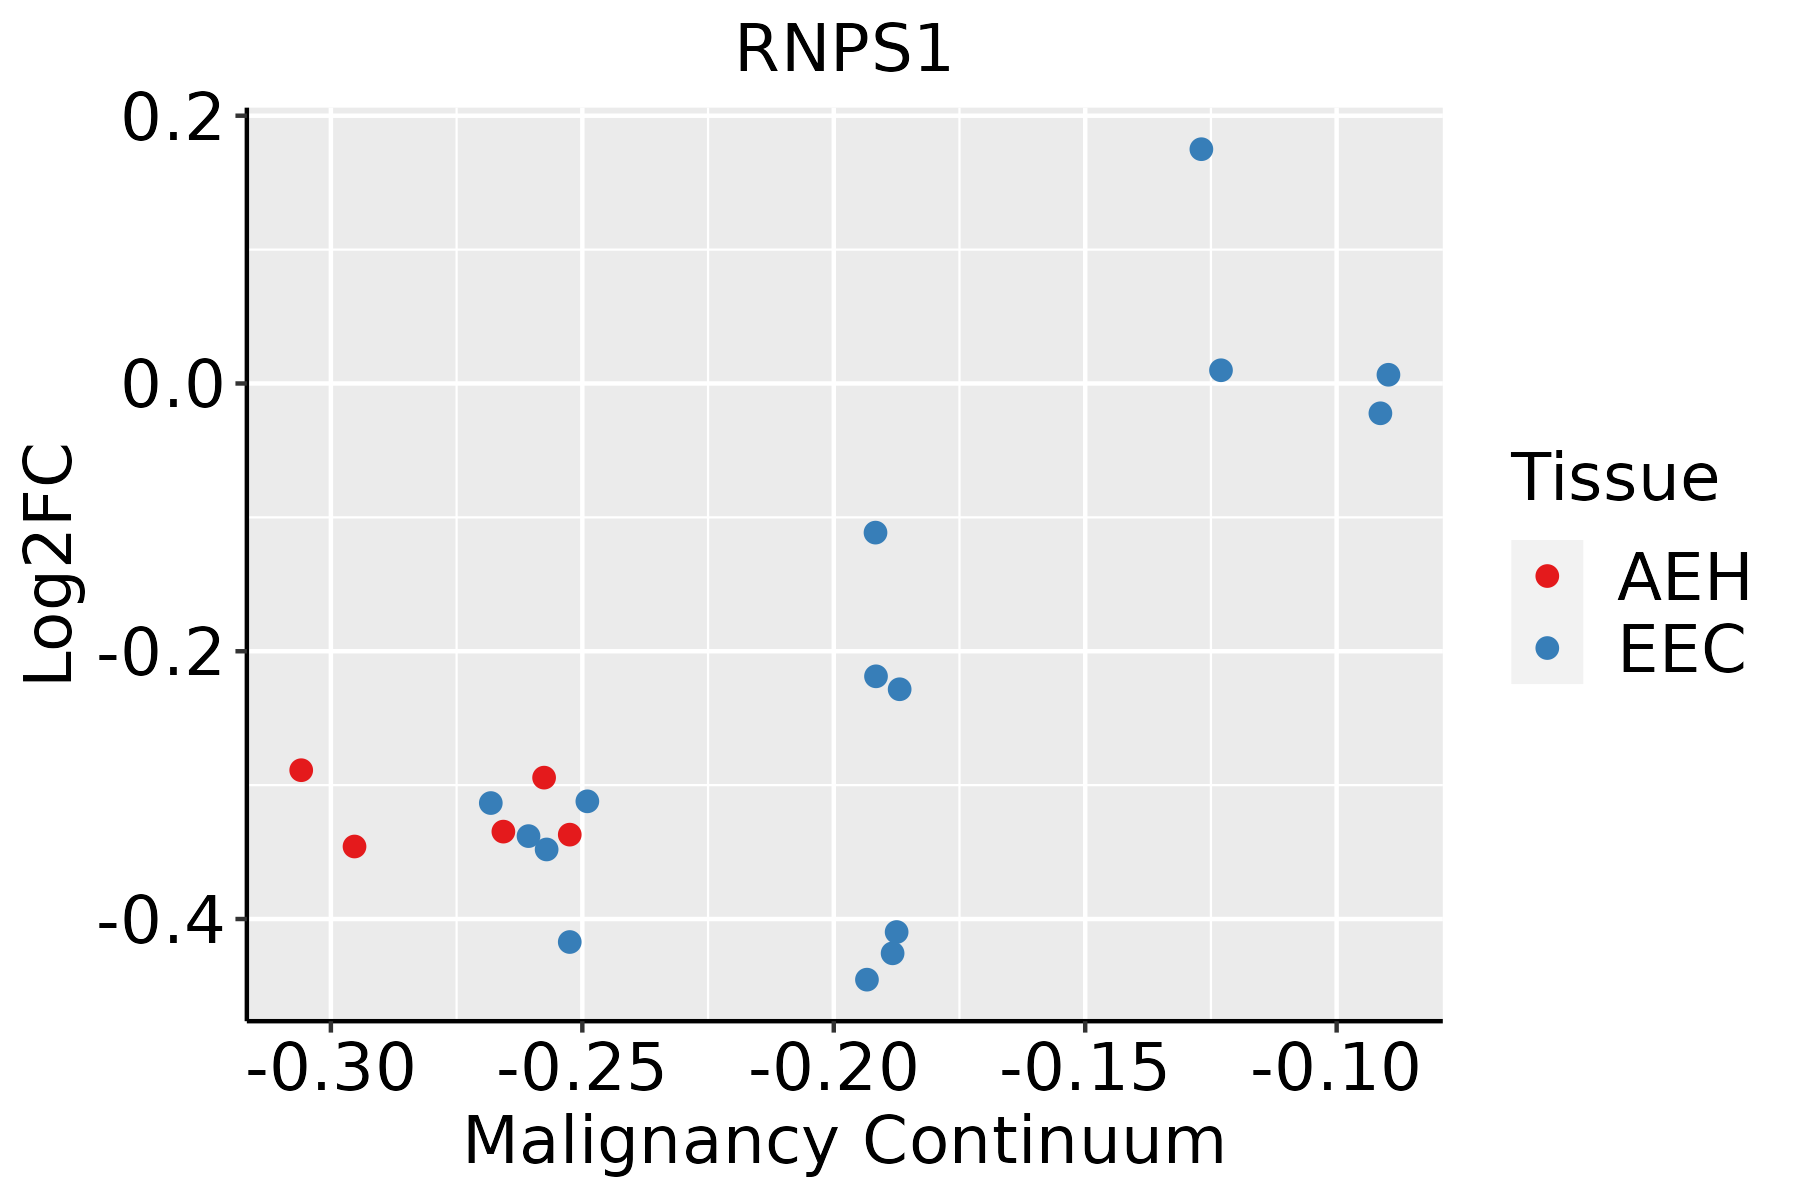 | AEH: Atypical endometrial hyperplasia |
| EEC: Endometrioid Cancer |
| Esophagus | 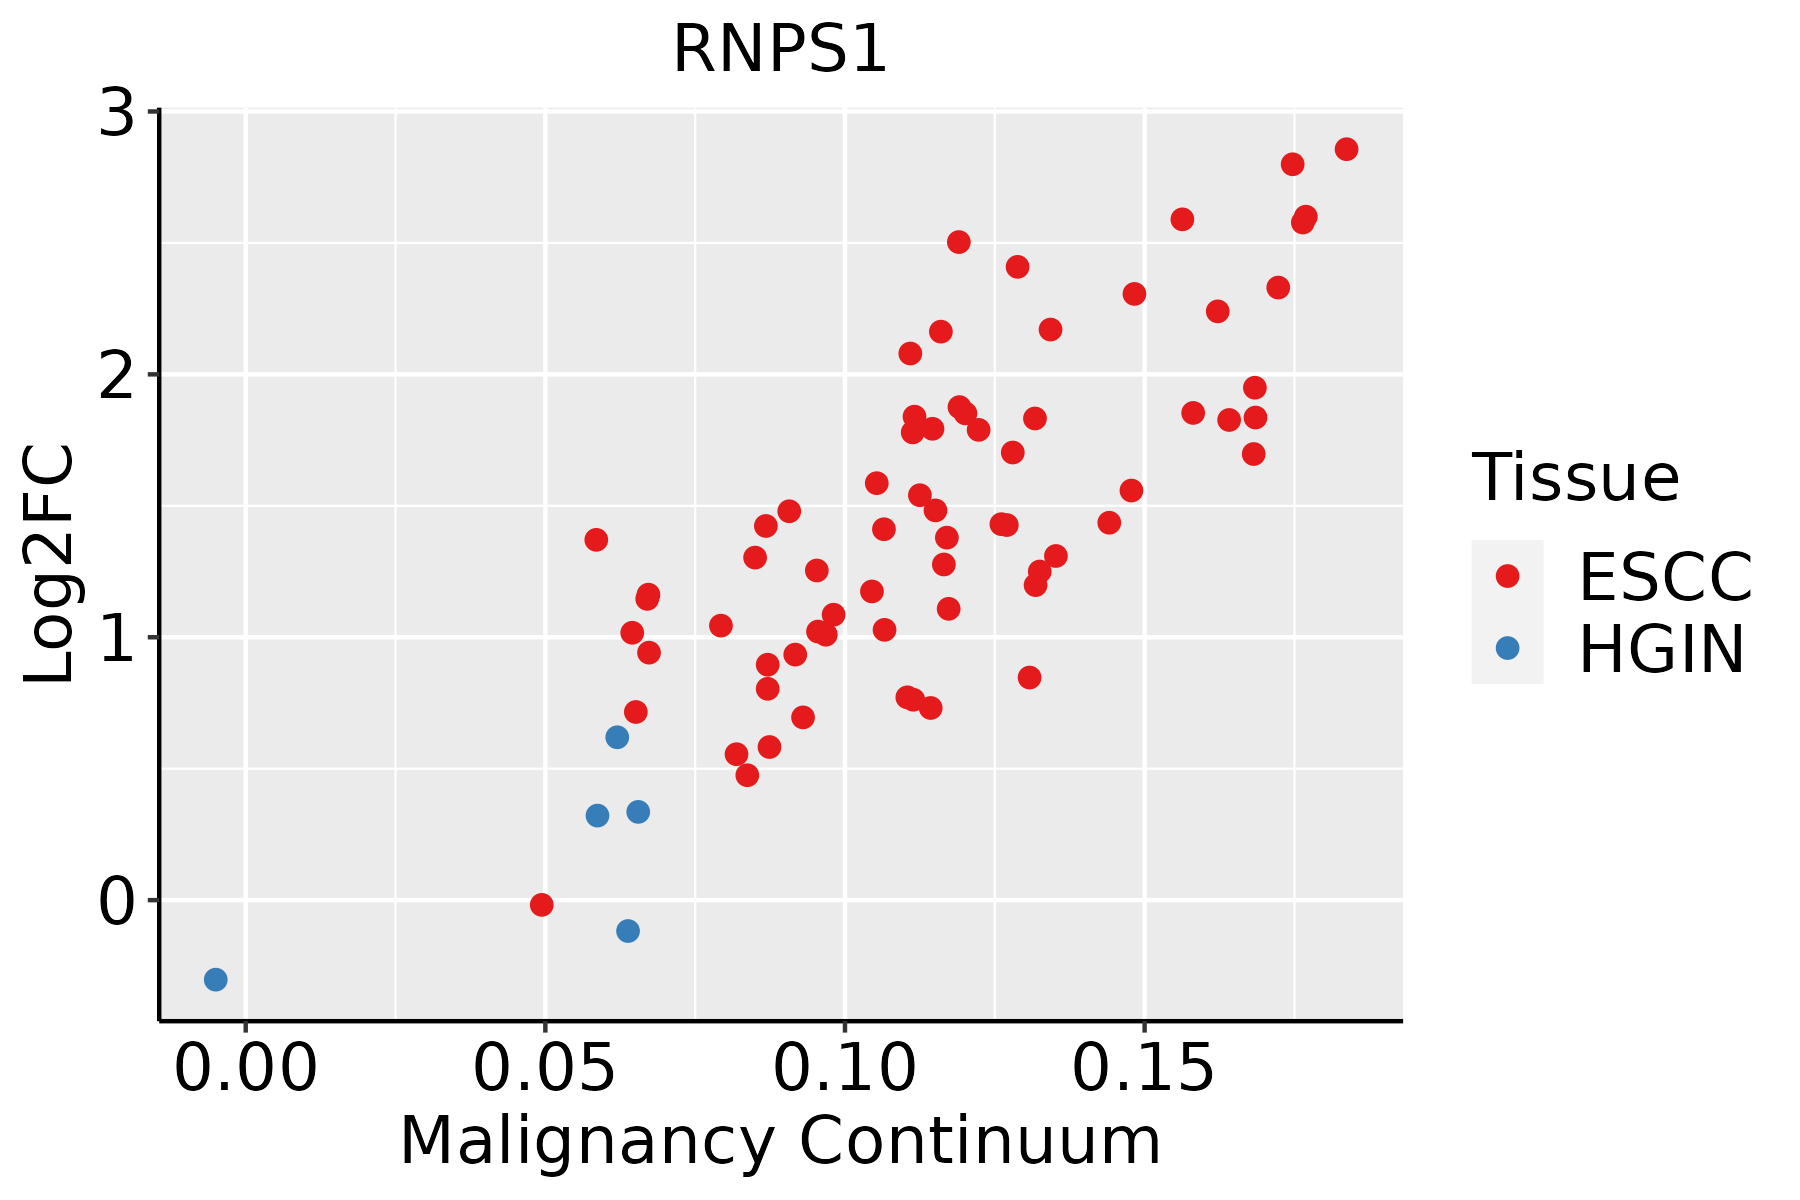 | ESCC: Esophageal squamous cell carcinoma |
| HGIN: High-grade intraepithelial neoplasias |
| LGIN: Low-grade intraepithelial neoplasias |
| Liver | 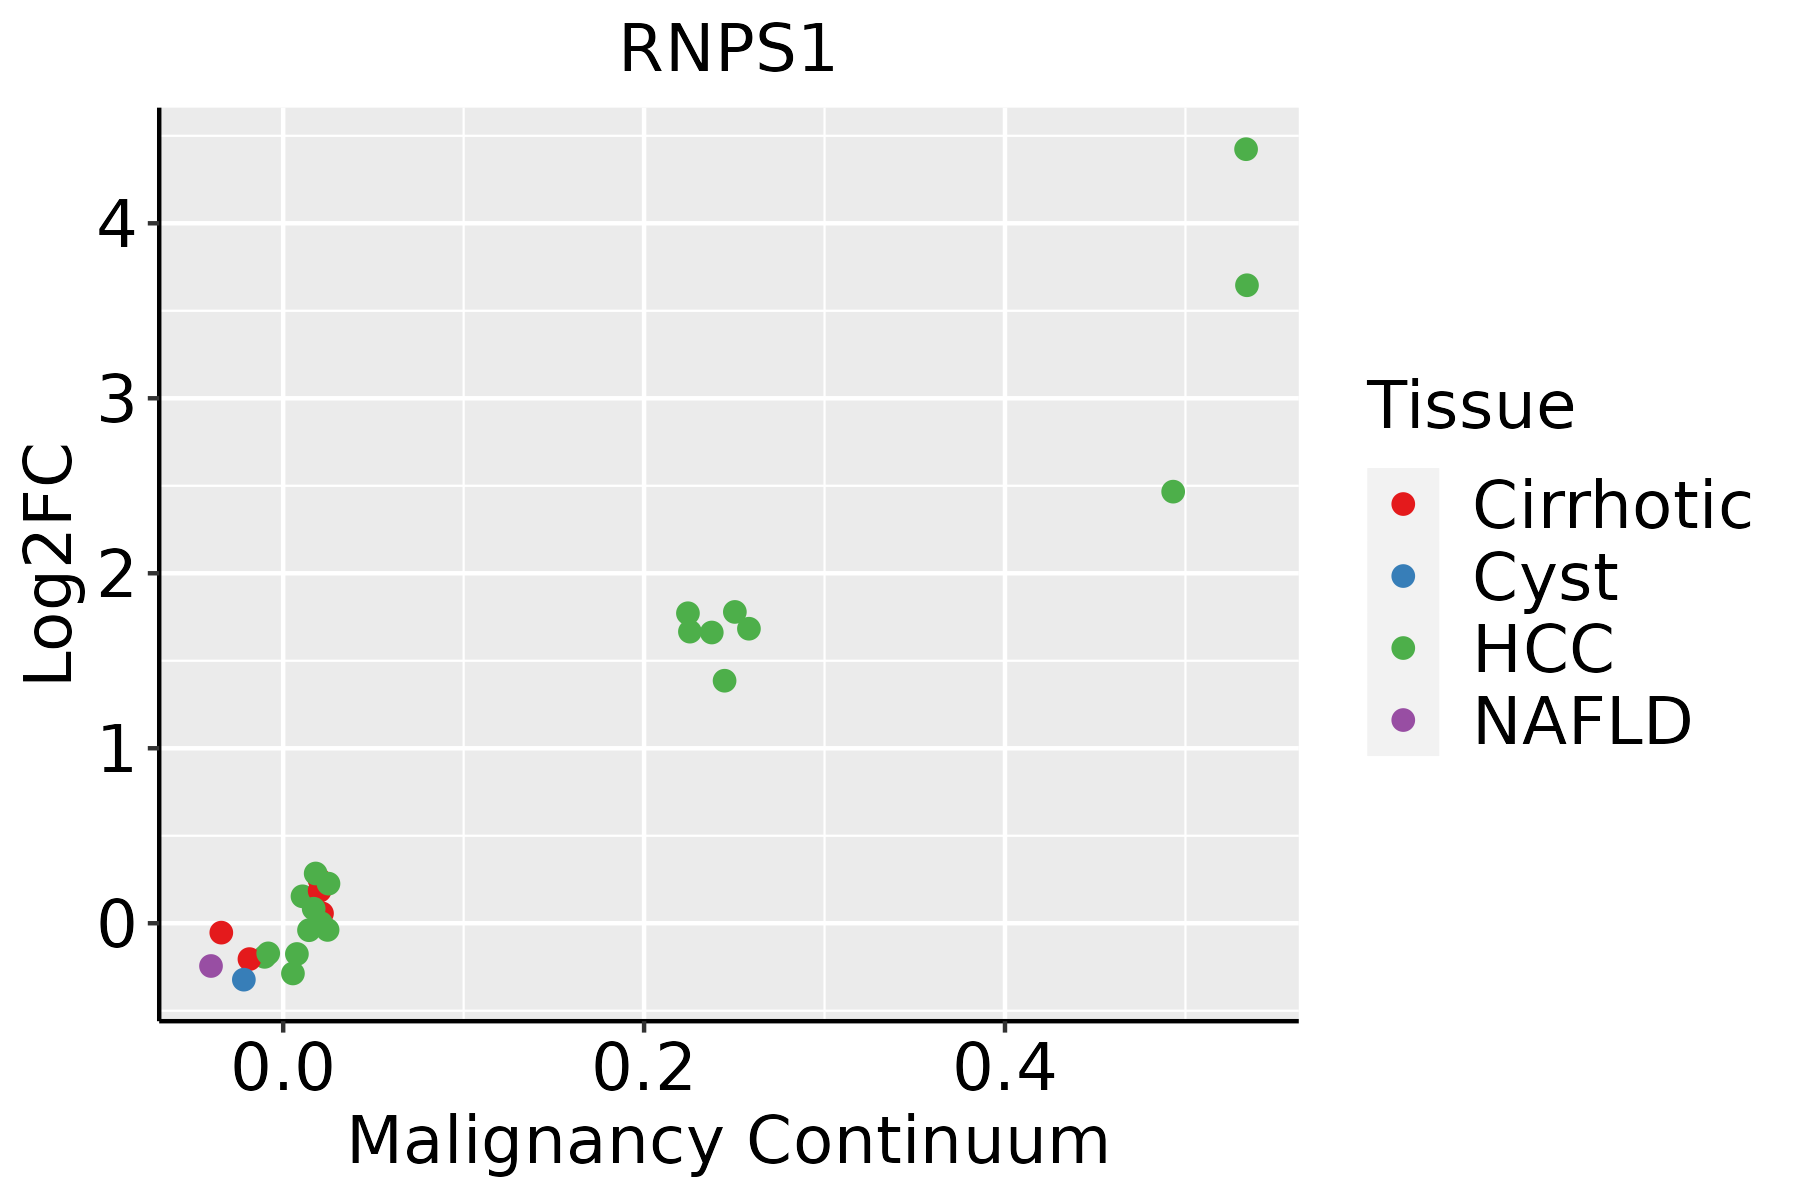 | HCC: Hepatocellular carcinoma |
| NAFLD: Non-alcoholic fatty liver disease |
| Oral Cavity | 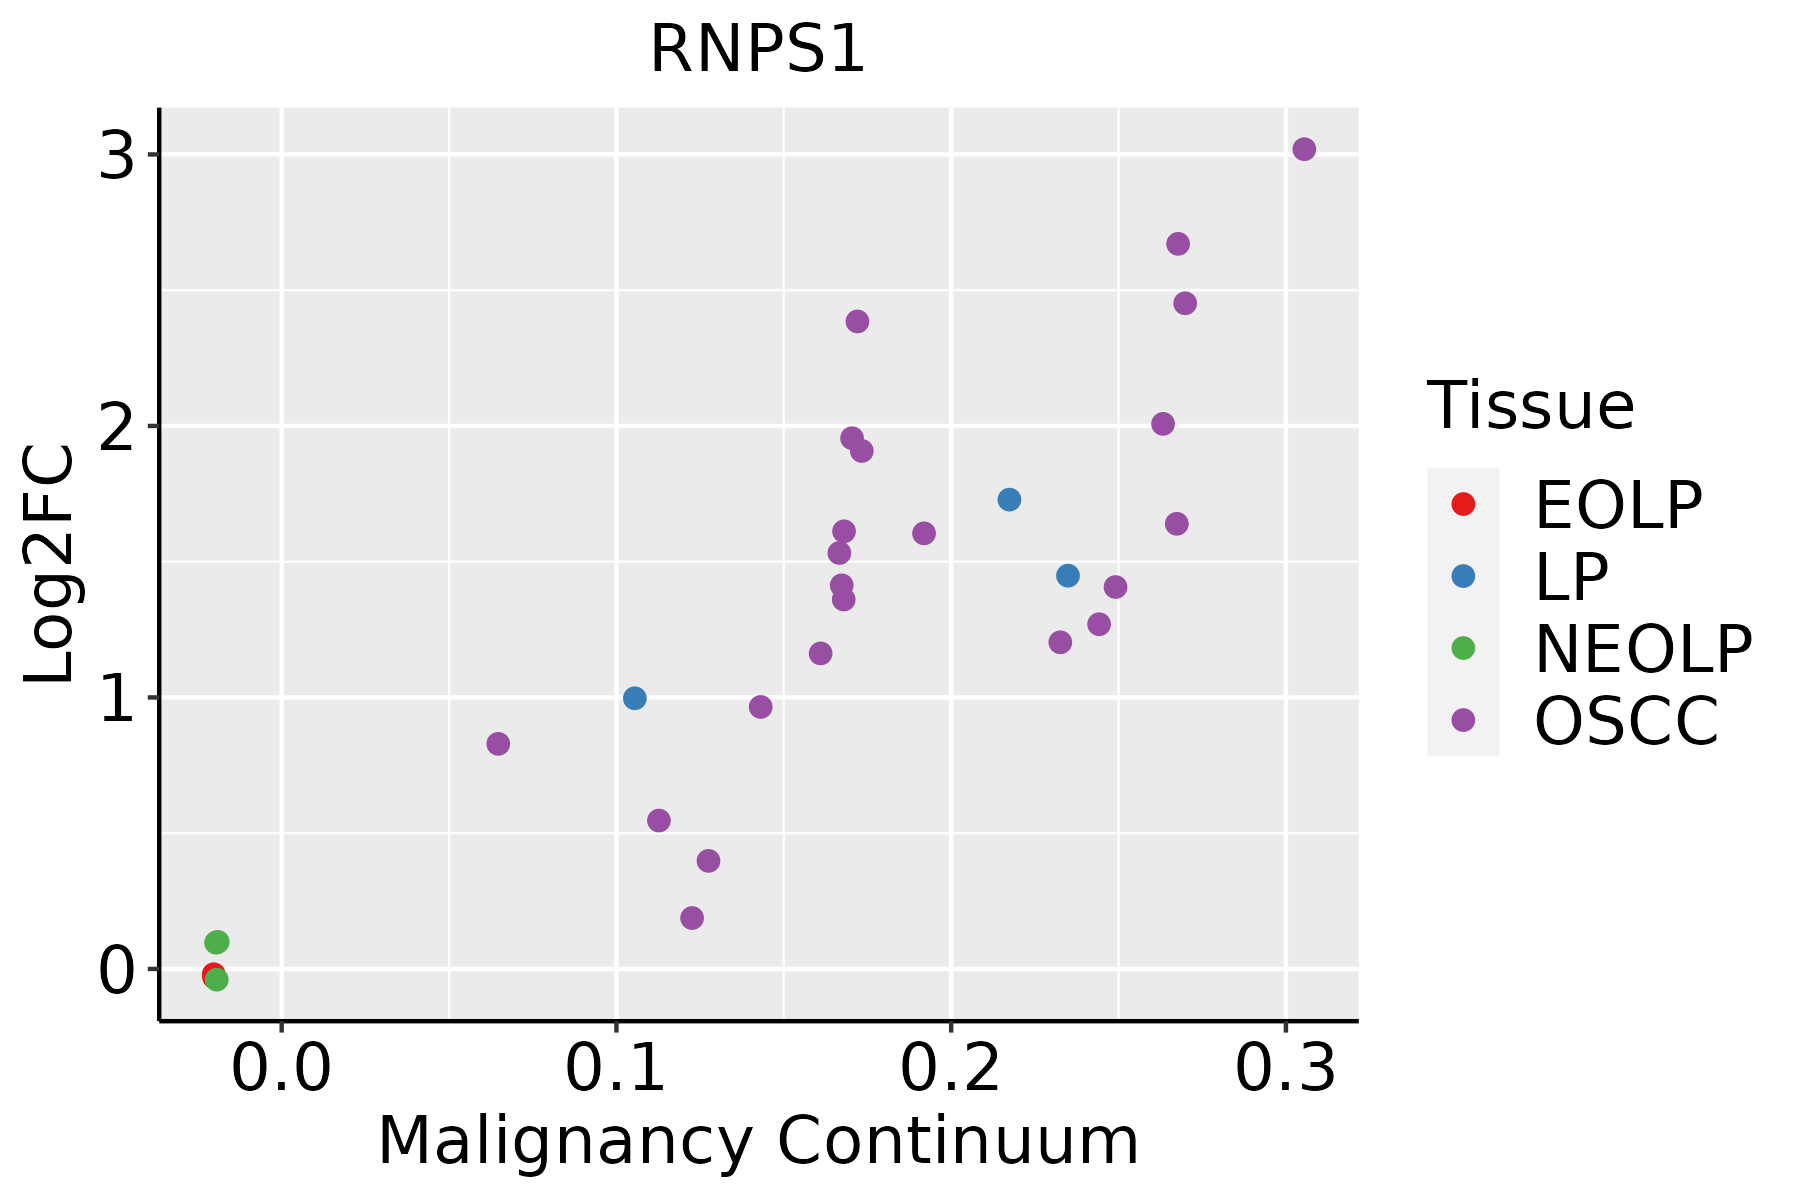 | EOLP: Erosive Oral lichen planus |
| LP: leukoplakia |
| NEOLP: Non-erosive oral lichen planus |
| OSCC: Oral squamous cell carcinoma |
| Prostate | 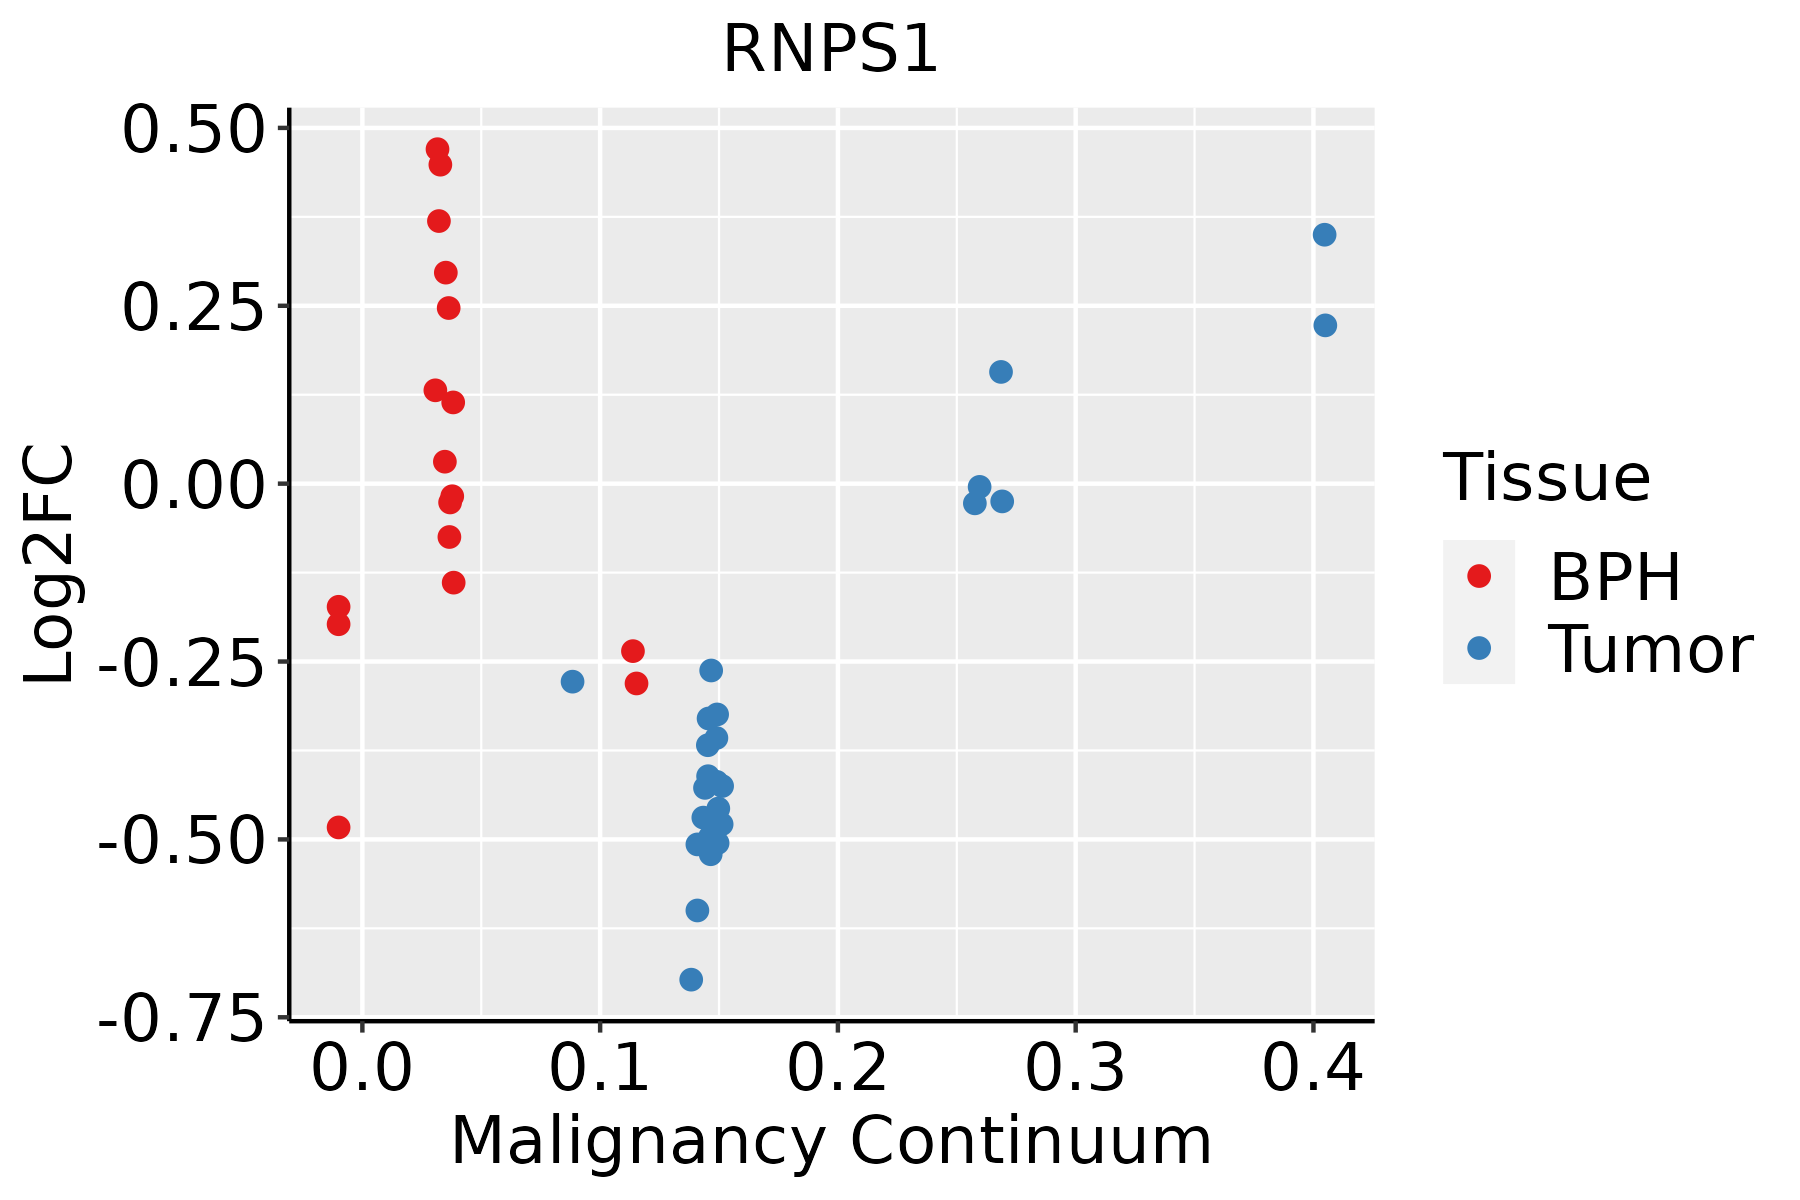 | BPH: Benign Prostatic Hyperplasia |
| Skin | 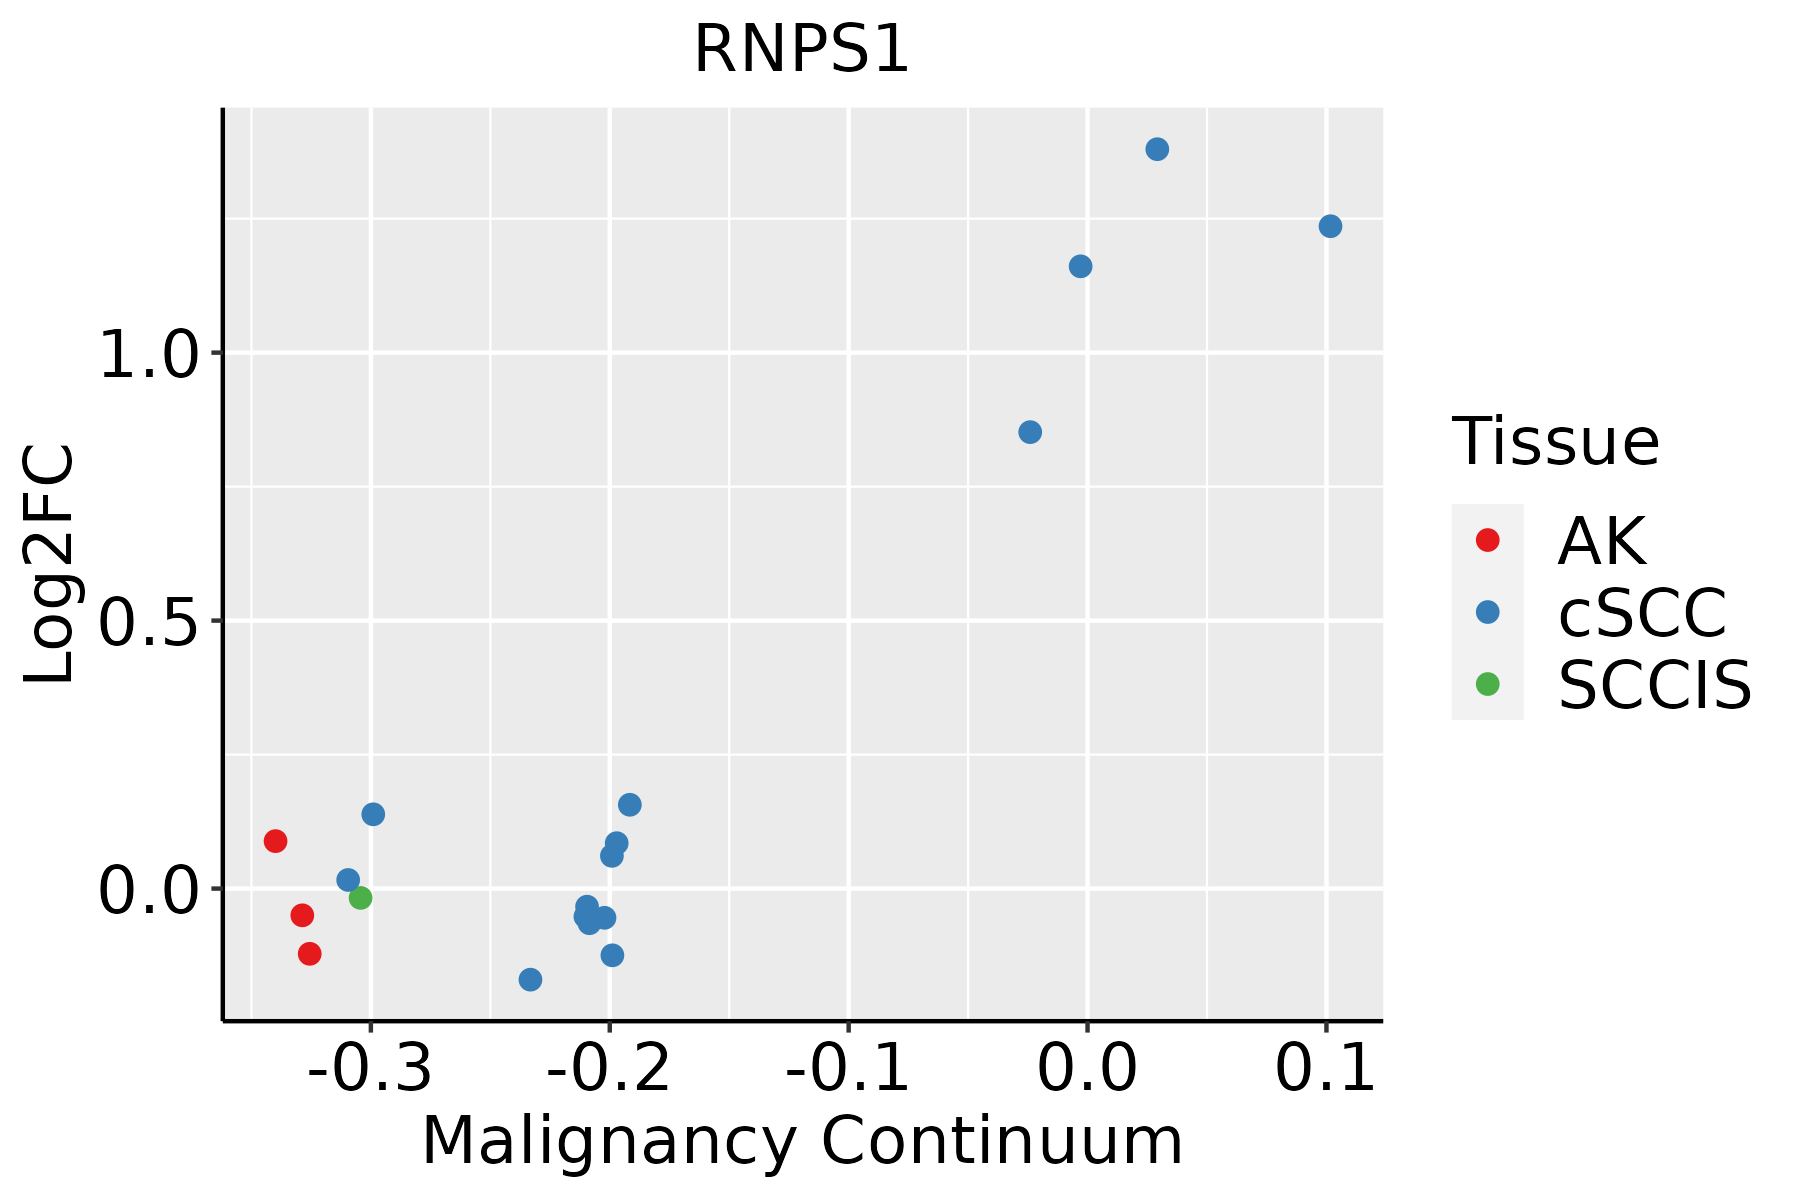 | AK: Actinic keratosis |
| cSCC: Cutaneous squamous cell carcinoma |
| SCCIS:squamous cell carcinoma in situ |
| Thyroid | 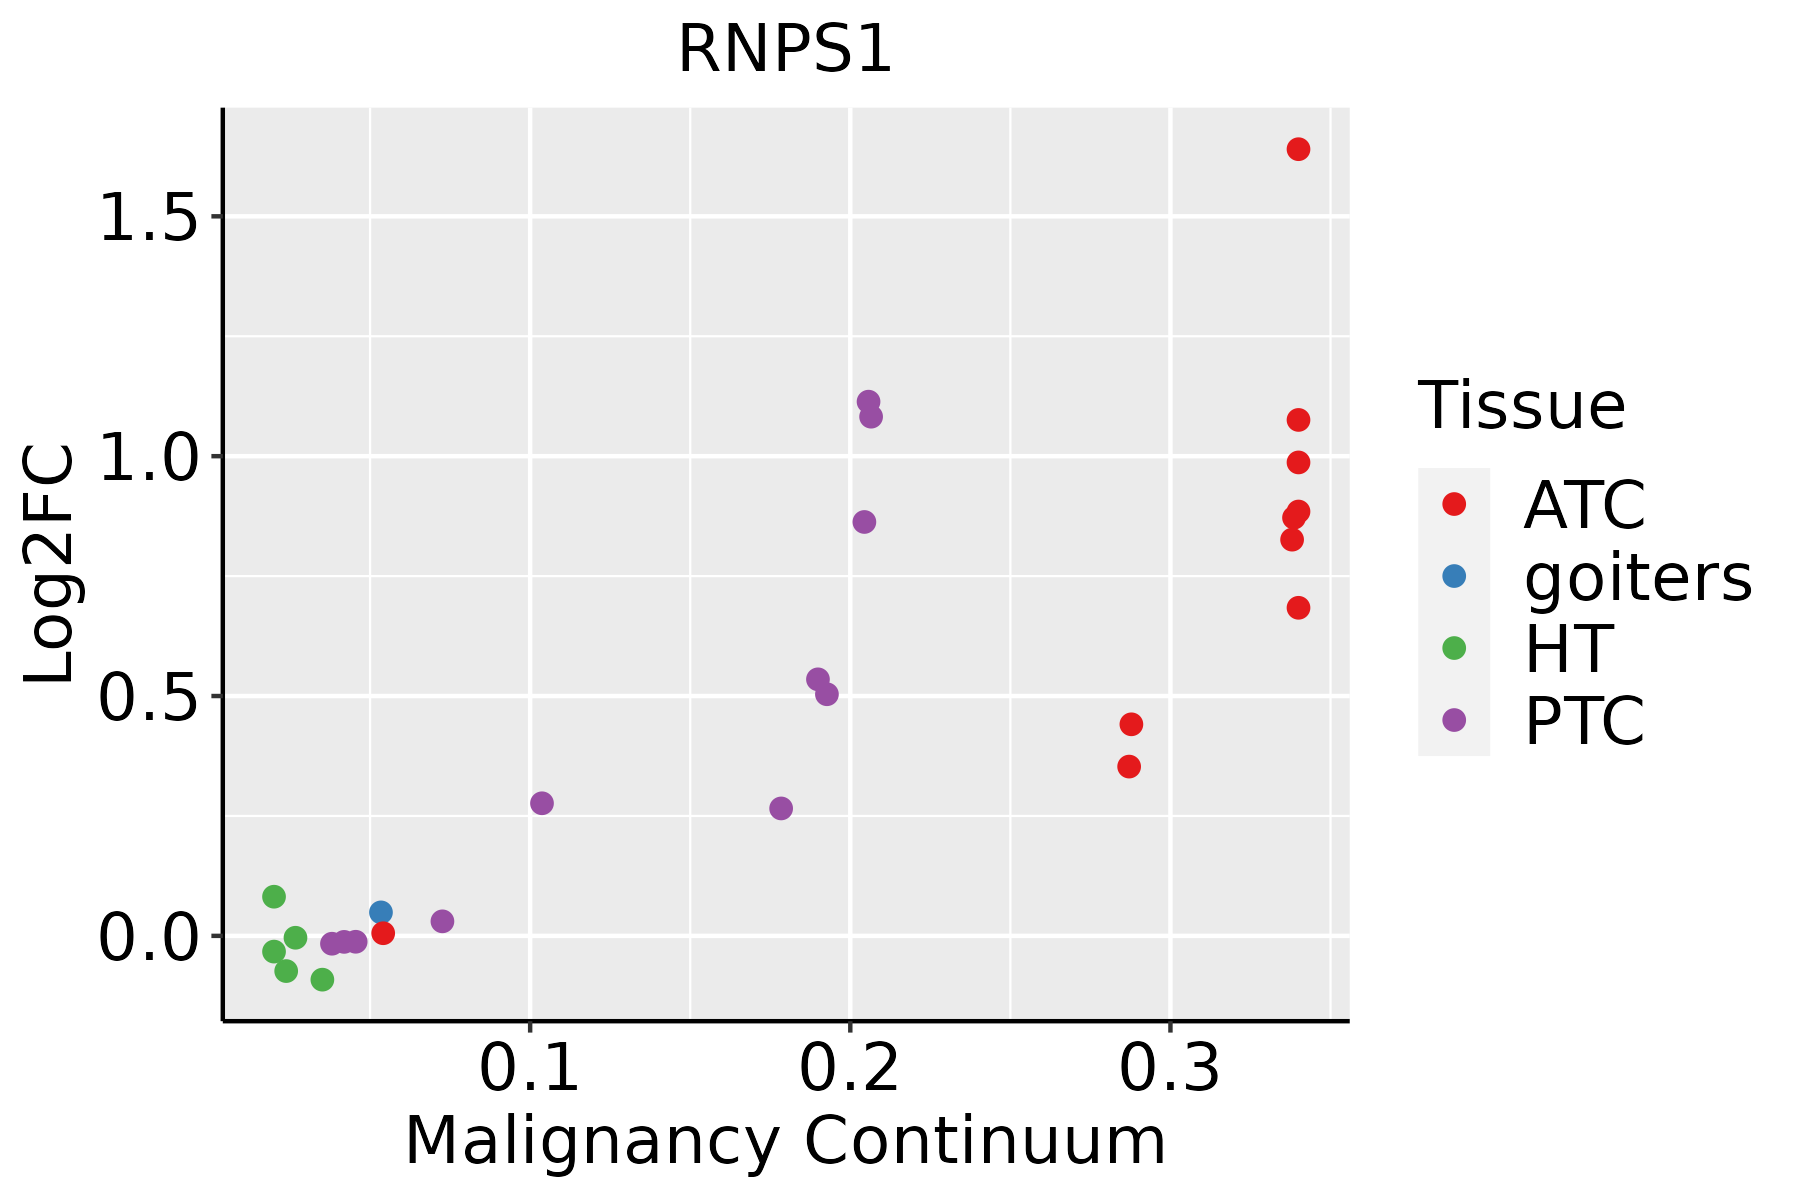 | ATC: Anaplastic thyroid cancer |
| HT: Hashimoto's thyroiditis |
| PTC: Papillary thyroid cancer |
| GO ID | Tissue | Disease Stage | Description | Gene Ratio | Bg Ratio | pvalue | p.adjust | Count |
| GO:00003819 | Endometrium | AEH | regulation of alternative mRNA splicing, via spliceosome | 20/2100 | 60/18723 | 4.46e-06 | 1.17e-04 | 20 |
| GO:003465510 | Endometrium | AEH | nucleobase-containing compound catabolic process | 74/2100 | 407/18723 | 1.78e-05 | 3.65e-04 | 74 |
| GO:190331216 | Endometrium | AEH | negative regulation of mRNA metabolic process | 25/2100 | 92/18723 | 1.86e-05 | 3.77e-04 | 25 |
| GO:004427010 | Endometrium | AEH | cellular nitrogen compound catabolic process | 80/2100 | 451/18723 | 2.09e-05 | 4.13e-04 | 80 |
| GO:00467009 | Endometrium | AEH | heterocycle catabolic process | 79/2100 | 445/18723 | 2.27e-05 | 4.35e-04 | 79 |
| GO:00506867 | Endometrium | AEH | negative regulation of mRNA processing | 12/2100 | 29/18723 | 3.19e-05 | 5.76e-04 | 12 |
| GO:00194399 | Endometrium | AEH | aromatic compound catabolic process | 80/2100 | 467/18723 | 7.21e-05 | 1.10e-03 | 80 |
| GO:19013619 | Endometrium | AEH | organic cyclic compound catabolic process | 83/2100 | 495/18723 | 1.13e-04 | 1.60e-03 | 83 |
| GO:00009568 | Endometrium | AEH | nuclear-transcribed mRNA catabolic process | 26/2100 | 112/18723 | 2.25e-04 | 2.75e-03 | 26 |
| GO:000838017 | Endometrium | EEC | RNA splicing | 111/2168 | 434/18723 | 2.45e-16 | 1.13e-13 | 111 |
| GO:004348417 | Endometrium | EEC | regulation of RNA splicing | 55/2168 | 148/18723 | 5.21e-16 | 1.95e-13 | 55 |
| GO:000037516 | Endometrium | EEC | RNA splicing, via transesterification reactions | 88/2168 | 324/18723 | 7.46e-15 | 2.63e-12 | 88 |
| GO:000037716 | Endometrium | EEC | RNA splicing, via transesterification reactions with bulged adenosine as nucleophile | 87/2168 | 320/18723 | 9.97e-15 | 3.15e-12 | 87 |
| GO:000039816 | Endometrium | EEC | mRNA splicing, via spliceosome | 87/2168 | 320/18723 | 9.97e-15 | 3.15e-12 | 87 |
| GO:190331115 | Endometrium | EEC | regulation of mRNA metabolic process | 79/2168 | 288/18723 | 1.01e-13 | 2.64e-11 | 79 |
| GO:004802417 | Endometrium | EEC | regulation of mRNA splicing, via spliceosome | 40/2168 | 101/18723 | 4.45e-13 | 9.86e-11 | 40 |
| GO:005068414 | Endometrium | EEC | regulation of mRNA processing | 43/2168 | 137/18723 | 4.52e-10 | 4.59e-08 | 43 |
| GO:003311917 | Endometrium | EEC | negative regulation of RNA splicing | 16/2168 | 25/18723 | 7.26e-10 | 7.02e-08 | 16 |
| GO:000640215 | Endometrium | EEC | mRNA catabolic process | 60/2168 | 232/18723 | 1.17e-09 | 9.92e-08 | 60 |
| GO:000640115 | Endometrium | EEC | RNA catabolic process | 65/2168 | 278/18723 | 1.90e-08 | 1.16e-06 | 65 |
| Pathway ID | Tissue | Disease Stage | Description | Gene Ratio | Bg Ratio | pvalue | p.adjust | qvalue | Count |
| hsa03015 | Colorectum | AD | mRNA surveillance pathway | 35/2092 | 97/8465 | 7.95e-03 | 3.13e-02 | 2.00e-02 | 35 |
| hsa030151 | Colorectum | AD | mRNA surveillance pathway | 35/2092 | 97/8465 | 7.95e-03 | 3.13e-02 | 2.00e-02 | 35 |
| hsa030152 | Colorectum | FAP | mRNA surveillance pathway | 26/1404 | 97/8465 | 7.11e-03 | 2.64e-02 | 1.60e-02 | 26 |
| hsa030153 | Colorectum | FAP | mRNA surveillance pathway | 26/1404 | 97/8465 | 7.11e-03 | 2.64e-02 | 1.60e-02 | 26 |
| hsa0301321 | Esophagus | ESCC | Nucleocytoplasmic transport | 89/4205 | 108/8465 | 1.20e-12 | 2.37e-11 | 1.21e-11 | 89 |
| hsa0301524 | Esophagus | ESCC | mRNA surveillance pathway | 72/4205 | 97/8465 | 6.12e-07 | 4.10e-06 | 2.10e-06 | 72 |
| hsa0301331 | Esophagus | ESCC | Nucleocytoplasmic transport | 89/4205 | 108/8465 | 1.20e-12 | 2.37e-11 | 1.21e-11 | 89 |
| hsa0301534 | Esophagus | ESCC | mRNA surveillance pathway | 72/4205 | 97/8465 | 6.12e-07 | 4.10e-06 | 2.10e-06 | 72 |
| hsa030154 | Liver | Cirrhotic | mRNA surveillance pathway | 46/2530 | 97/8465 | 1.92e-04 | 1.30e-03 | 8.03e-04 | 46 |
| hsa0301511 | Liver | Cirrhotic | mRNA surveillance pathway | 46/2530 | 97/8465 | 1.92e-04 | 1.30e-03 | 8.03e-04 | 46 |
| hsa03013 | Liver | HCC | Nucleocytoplasmic transport | 81/4020 | 108/8465 | 4.28e-09 | 6.83e-08 | 3.80e-08 | 81 |
| hsa0301521 | Liver | HCC | mRNA surveillance pathway | 66/4020 | 97/8465 | 3.16e-05 | 1.88e-04 | 1.04e-04 | 66 |
| hsa030131 | Liver | HCC | Nucleocytoplasmic transport | 81/4020 | 108/8465 | 4.28e-09 | 6.83e-08 | 3.80e-08 | 81 |
| hsa0301531 | Liver | HCC | mRNA surveillance pathway | 66/4020 | 97/8465 | 3.16e-05 | 1.88e-04 | 1.04e-04 | 66 |
| hsa030136 | Oral cavity | OSCC | Nucleocytoplasmic transport | 82/3704 | 108/8465 | 7.93e-12 | 1.33e-10 | 6.77e-11 | 82 |
| hsa030158 | Oral cavity | OSCC | mRNA surveillance pathway | 75/3704 | 97/8465 | 1.30e-11 | 2.01e-10 | 1.02e-10 | 75 |
| hsa0301311 | Oral cavity | OSCC | Nucleocytoplasmic transport | 82/3704 | 108/8465 | 7.93e-12 | 1.33e-10 | 6.77e-11 | 82 |
| hsa0301513 | Oral cavity | OSCC | mRNA surveillance pathway | 75/3704 | 97/8465 | 1.30e-11 | 2.01e-10 | 1.02e-10 | 75 |
| hsa0301523 | Oral cavity | LP | mRNA surveillance pathway | 50/2418 | 97/8465 | 1.39e-06 | 1.50e-05 | 9.66e-06 | 50 |
| hsa030132 | Oral cavity | LP | Nucleocytoplasmic transport | 53/2418 | 108/8465 | 4.68e-06 | 4.10e-05 | 2.64e-05 | 53 |
| Hugo Symbol | Variant Class | Variant Classification | dbSNP RS | HGVSc | HGVSp | HGVSp Short | SWISSPROT | BIOTYPE | SIFT | PolyPhen | Tumor Sample Barcode | Tissue | Histology | Sex | Age | Stage | Therapy Types | Drugs | Outcome |
| RNPS1 | SNV | Missense_Mutation | novel | c.106N>T | p.Asp36Tyr | p.D36Y | Q15287 | protein_coding | deleterious_low_confidence(0) | possibly_damaging(0.446) | TCGA-AC-A2FO-01 | Breast | breast invasive carcinoma | Female | >=65 | I/II | Chemotherapy | chemo | CR |
| RNPS1 | SNV | Missense_Mutation | | c.649G>A | p.Glu217Lys | p.E217K | Q15287 | protein_coding | deleterious(0.03) | possibly_damaging(0.564) | TCGA-AR-A5QM-01 | Breast | breast invasive carcinoma | Female | <65 | I/II | Hormone Therapy | anastrozole | PD |
| RNPS1 | insertion | Frame_Shift_Ins | novel | c.730_731insCCTGGGAGCACACTTTTCCCTTCCCCGAT | p.Arg244ThrfsTer37 | p.R244Tfs*37 | Q15287 | protein_coding | | | TCGA-A8-A07U-01 | Breast | breast invasive carcinoma | Female | >=65 | III/IV | Chemotherapy | 5-fluorouracil | SD |
| RNPS1 | insertion | Frame_Shift_Ins | novel | c.2_3insCTTGCCCTCAG | p.Met1? | p.M1? | Q15287 | protein_coding | | | TCGA-AO-A0J5-01 | Breast | breast invasive carcinoma | Female | <65 | III/IV | Other, specify in notesBisphosphonate | zoledronic | PD |
| RNPS1 | SNV | Missense_Mutation | novel | c.703G>A | p.Ala235Thr | p.A235T | Q15287 | protein_coding | deleterious(0.02) | probably_damaging(0.914) | TCGA-2W-A8YY-01 | Cervix | cervical & endocervical cancer | Female | <65 | I/II | Chemotherapy | cisplatin | CR |
| RNPS1 | SNV | Missense_Mutation | rs777754533 | c.155N>T | p.Ser52Leu | p.S52L | Q15287 | protein_coding | deleterious_low_confidence(0) | benign(0.32) | TCGA-AA-3877-01 | Colorectum | colon adenocarcinoma | Female | >=65 | I/II | Unknown | Unknown | SD |
| RNPS1 | SNV | Missense_Mutation | | c.196C>T | p.Arg66Cys | p.R66C | Q15287 | protein_coding | tolerated_low_confidence(0.06) | probably_damaging(0.973) | TCGA-AZ-6601-01 | Colorectum | colon adenocarcinoma | Male | >=65 | I/II | Unknown | Unknown | PD |
| RNPS1 | SNV | Missense_Mutation | rs745449452 | c.851N>A | p.Arg284His | p.R284H | Q15287 | protein_coding | tolerated_low_confidence(0.19) | probably_damaging(0.964) | TCGA-G4-6320-01 | Colorectum | colon adenocarcinoma | Male | >=65 | III/IV | Chemotherapy | oxaliplatin | SD |
| RNPS1 | SNV | Missense_Mutation | | c.487N>A | p.Val163Met | p.V163M | Q15287 | protein_coding | deleterious(0) | probably_damaging(0.986) | TCGA-AG-3898-01 | Colorectum | rectum adenocarcinoma | Male | <65 | I/II | Unknown | Unknown | SD |
| RNPS1 | deletion | Frame_Shift_Del | | c.23delA | p.Lys8ArgfsTer5 | p.K8Rfs*5 | Q15287 | protein_coding | | | TCGA-AA-3506-01 | Colorectum | colon adenocarcinoma | Male | >=65 | I/II | Unknown | Unknown | SD |


