
|
|||||
|
 | |
| |
| |
| |
| |
| |
|
Gene: RHOG |
Gene summary for RHOG |
| Gene information | Species | Human | Gene symbol | RHOG | Gene ID | 391 |
| Gene name | ras homolog family member G | |
| Gene Alias | ARHG | |
| Cytomap | 11p15.4 | |
| Gene Type | protein-coding | GO ID | GO:0000902 | UniProtAcc | P84095 |
Top |
Malignant transformation analysis |
| Identification of the aberrant gene expression in precancerous and cancerous lesions by comparing the gene expression of stem-like cells in diseased tissues with normal stem cells |
| Entrez ID | Symbol | Replicates | Species | Organ | Tissue | Adj P-value | Log2FC | Malignancy |
| 391 | RHOG | HTA11_3410_2000001011 | Human | Colorectum | AD | 1.82e-04 | 1.44e-01 | 0.0155 |
| 391 | RHOG | HTA11_2487_2000001011 | Human | Colorectum | SER | 5.96e-16 | 6.85e-01 | -0.1808 |
| 391 | RHOG | HTA11_1938_2000001011 | Human | Colorectum | AD | 3.35e-06 | 3.22e-01 | -0.0811 |
| 391 | RHOG | HTA11_78_2000001011 | Human | Colorectum | AD | 3.42e-04 | 1.85e-01 | -0.1088 |
| 391 | RHOG | HTA11_347_2000001011 | Human | Colorectum | AD | 1.25e-12 | 3.31e-01 | -0.1954 |
| 391 | RHOG | HTA11_411_2000001011 | Human | Colorectum | SER | 2.13e-03 | 1.15e+00 | -0.2602 |
| 391 | RHOG | HTA11_2112_2000001011 | Human | Colorectum | SER | 4.23e-05 | 4.57e-01 | -0.2196 |
| 391 | RHOG | HTA11_3361_2000001011 | Human | Colorectum | AD | 8.24e-06 | 3.30e-01 | -0.1207 |
| 391 | RHOG | HTA11_83_2000001011 | Human | Colorectum | SER | 2.15e-02 | 2.21e-01 | -0.1526 |
| 391 | RHOG | HTA11_696_2000001011 | Human | Colorectum | AD | 5.80e-10 | 3.22e-01 | -0.1464 |
| 391 | RHOG | HTA11_866_2000001011 | Human | Colorectum | AD | 4.96e-02 | 2.14e-01 | -0.1001 |
| 391 | RHOG | HTA11_1391_2000001011 | Human | Colorectum | AD | 1.41e-18 | 5.71e-01 | -0.059 |
| 391 | RHOG | HTA11_5212_2000001011 | Human | Colorectum | AD | 5.25e-13 | 7.28e-01 | -0.2061 |
| 391 | RHOG | HTA11_546_2000001011 | Human | Colorectum | AD | 6.68e-03 | 2.83e-01 | -0.0842 |
| 391 | RHOG | HTA11_866_3004761011 | Human | Colorectum | AD | 7.72e-05 | 2.17e-01 | 0.096 |
| 391 | RHOG | HTA11_8622_2000001021 | Human | Colorectum | SER | 2.22e-03 | 3.16e-01 | 0.0528 |
| 391 | RHOG | HTA11_6801_2000001011 | Human | Colorectum | SER | 5.92e-03 | 4.20e-01 | 0.0171 |
| 391 | RHOG | HTA11_10711_2000001011 | Human | Colorectum | AD | 1.02e-02 | 2.08e-01 | 0.0338 |
| 391 | RHOG | HTA11_7696_3000711011 | Human | Colorectum | AD | 4.80e-08 | 3.37e-01 | 0.0674 |
| 391 | RHOG | HTA11_6818_2000001011 | Human | Colorectum | AD | 3.50e-02 | 2.42e-01 | 0.0112 |
| Page: 1 2 3 4 5 6 7 8 |
| Tissue | Expression Dynamics | Abbreviation |
| Colorectum (GSE201348) |  | FAP: Familial adenomatous polyposis |
| CRC: Colorectal cancer | ||
| Colorectum (HTA11) |  | AD: Adenomas |
| SER: Sessile serrated lesions | ||
| MSI-H: Microsatellite-high colorectal cancer | ||
| MSS: Microsatellite stable colorectal cancer | ||
| Esophagus | 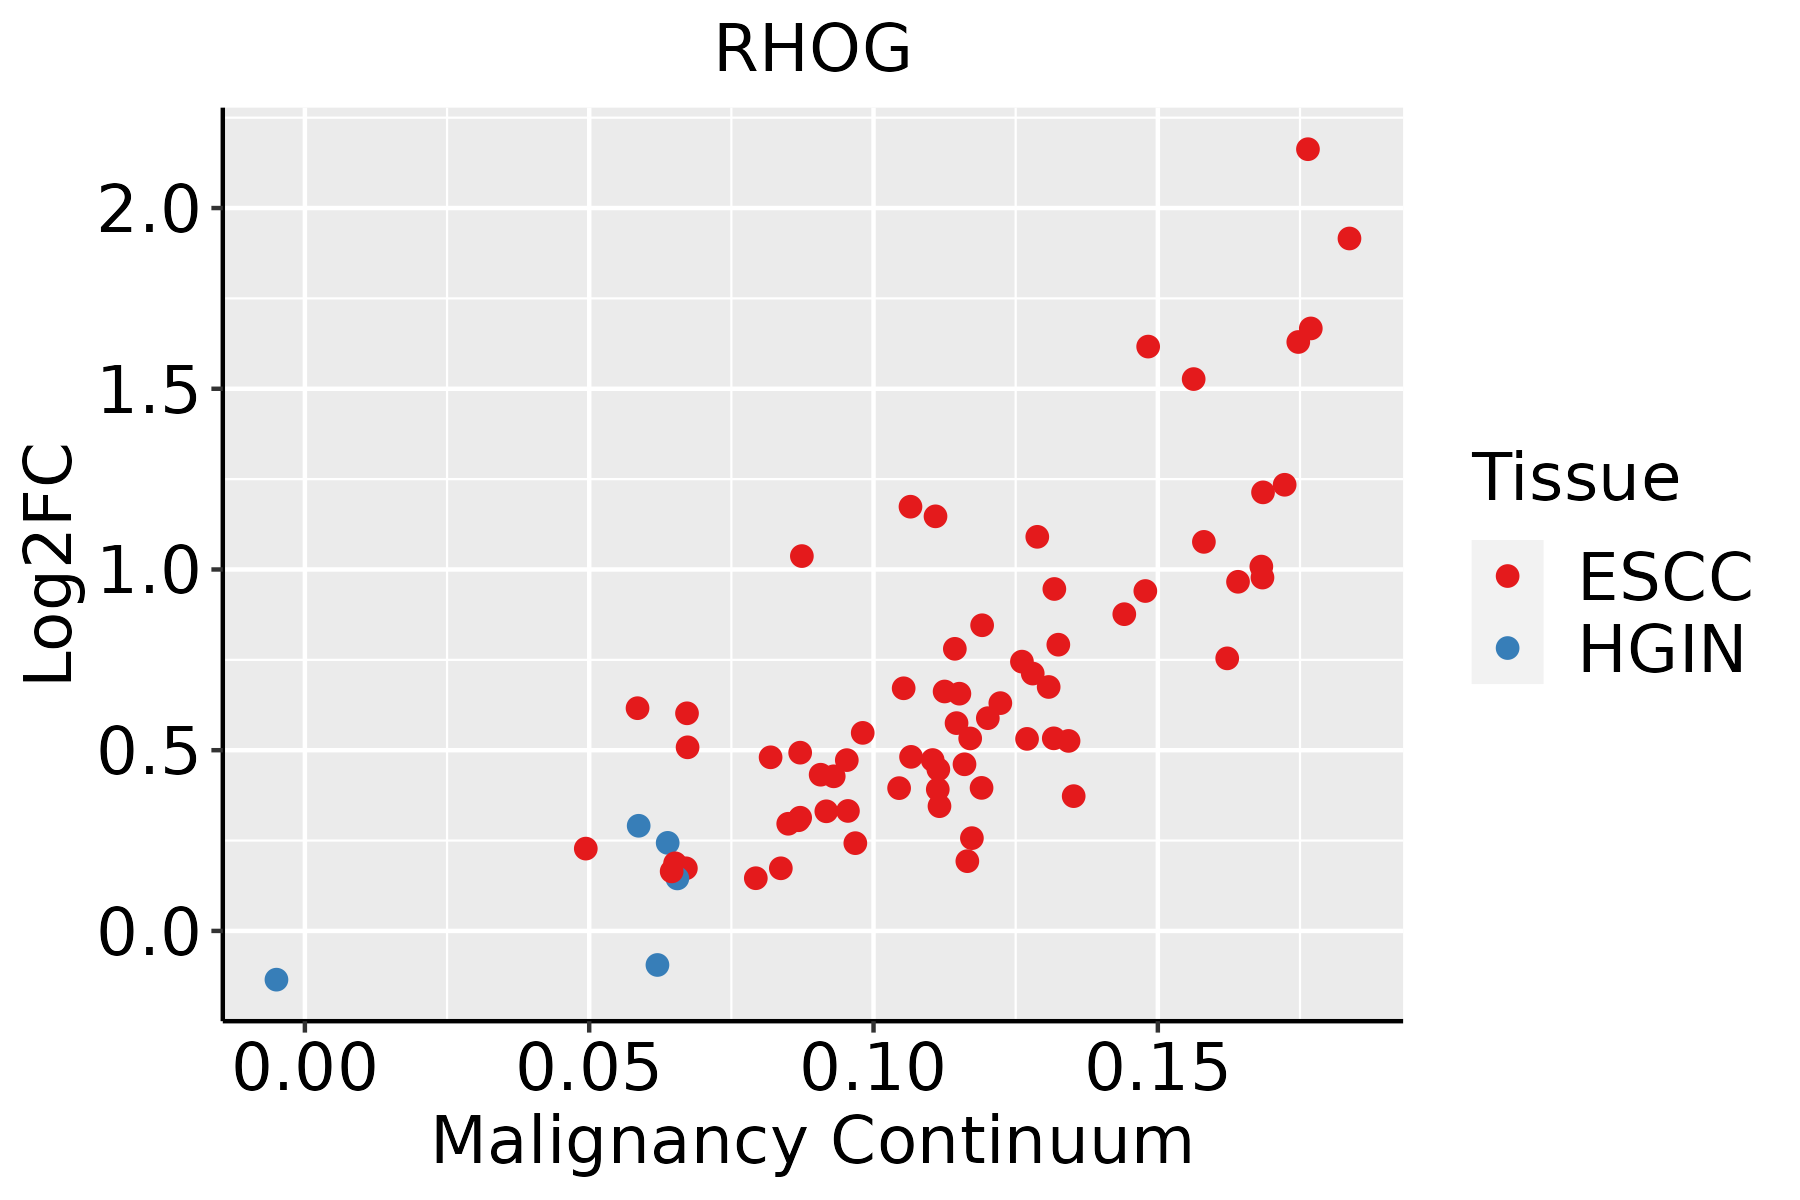 | ESCC: Esophageal squamous cell carcinoma |
| HGIN: High-grade intraepithelial neoplasias | ||
| LGIN: Low-grade intraepithelial neoplasias | ||
| Liver | 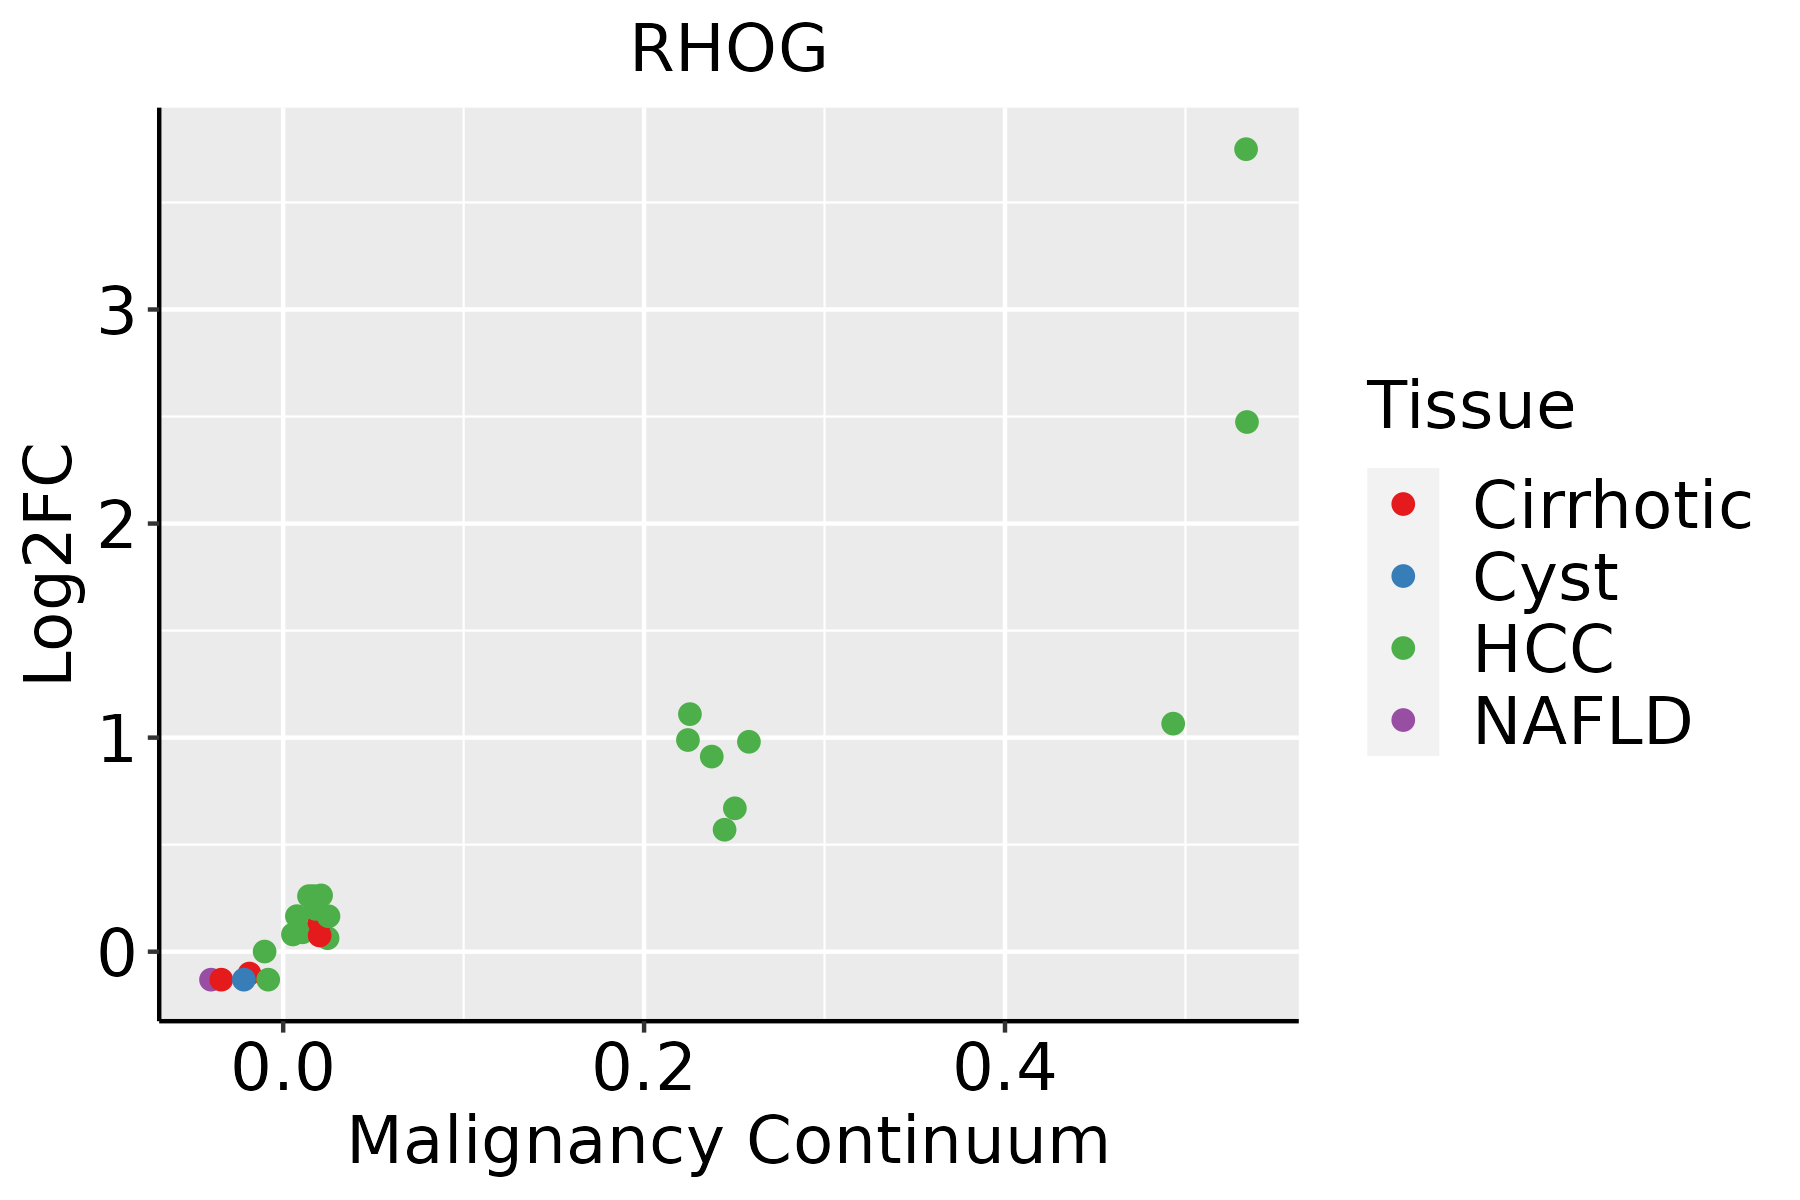 | HCC: Hepatocellular carcinoma |
| NAFLD: Non-alcoholic fatty liver disease | ||
| Oral Cavity | 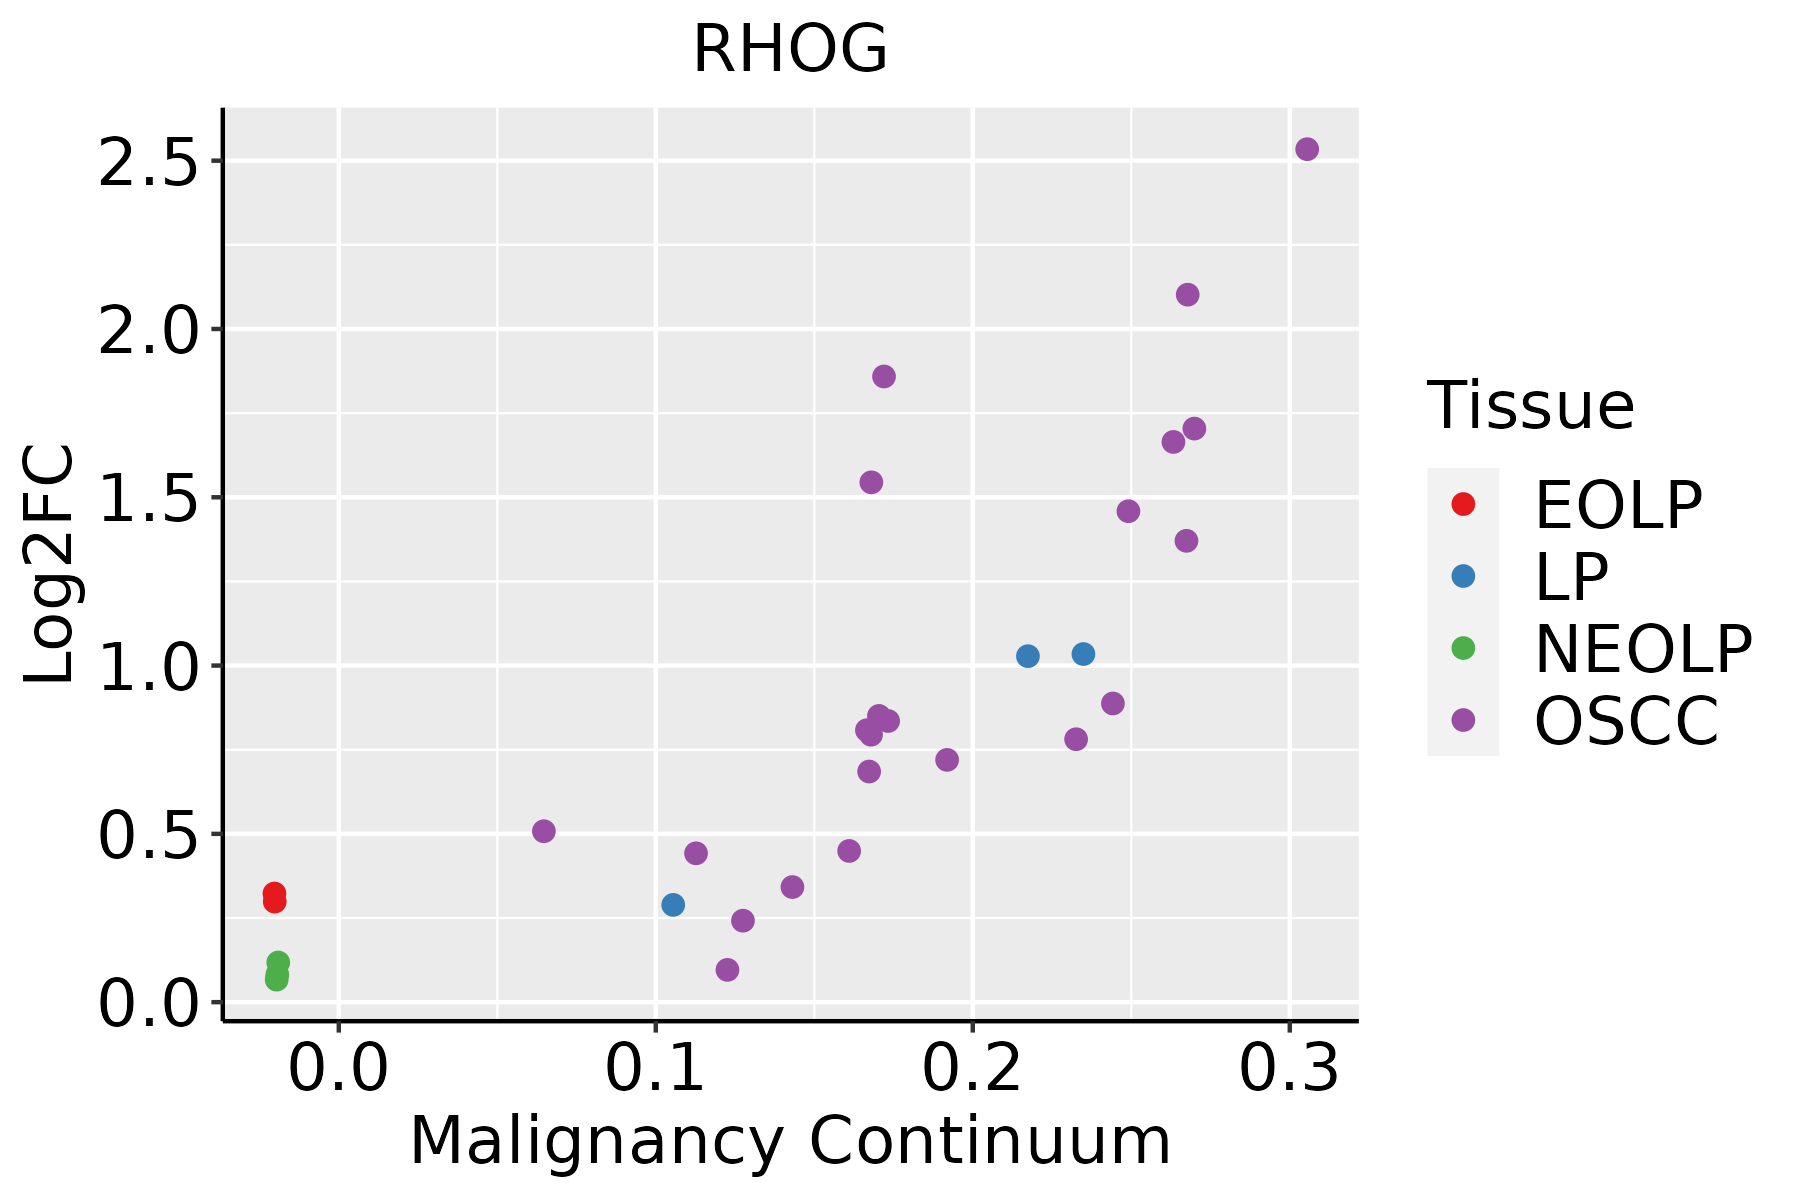 | EOLP: Erosive Oral lichen planus |
| LP: leukoplakia | ||
| NEOLP: Non-erosive oral lichen planus | ||
| OSCC: Oral squamous cell carcinoma | ||
| Skin | 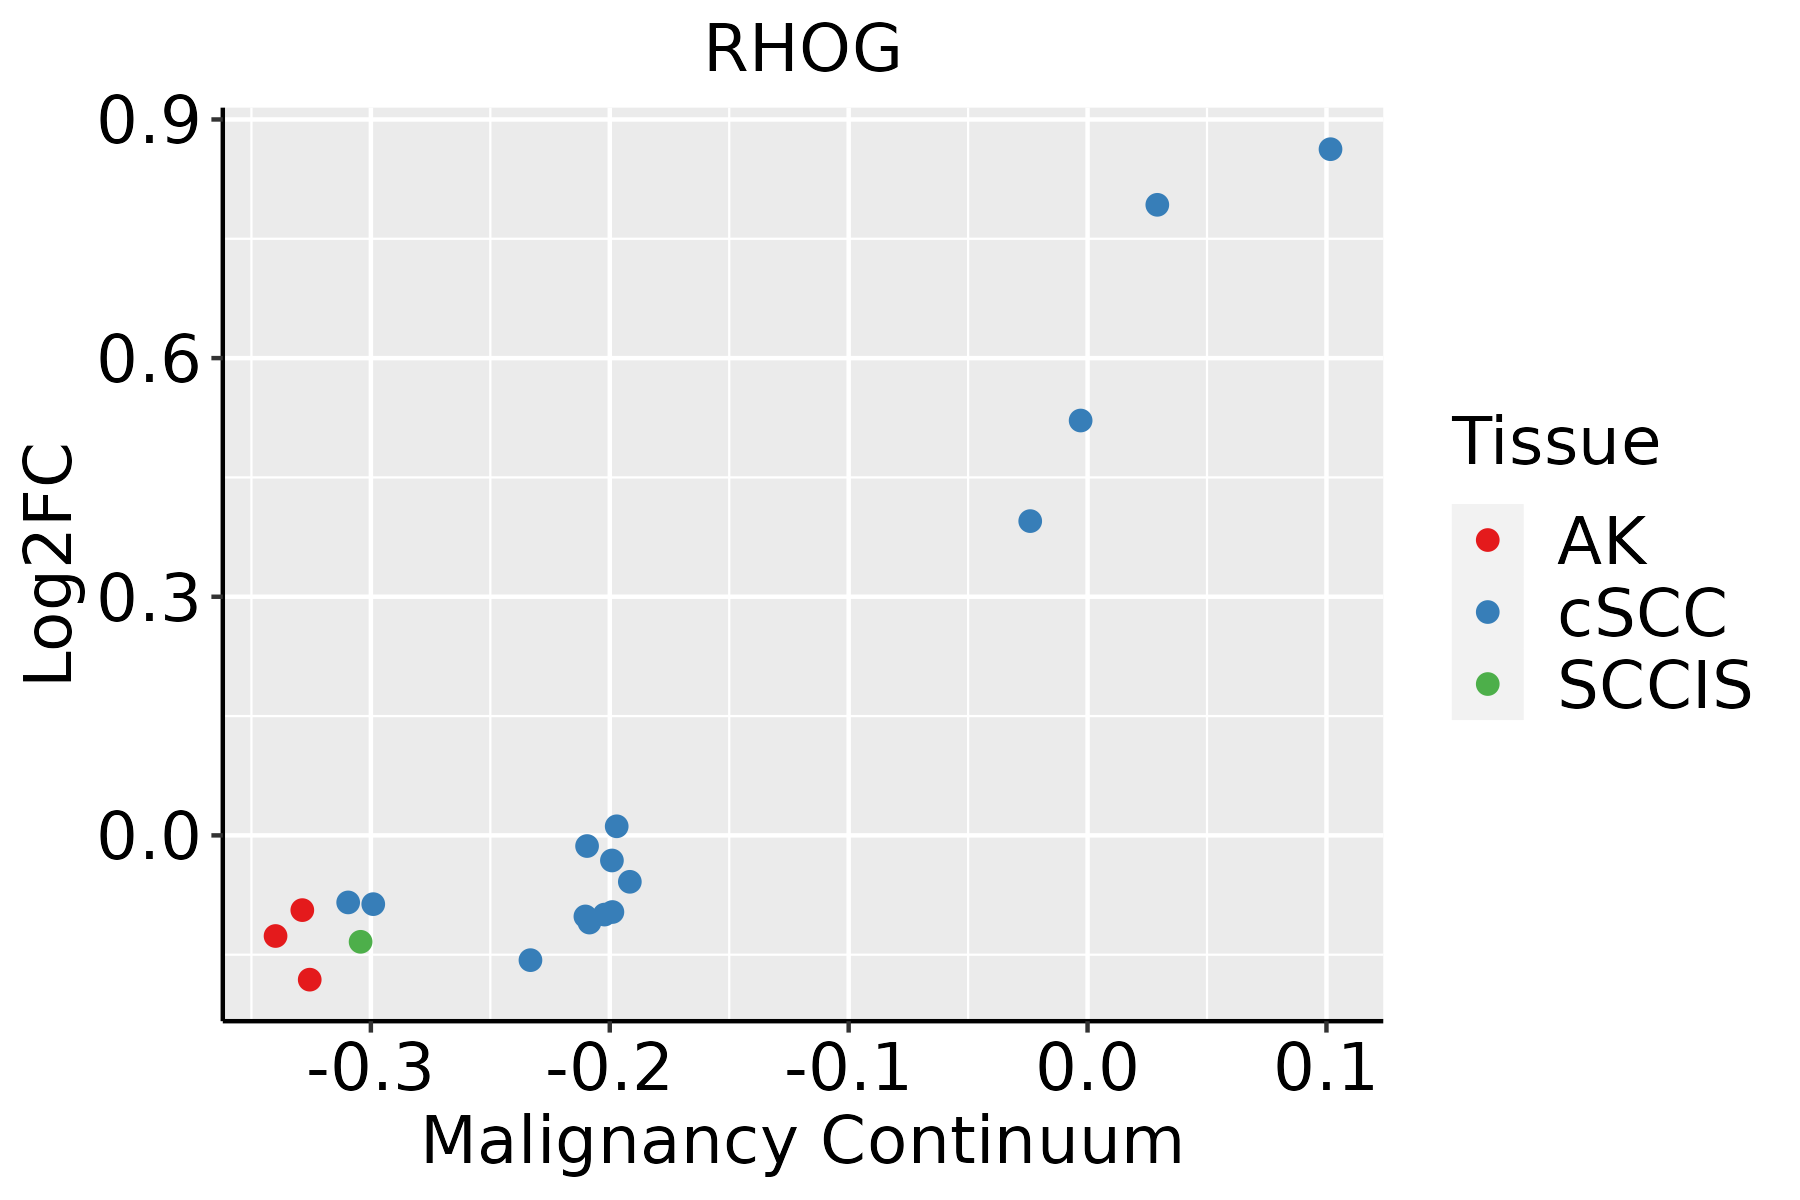 | AK: Actinic keratosis |
| cSCC: Cutaneous squamous cell carcinoma | ||
| SCCIS:squamous cell carcinoma in situ | ||
| Thyroid | 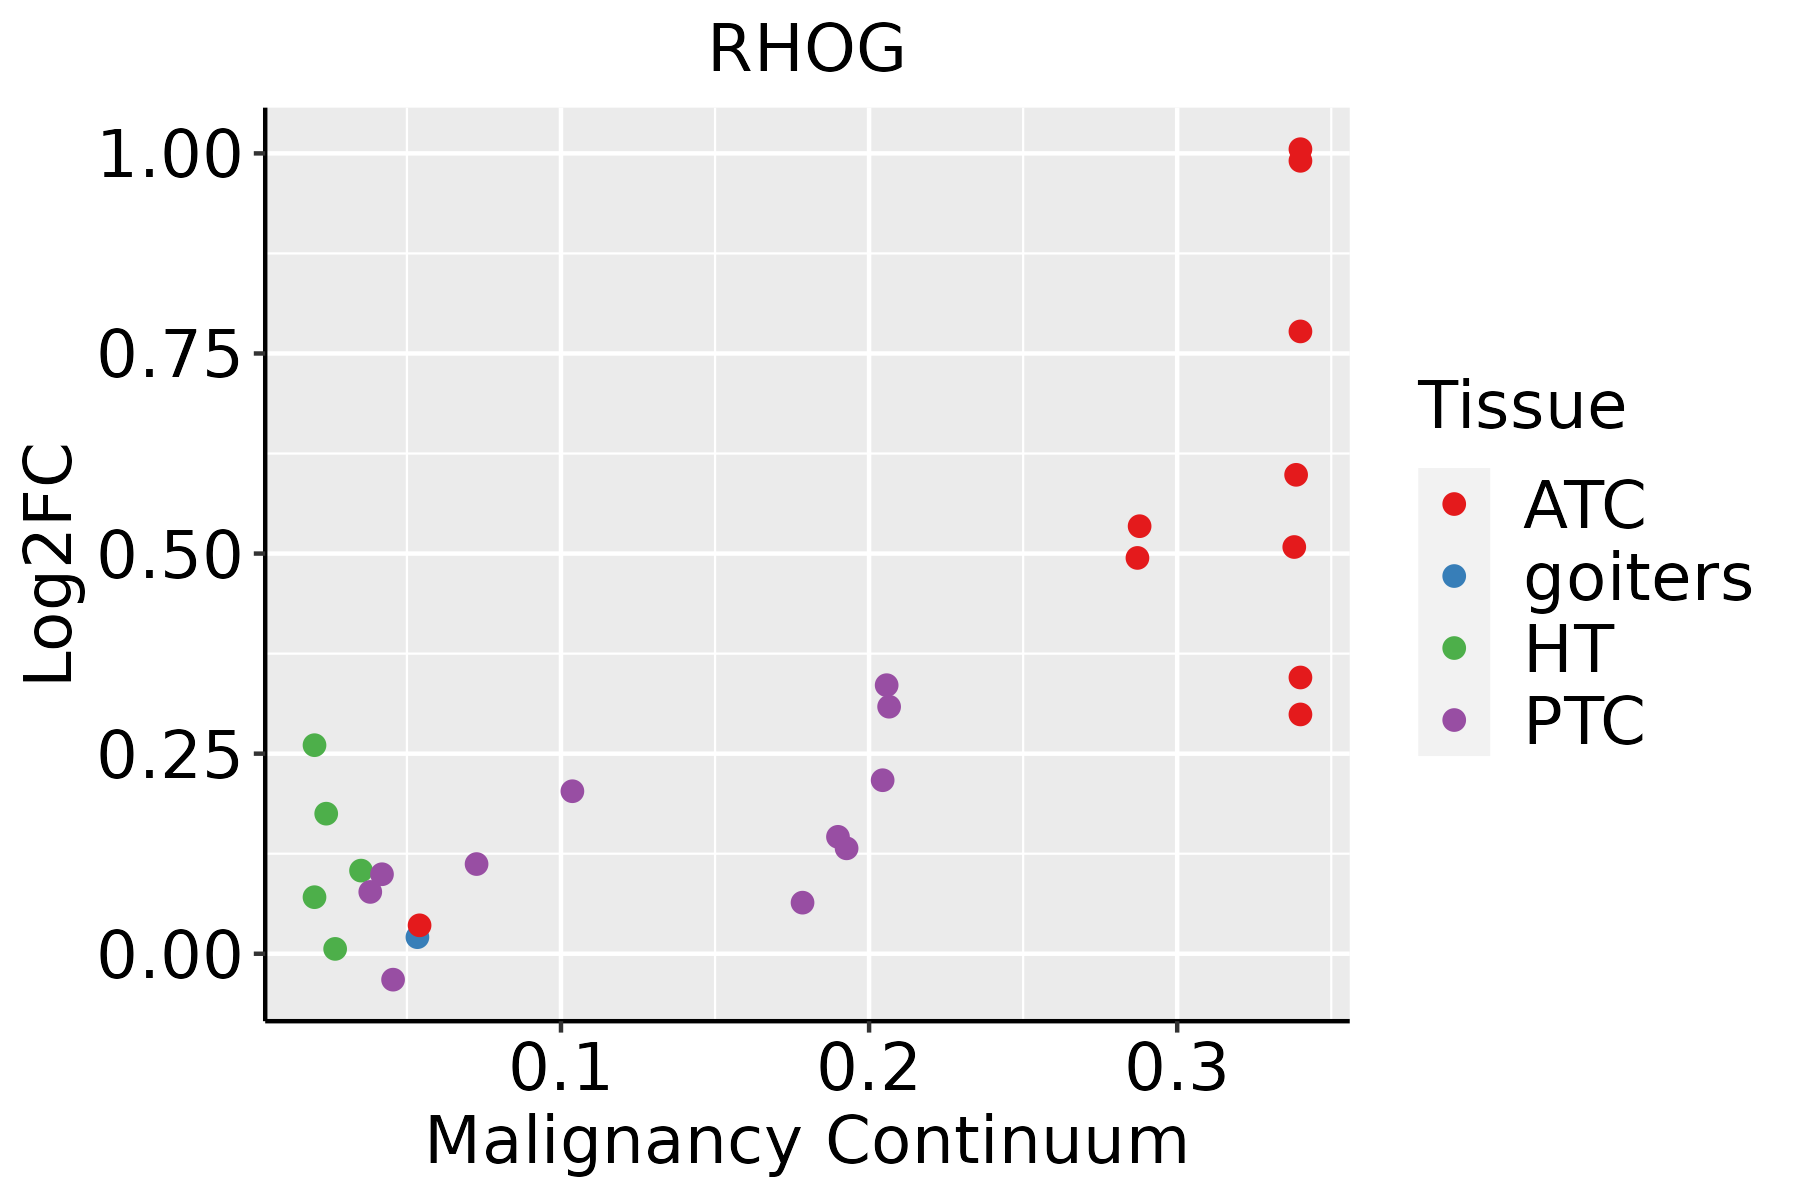 | ATC: Anaplastic thyroid cancer |
| HT: Hashimoto's thyroiditis | ||
| PTC: Papillary thyroid cancer |
| ∗log2FC in expression of this searched gene in stem-like cells from each diseased tissue sample relative to stem-like cells in normal samples in each tissue plotted against the malignancy continuum. Samples are colored based on if they are from different disease stage. |
Top |
Malignant transformation related pathway analysis |
| Find out the enriched GO biological processes and KEGG pathways involved in transition from healthy to precancer to cancer |
| Tissue | Disease Stage | Enriched GO biological Processes |
| Colorectum | AD |  |
| Colorectum | SER |  |
| Colorectum | MSS |  |
| Colorectum | MSI-H |  |
| Colorectum | FAP |  |
| ∗Top 15 enriched GO BP terms are showed in the bar plot of each disease state in each tissue. Each row represents a significant GO biological process which is colored according to the -log10(p.adjust). |
| Page: 1 2 3 4 5 6 7 8 9 |
| GO ID | Tissue | Disease Stage | Description | Gene Ratio | Bg Ratio | pvalue | p.adjust | Count |
| GO:190307817 | Esophagus | ESCC | positive regulation of protein localization to plasma membrane | 43/8552 | 62/18723 | 1.38e-04 | 9.35e-04 | 43 |
| GO:006156415 | Esophagus | ESCC | axon development | 251/8552 | 467/18723 | 2.41e-04 | 1.49e-03 | 251 |
| GO:00315299 | Esophagus | ESCC | ruffle organization | 39/8552 | 56/18723 | 2.44e-04 | 1.51e-03 | 39 |
| GO:00971789 | Esophagus | ESCC | ruffle assembly | 32/8552 | 44/18723 | 2.50e-04 | 1.54e-03 | 32 |
| GO:006049118 | Esophagus | ESCC | regulation of cell projection assembly | 110/8552 | 188/18723 | 2.60e-04 | 1.58e-03 | 110 |
| GO:000836018 | Esophagus | ESCC | regulation of cell shape | 92/8552 | 154/18723 | 3.00e-04 | 1.81e-03 | 92 |
| GO:012003218 | Esophagus | ESCC | regulation of plasma membrane bounded cell projection assembly | 108/8552 | 186/18723 | 4.37e-04 | 2.46e-03 | 108 |
| GO:000726610 | Esophagus | ESCC | Rho protein signal transduction | 81/8552 | 137/18723 | 1.03e-03 | 5.20e-03 | 81 |
| GO:000740915 | Esophagus | ESCC | axonogenesis | 219/8552 | 418/18723 | 3.14e-03 | 1.31e-02 | 219 |
| GO:004308715 | Esophagus | ESCC | regulation of GTPase activity | 183/8552 | 348/18723 | 5.34e-03 | 2.00e-02 | 183 |
| GO:000268515 | Esophagus | ESCC | regulation of leukocyte migration | 114/8552 | 210/18723 | 7.26e-03 | 2.63e-02 | 114 |
| GO:19000277 | Esophagus | ESCC | regulation of ruffle assembly | 21/8552 | 31/18723 | 1.10e-02 | 3.70e-02 | 21 |
| GO:190382912 | Liver | Cirrhotic | positive regulation of cellular protein localization | 123/4634 | 276/18723 | 4.06e-13 | 3.22e-11 | 123 |
| GO:000701512 | Liver | Cirrhotic | actin filament organization | 171/4634 | 442/18723 | 3.93e-11 | 2.30e-09 | 171 |
| GO:199077811 | Liver | Cirrhotic | protein localization to cell periphery | 135/4634 | 333/18723 | 1.18e-10 | 6.21e-09 | 135 |
| GO:007265911 | Liver | Cirrhotic | protein localization to plasma membrane | 119/4634 | 284/18723 | 1.30e-10 | 6.80e-09 | 119 |
| GO:002260412 | Liver | Cirrhotic | regulation of cell morphogenesis | 127/4634 | 309/18723 | 1.45e-10 | 7.44e-09 | 127 |
| GO:003297012 | Liver | Cirrhotic | regulation of actin filament-based process | 152/4634 | 397/18723 | 1.12e-09 | 5.00e-08 | 152 |
| GO:003295612 | Liver | Cirrhotic | regulation of actin cytoskeleton organization | 136/4634 | 358/18723 | 1.47e-08 | 5.49e-07 | 136 |
| GO:000836012 | Liver | Cirrhotic | regulation of cell shape | 69/4634 | 154/18723 | 4.21e-08 | 1.36e-06 | 69 |
| Page: 1 2 3 4 5 6 7 8 9 10 11 12 13 14 15 16 17 |
| Pathway ID | Tissue | Disease Stage | Description | Gene Ratio | Bg Ratio | pvalue | p.adjust | qvalue | Count |
| hsa05100 | Colorectum | AD | Bacterial invasion of epithelial cells | 44/2092 | 77/8465 | 1.13e-09 | 2.22e-08 | 1.42e-08 | 44 |
| hsa05132 | Colorectum | AD | Salmonella infection | 102/2092 | 249/8465 | 7.65e-09 | 1.28e-07 | 8.17e-08 | 102 |
| hsa05135 | Colorectum | AD | Yersinia infection | 58/2092 | 137/8465 | 3.90e-06 | 4.35e-05 | 2.78e-05 | 58 |
| hsa051001 | Colorectum | AD | Bacterial invasion of epithelial cells | 44/2092 | 77/8465 | 1.13e-09 | 2.22e-08 | 1.42e-08 | 44 |
| hsa051321 | Colorectum | AD | Salmonella infection | 102/2092 | 249/8465 | 7.65e-09 | 1.28e-07 | 8.17e-08 | 102 |
| hsa051351 | Colorectum | AD | Yersinia infection | 58/2092 | 137/8465 | 3.90e-06 | 4.35e-05 | 2.78e-05 | 58 |
| hsa051002 | Colorectum | SER | Bacterial invasion of epithelial cells | 36/1580 | 77/8465 | 1.56e-08 | 3.45e-07 | 2.50e-07 | 36 |
| hsa051322 | Colorectum | SER | Salmonella infection | 77/1580 | 249/8465 | 1.56e-06 | 2.35e-05 | 1.71e-05 | 77 |
| hsa051352 | Colorectum | SER | Yersinia infection | 43/1580 | 137/8465 | 2.15e-04 | 2.10e-03 | 1.52e-03 | 43 |
| hsa051003 | Colorectum | SER | Bacterial invasion of epithelial cells | 36/1580 | 77/8465 | 1.56e-08 | 3.45e-07 | 2.50e-07 | 36 |
| hsa051323 | Colorectum | SER | Salmonella infection | 77/1580 | 249/8465 | 1.56e-06 | 2.35e-05 | 1.71e-05 | 77 |
| hsa051353 | Colorectum | SER | Yersinia infection | 43/1580 | 137/8465 | 2.15e-04 | 2.10e-03 | 1.52e-03 | 43 |
| hsa051324 | Colorectum | MSS | Salmonella infection | 92/1875 | 249/8465 | 5.23e-08 | 9.74e-07 | 5.97e-07 | 92 |
| hsa051004 | Colorectum | MSS | Bacterial invasion of epithelial cells | 36/1875 | 77/8465 | 1.41e-06 | 1.82e-05 | 1.11e-05 | 36 |
| hsa051354 | Colorectum | MSS | Yersinia infection | 53/1875 | 137/8465 | 7.73e-06 | 8.93e-05 | 5.47e-05 | 53 |
| hsa051325 | Colorectum | MSS | Salmonella infection | 92/1875 | 249/8465 | 5.23e-08 | 9.74e-07 | 5.97e-07 | 92 |
| hsa051005 | Colorectum | MSS | Bacterial invasion of epithelial cells | 36/1875 | 77/8465 | 1.41e-06 | 1.82e-05 | 1.11e-05 | 36 |
| hsa051355 | Colorectum | MSS | Yersinia infection | 53/1875 | 137/8465 | 7.73e-06 | 8.93e-05 | 5.47e-05 | 53 |
| hsa0510039 | Esophagus | HGIN | Bacterial invasion of epithelial cells | 30/1383 | 77/8465 | 1.49e-06 | 2.31e-05 | 1.84e-05 | 30 |
| hsa0513239 | Esophagus | HGIN | Salmonella infection | 69/1383 | 249/8465 | 3.02e-06 | 4.47e-05 | 3.55e-05 | 69 |
| Page: 1 2 3 |
Top |
Cell-cell communication analysis |
| Identification of potential cell-cell interactions between two cell types and their ligand-receptor pairs for different disease states |
| Ligand | Receptor | LRpair | Pathway | Tissue | Disease Stage |
| Page: 1 |
Top |
Single-cell gene regulatory network inference analysis |
| Find out the significant the regulons (TFs) and the target genes of each regulon across cell types for different disease states |
| TF | Cell Type | Tissue | Disease Stage | Target Gene | RSS | Regulon Activity |
| ∗The dot plots of a searched regulon are shown for all cell subpopulations in each disease state of each tissue based on the regulon specific score inferred using pySCENIC and by calculating the average expression. |
| Page: 1 |
Top |
Somatic mutation of malignant transformation related genes |
| Annotation of somatic variants for genes involved in malignant transformation |
| Hugo Symbol | Variant Class | Variant Classification | dbSNP RS | HGVSc | HGVSp | HGVSp Short | SWISSPROT | BIOTYPE | SIFT | PolyPhen | Tumor Sample Barcode | Tissue | Histology | Sex | Age | Stage | Therapy Types | Drugs | Outcome |
| RHOG | SNV | Missense_Mutation | novel | c.546N>G | p.Ile182Met | p.I182M | P84095 | protein_coding | tolerated(0.12) | benign(0.019) | TCGA-JW-A5VL-01 | Cervix | cervical & endocervical cancer | Female | <65 | I/II | Unknown | Unknown | SD |
| RHOG | SNV | Missense_Mutation | c.197G>A | p.Arg66His | p.R66H | P84095 | protein_coding | deleterious(0.01) | possibly_damaging(0.573) | TCGA-A6-2686-01 | Colorectum | colon adenocarcinoma | Female | >=65 | I/II | Unknown | Unknown | SD | |
| RHOG | SNV | Missense_Mutation | novel | c.236T>C | p.Val79Ala | p.V79A | P84095 | protein_coding | deleterious(0) | benign(0.186) | TCGA-F5-6814-01 | Colorectum | rectum adenocarcinoma | Male | <65 | I/II | Unknown | Unknown | SD |
| RHOG | SNV | Missense_Mutation | novel | c.359G>A | p.Arg120Lys | p.R120K | P84095 | protein_coding | deleterious(0.01) | probably_damaging(0.96) | TCGA-A5-A0G1-01 | Endometrium | uterine corpus endometrioid carcinoma | Female | >=65 | I/II | Unknown | Unknown | SD |
| RHOG | SNV | Missense_Mutation | novel | c.55N>A | p.Leu19Met | p.L19M | P84095 | protein_coding | tolerated(0.18) | probably_damaging(0.949) | TCGA-A5-A0GI-01 | Endometrium | uterine corpus endometrioid carcinoma | Female | <65 | I/II | Unknown | Unknown | SD |
| RHOG | SNV | Missense_Mutation | rs762134439 | c.79N>A | p.Ala27Thr | p.A27T | P84095 | protein_coding | tolerated(0.07) | benign(0.226) | TCGA-A5-A0GP-01 | Endometrium | uterine corpus endometrioid carcinoma | Female | <65 | I/II | Unknown | Unknown | SD |
| RHOG | SNV | Missense_Mutation | rs762134439 | c.79G>A | p.Ala27Thr | p.A27T | P84095 | protein_coding | tolerated(0.07) | benign(0.226) | TCGA-AJ-A3EL-01 | Endometrium | uterine corpus endometrioid carcinoma | Female | <65 | I/II | Unknown | Unknown | SD |
| RHOG | SNV | Missense_Mutation | rs762777142 | c.383G>A | p.Arg128His | p.R128H | P84095 | protein_coding | deleterious(0.02) | benign(0.038) | TCGA-AP-A0LM-01 | Endometrium | uterine corpus endometrioid carcinoma | Female | <65 | III/IV | Chemotherapy | cisplatin | SD |
| RHOG | SNV | Missense_Mutation | rs747848607 | c.235N>A | p.Val79Ile | p.V79I | P84095 | protein_coding | tolerated(0.23) | benign(0.007) | TCGA-AX-A2HD-01 | Endometrium | uterine corpus endometrioid carcinoma | Female | >=65 | III/IV | Unknown | Unknown | SD |
| RHOG | SNV | Missense_Mutation | novel | c.498N>T | p.Lys166Asn | p.K166N | P84095 | protein_coding | deleterious(0.02) | possibly_damaging(0.613) | TCGA-AX-A2HG-01 | Endometrium | uterine corpus endometrioid carcinoma | Female | <65 | I/II | Unknown | Unknown | SD |
| Page: 1 2 3 |
Top |
Related drugs of malignant transformation related genes |
| Identification of chemicals and drugs interact with genes involved in malignant transfromation |
| (DGIdb 4.0) |
| Entrez ID | Symbol | Category | Interaction Types | Drug Claim Name | Drug Name | PMIDs |
| Page: 1 |

Copyright 2023-Present -The University of Texas Health Science Center at Houston |