
|
|||||
|
 | |
| |
| |
| |
| |
| |
|
Gene: REL |
Gene summary for REL |
| Gene information | Species | Human | Gene symbol | REL | Gene ID | 5966 |
| Gene name | REL proto-oncogene, NF-kB subunit | |
| Gene Alias | C-Rel | |
| Cytomap | 2p16.1 | |
| Gene Type | protein-coding | GO ID | GO:0001816 | UniProtAcc | Q04864 |
Top |
Malignant transformation analysis |
| Identification of the aberrant gene expression in precancerous and cancerous lesions by comparing the gene expression of stem-like cells in diseased tissues with normal stem cells |
| Entrez ID | Symbol | Replicates | Species | Organ | Tissue | Adj P-value | Log2FC | Malignancy |
| 5966 | REL | CA_HPV_1 | Human | Cervix | CC | 3.81e-02 | 9.14e-02 | 0.0264 |
| 5966 | REL | CA_HPV_2 | Human | Cervix | CC | 1.51e-02 | 3.59e-01 | 0.0391 |
| 5966 | REL | CA_HPV_3 | Human | Cervix | CC | 3.90e-08 | -1.87e-01 | 0.0414 |
| 5966 | REL | CCII_1 | Human | Cervix | CC | 2.39e-06 | -5.04e-01 | 0.3249 |
| 5966 | REL | sample3 | Human | Cervix | CC | 5.02e-08 | -1.98e-01 | 0.1387 |
| 5966 | REL | H2 | Human | Cervix | HSIL_HPV | 3.62e-02 | -3.34e-01 | 0.0632 |
| 5966 | REL | L1 | Human | Cervix | CC | 8.20e-12 | -5.76e-01 | 0.0802 |
| 5966 | REL | T3 | Human | Cervix | CC | 1.67e-05 | -1.95e-01 | 0.1389 |
| 5966 | REL | LZE2D | Human | Esophagus | HGIN | 6.52e-03 | 8.88e-01 | 0.0642 |
| 5966 | REL | LZE4T | Human | Esophagus | ESCC | 5.80e-37 | 1.46e+00 | 0.0811 |
| 5966 | REL | LZE5T | Human | Esophagus | ESCC | 3.10e-07 | 7.49e-01 | 0.0514 |
| 5966 | REL | LZE7T | Human | Esophagus | ESCC | 1.73e-18 | 1.10e+00 | 0.0667 |
| 5966 | REL | LZE8T | Human | Esophagus | ESCC | 4.14e-15 | 7.71e-01 | 0.067 |
| 5966 | REL | LZE20T | Human | Esophagus | ESCC | 1.86e-03 | 4.49e-01 | 0.0662 |
| 5966 | REL | LZE22D1 | Human | Esophagus | HGIN | 5.12e-07 | 1.44e-01 | 0.0595 |
| 5966 | REL | LZE22T | Human | Esophagus | ESCC | 1.52e-05 | 3.68e-01 | 0.068 |
| 5966 | REL | LZE24T | Human | Esophagus | ESCC | 4.25e-25 | 6.60e-01 | 0.0596 |
| 5966 | REL | LZE21T | Human | Esophagus | ESCC | 4.73e-15 | 1.25e+00 | 0.0655 |
| 5966 | REL | LZE6T | Human | Esophagus | ESCC | 4.59e-05 | 5.02e-01 | 0.0845 |
| 5966 | REL | P1T-E | Human | Esophagus | ESCC | 5.51e-31 | 1.82e+00 | 0.0875 |
| Page: 1 2 3 4 5 6 7 8 9 |
| Tissue | Expression Dynamics | Abbreviation |
| Cervix | 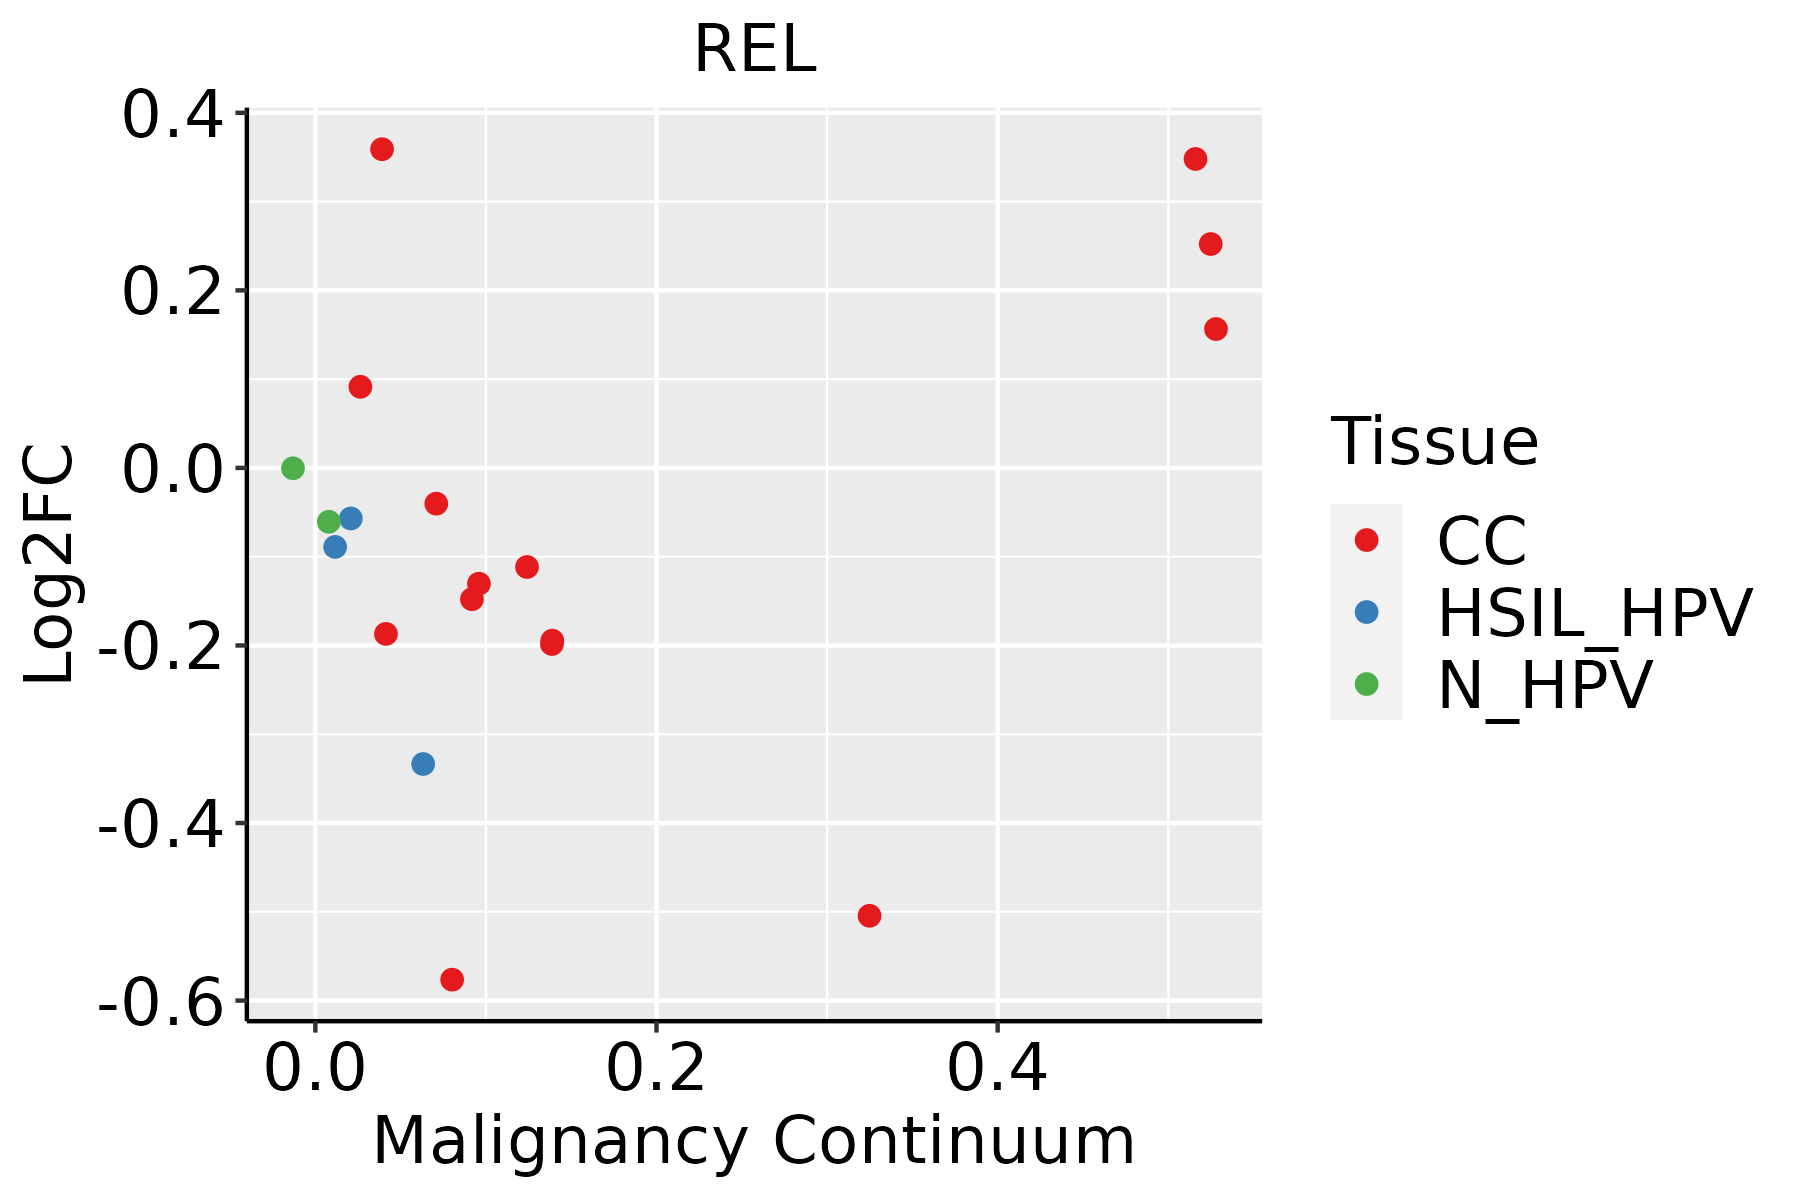 | CC: Cervix cancer |
| HSIL_HPV: HPV-infected high-grade squamous intraepithelial lesions | ||
| N_HPV: HPV-infected normal cervix | ||
| Esophagus | 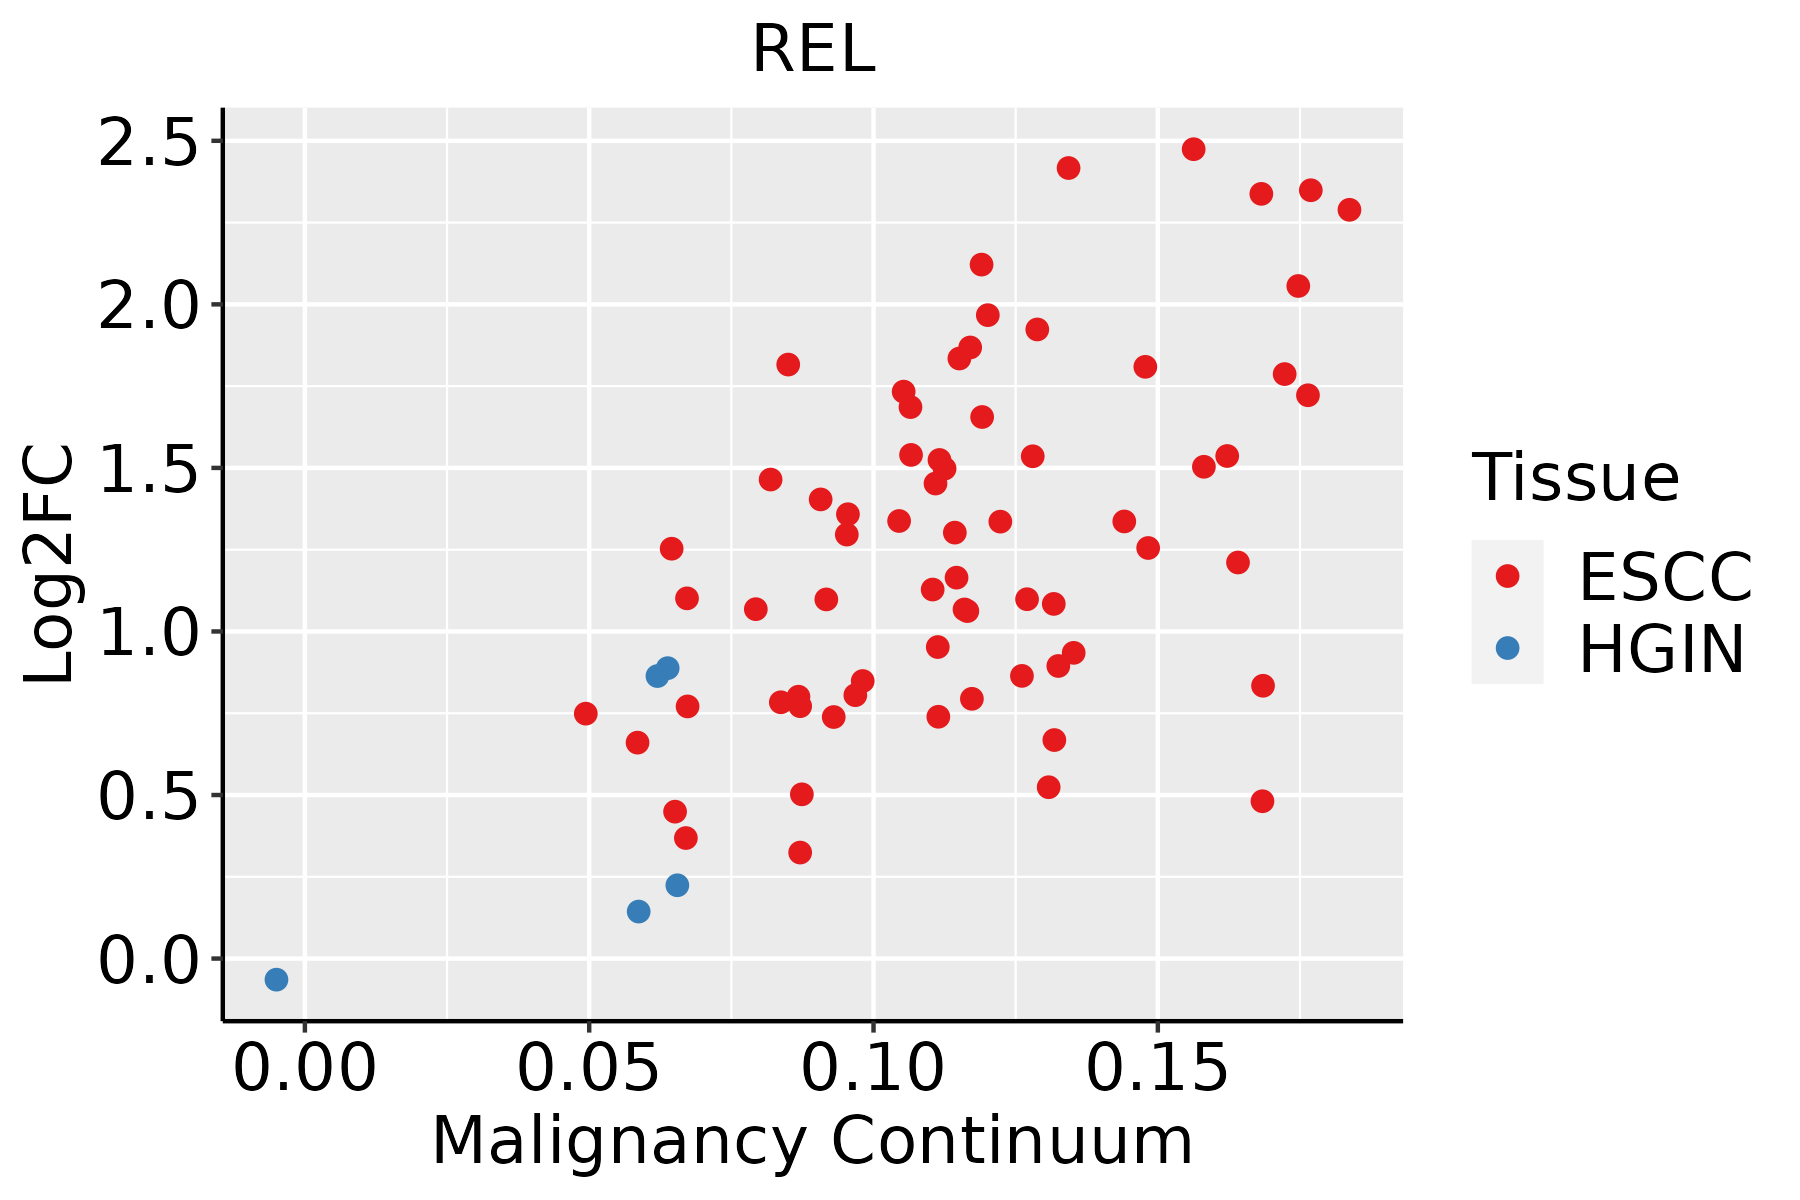 | ESCC: Esophageal squamous cell carcinoma |
| HGIN: High-grade intraepithelial neoplasias | ||
| LGIN: Low-grade intraepithelial neoplasias | ||
| Liver | 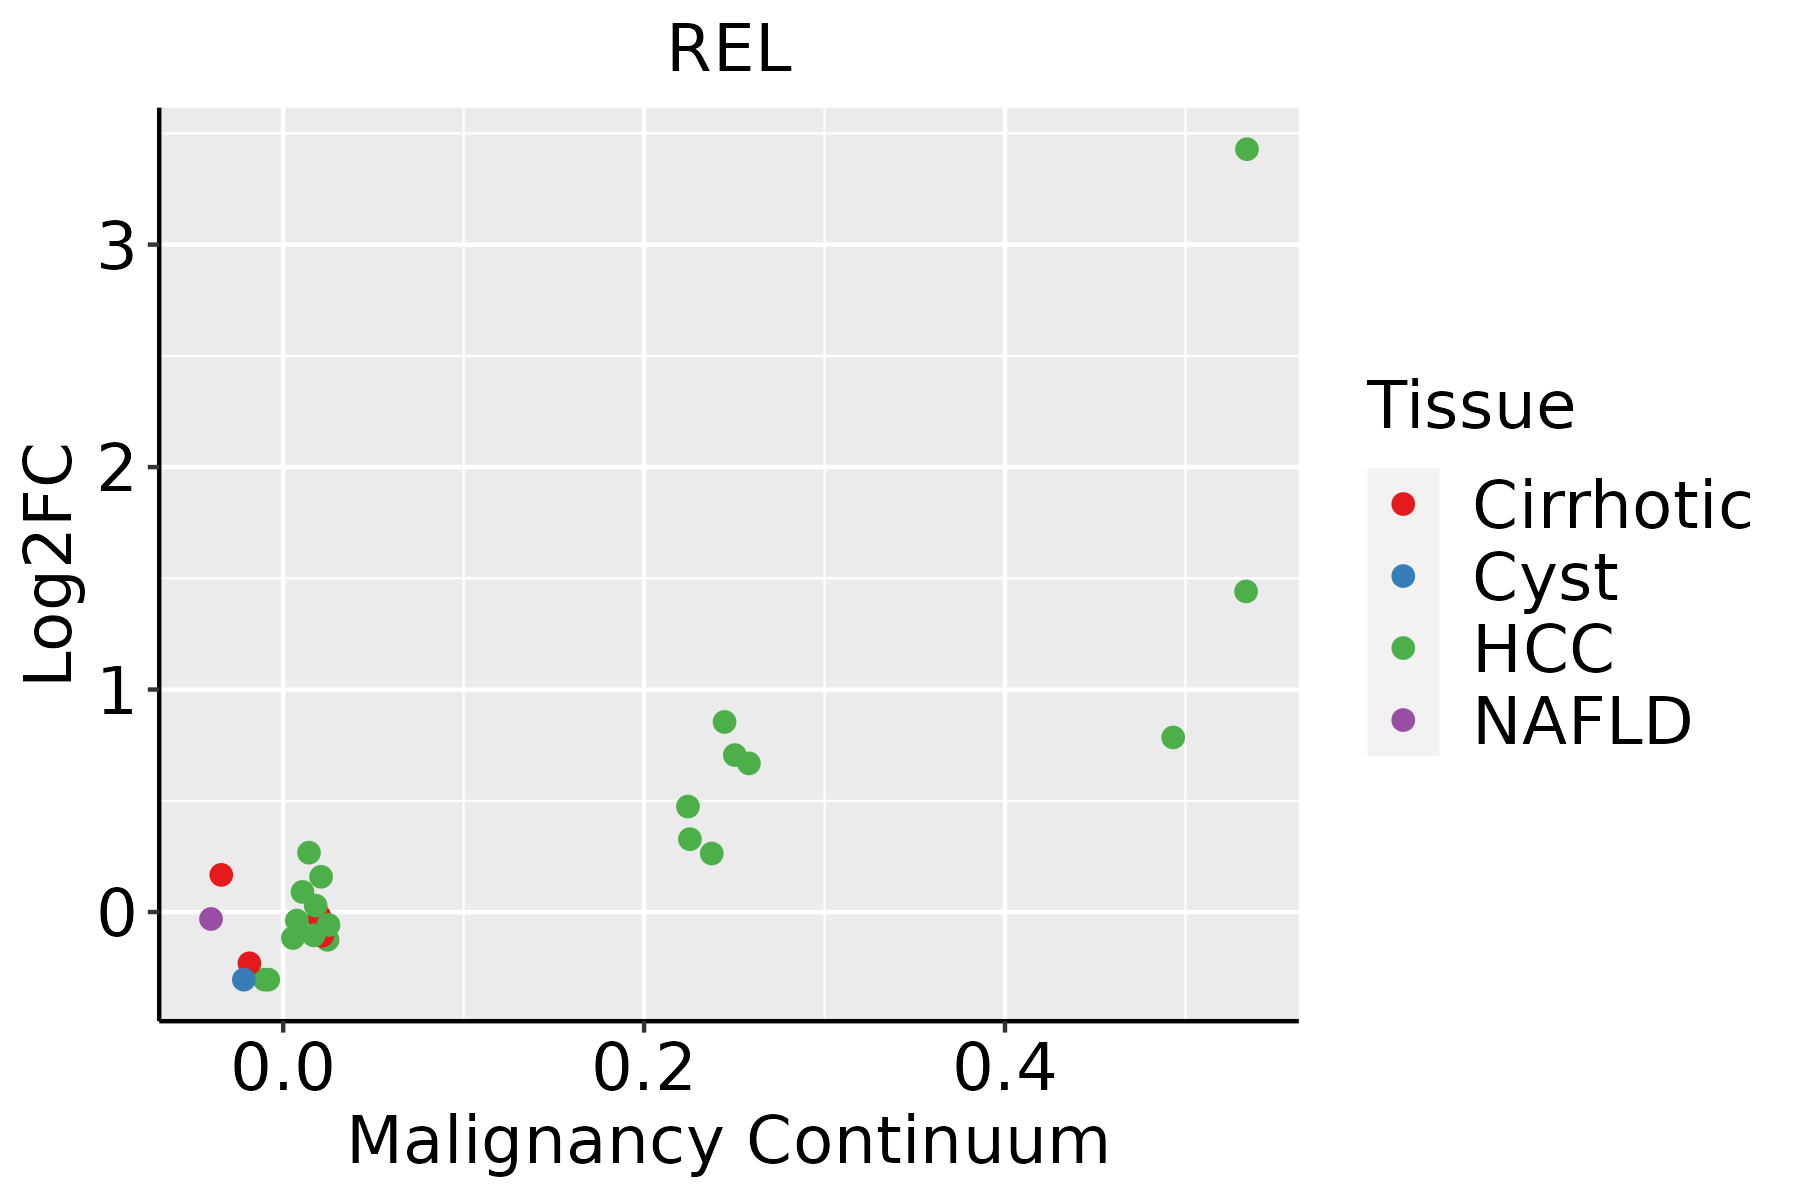 | HCC: Hepatocellular carcinoma |
| NAFLD: Non-alcoholic fatty liver disease | ||
| Lung | 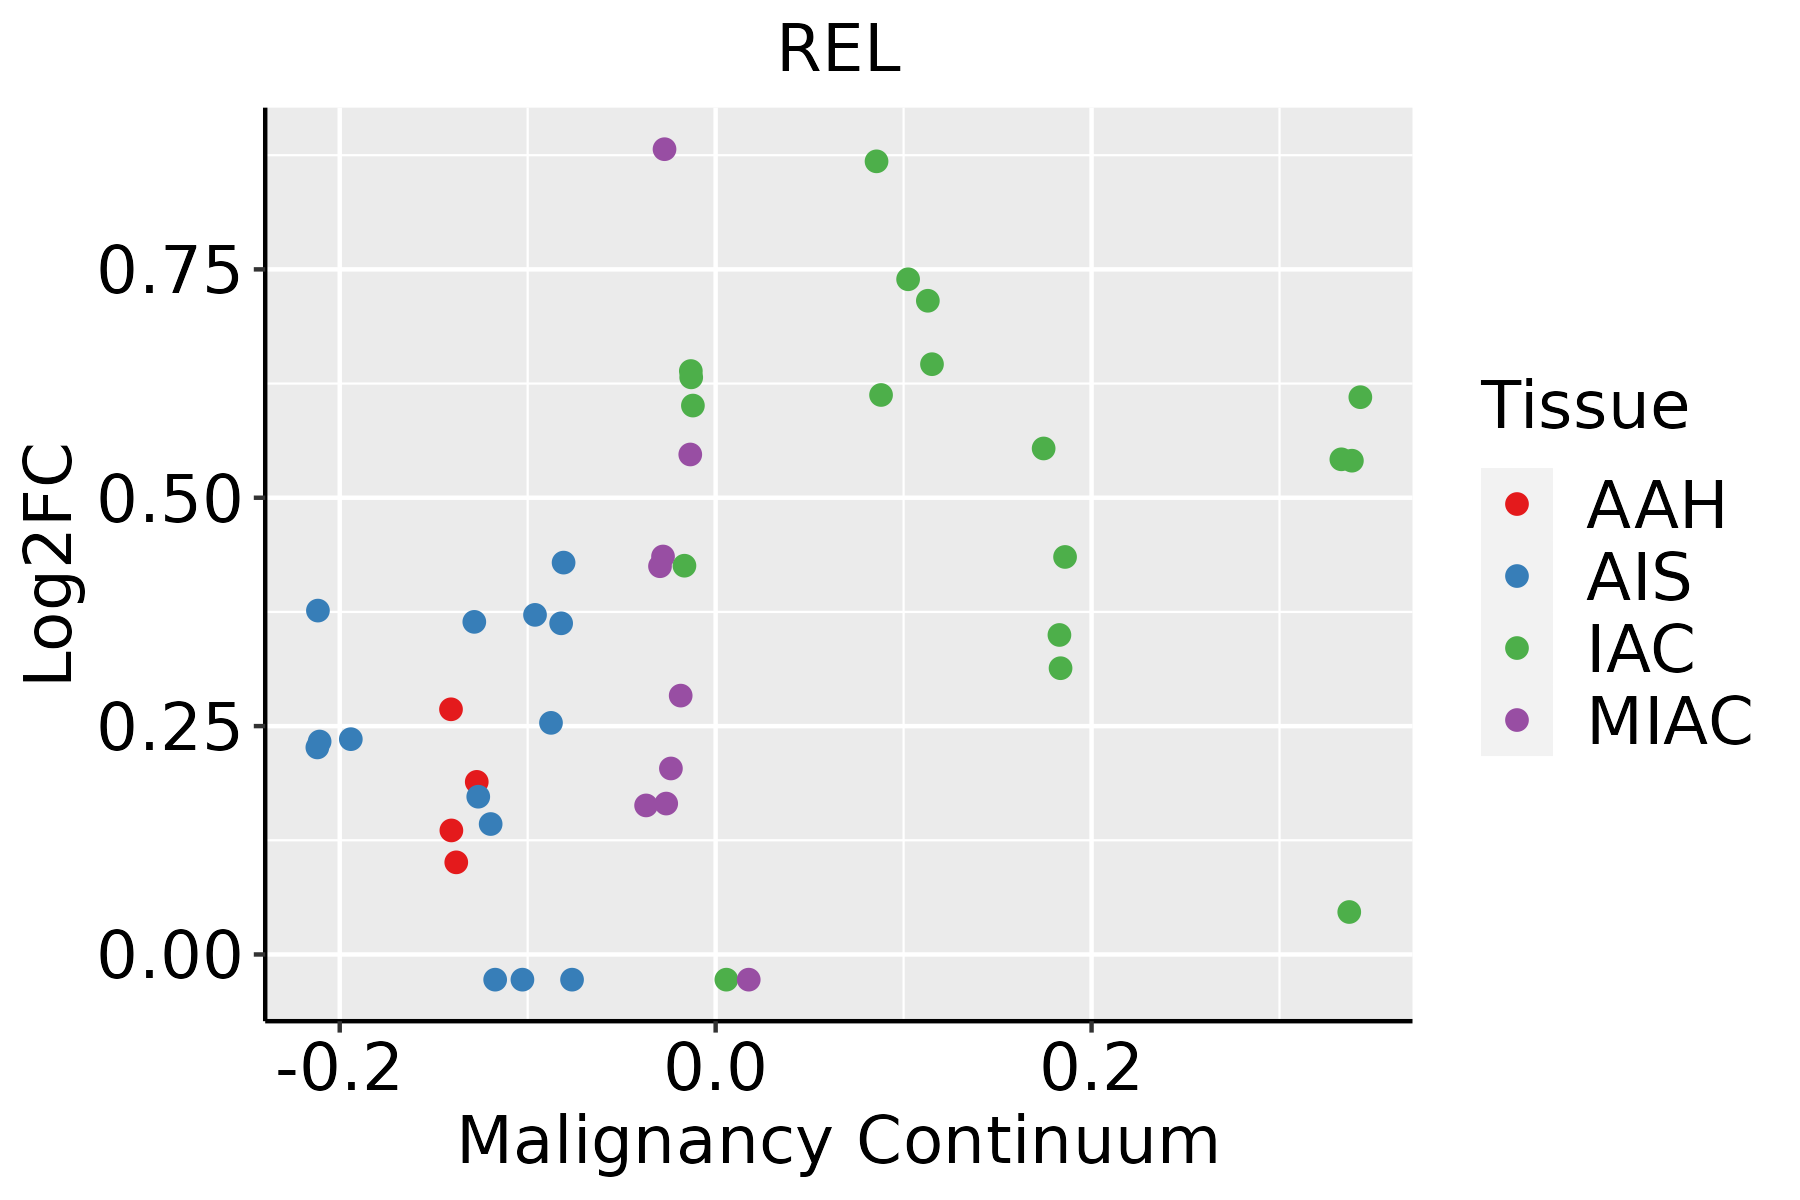 | AAH: Atypical adenomatous hyperplasia |
| AIS: Adenocarcinoma in situ | ||
| IAC: Invasive lung adenocarcinoma | ||
| MIA: Minimally invasive adenocarcinoma | ||
| Oral Cavity | 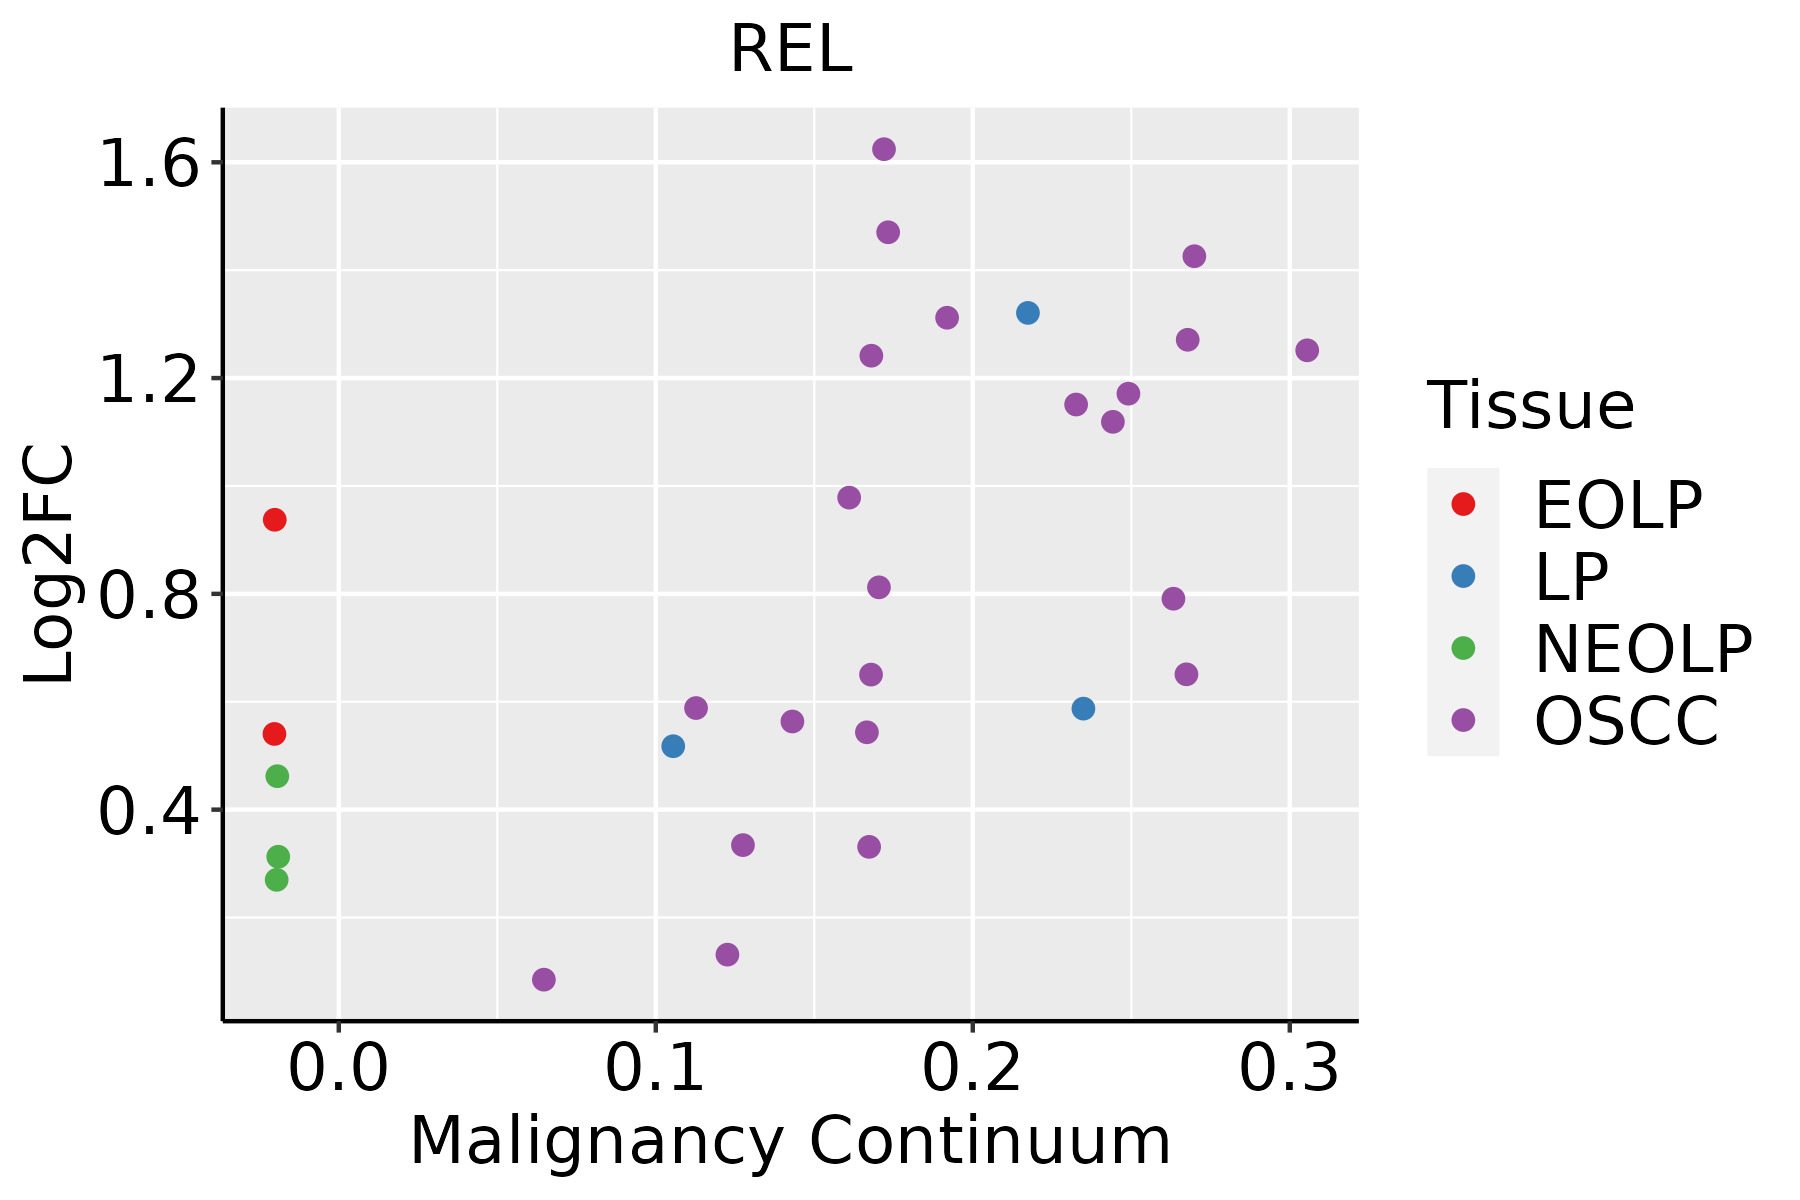 | EOLP: Erosive Oral lichen planus |
| LP: leukoplakia | ||
| NEOLP: Non-erosive oral lichen planus | ||
| OSCC: Oral squamous cell carcinoma | ||
| Prostate | 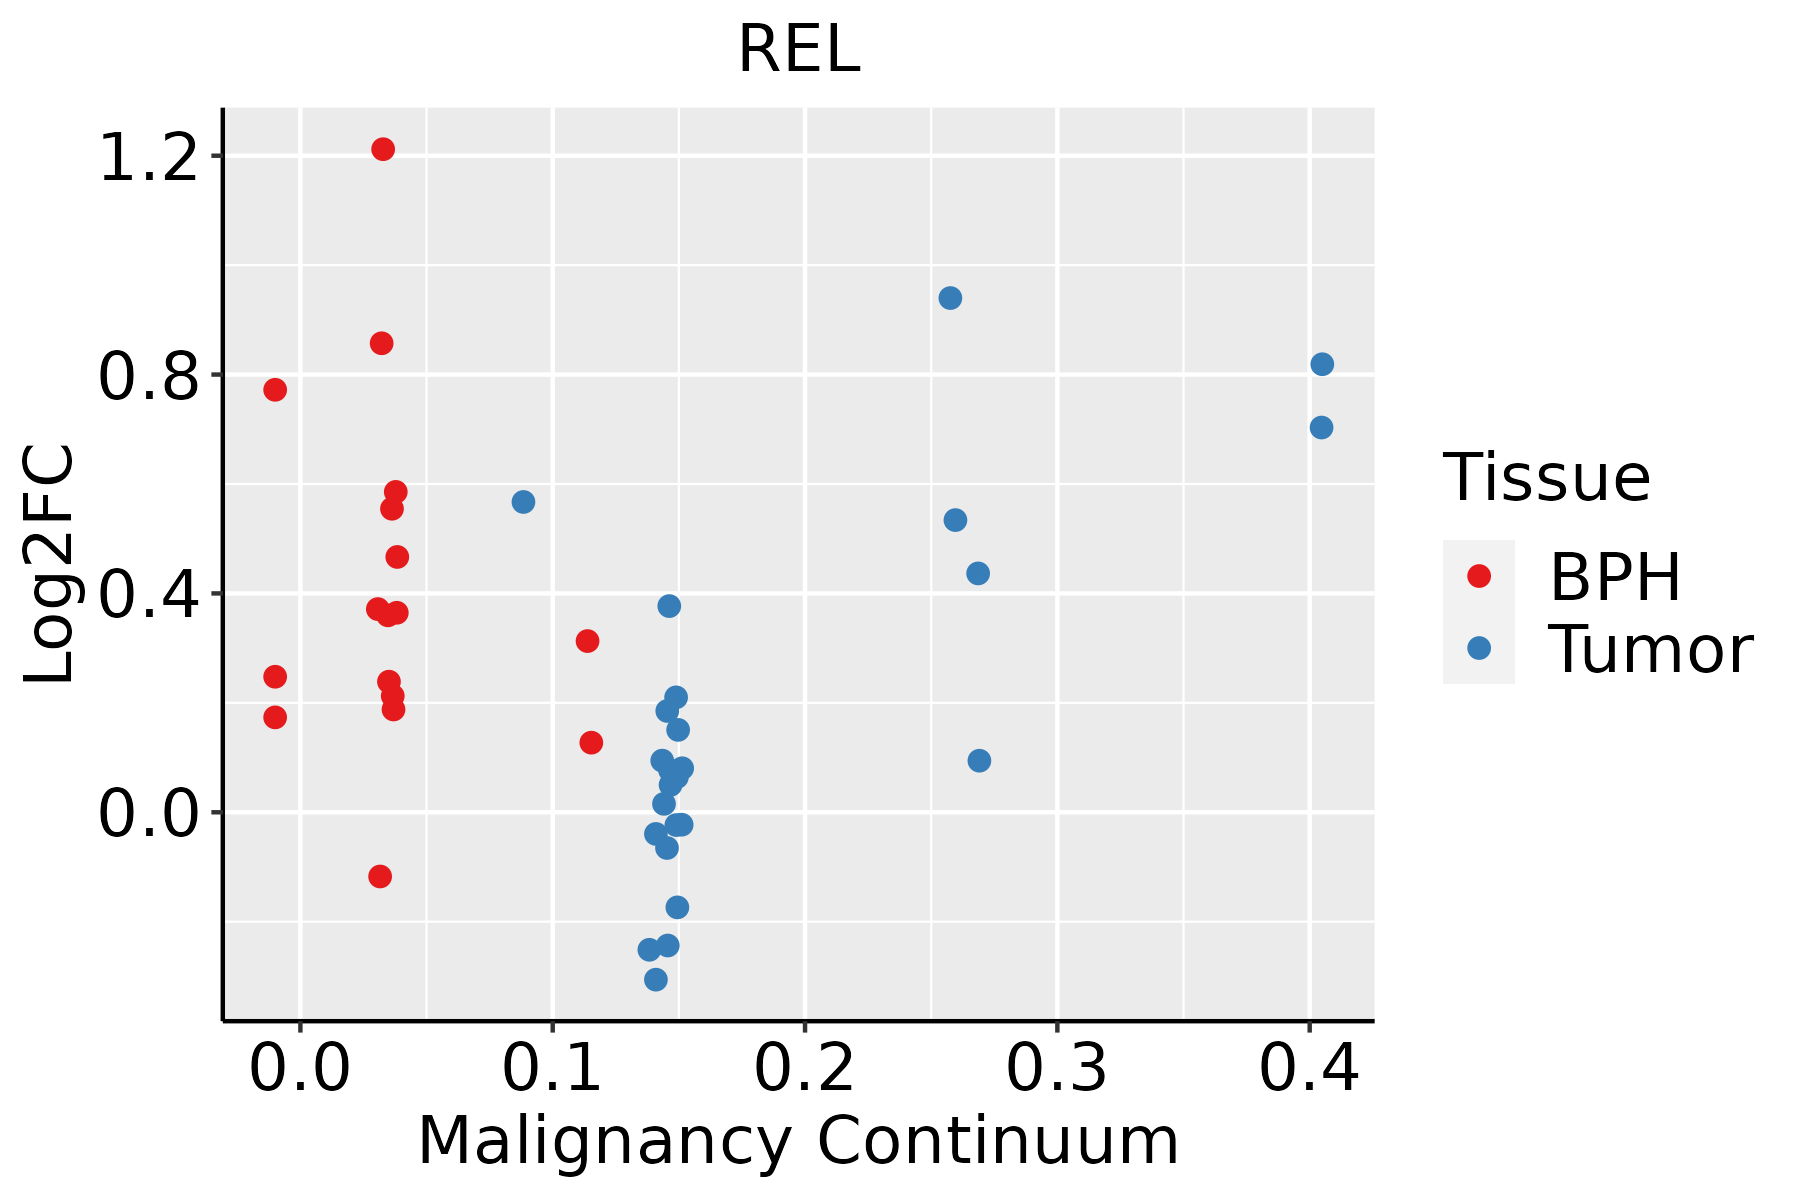 | BPH: Benign Prostatic Hyperplasia |
| Skin | 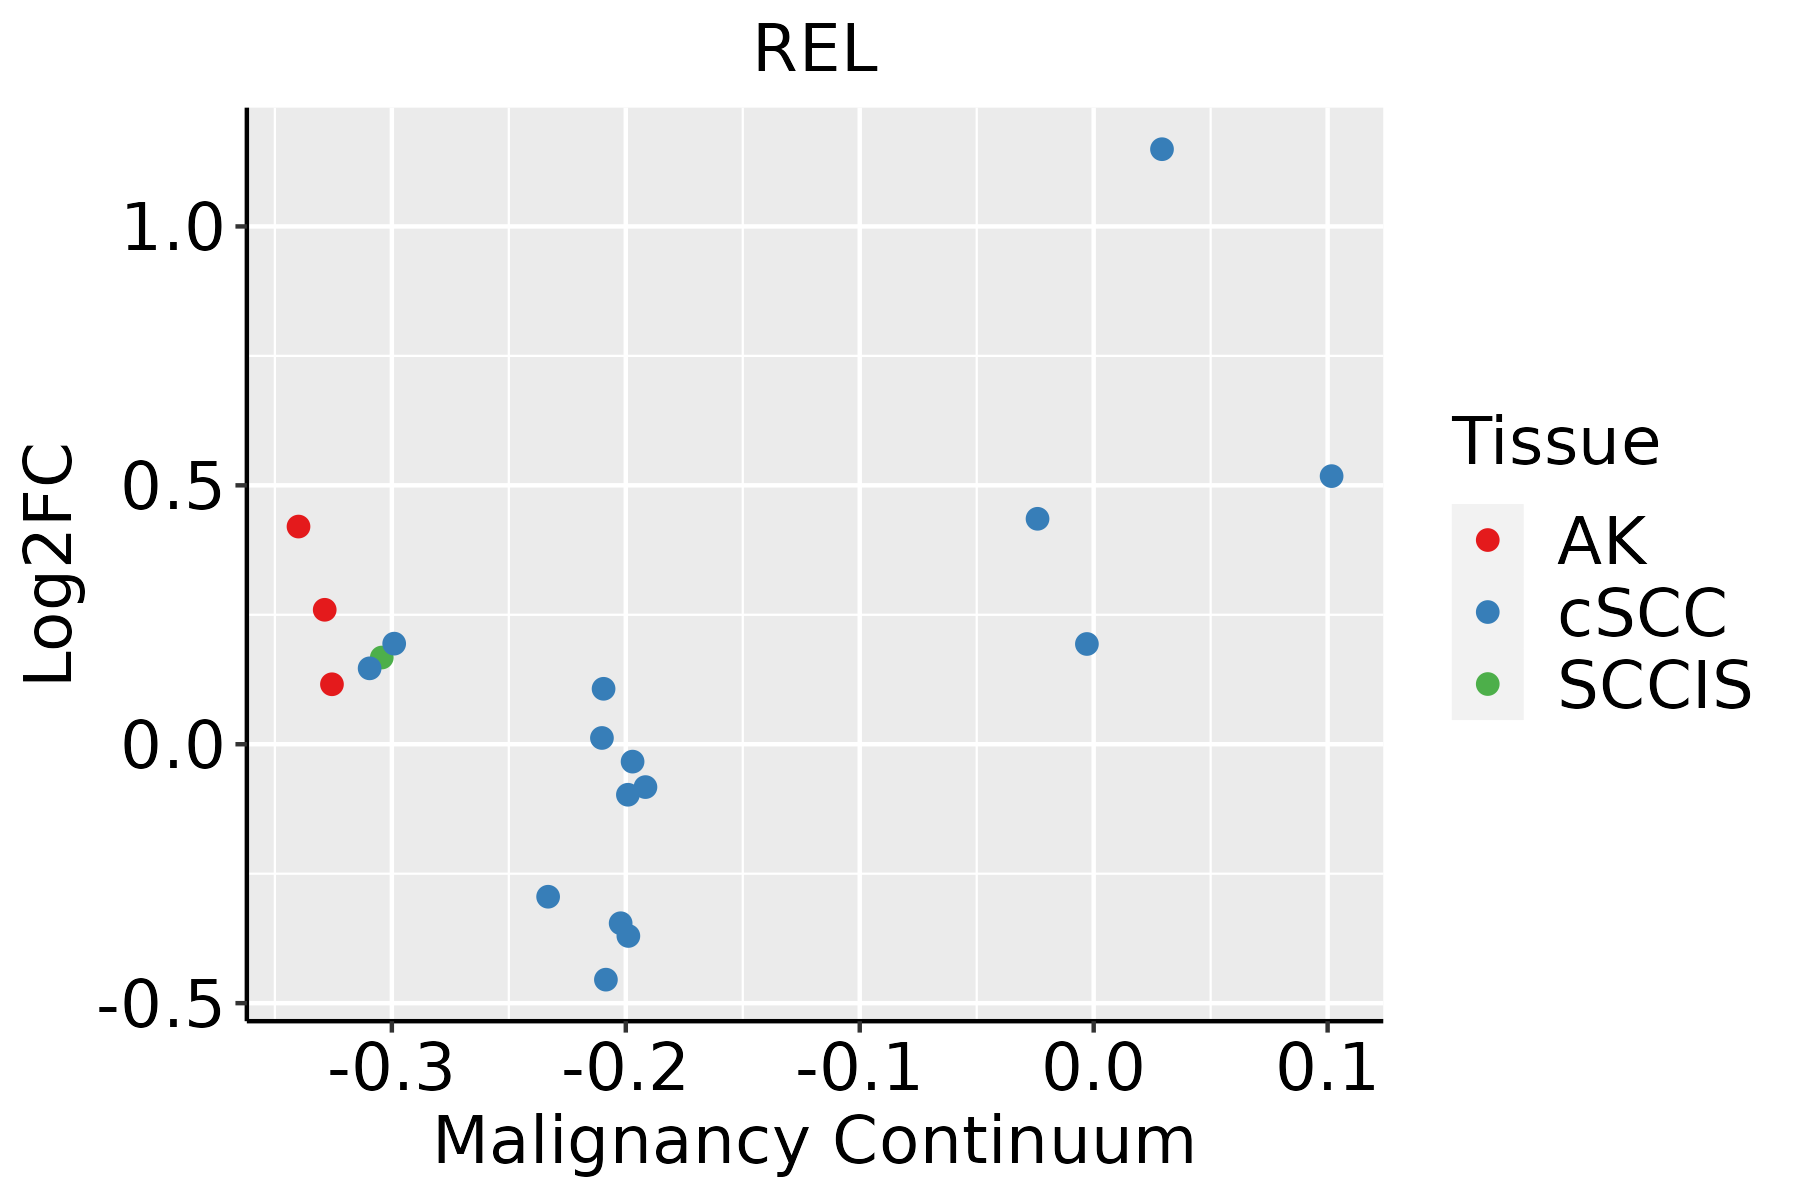 | AK: Actinic keratosis |
| cSCC: Cutaneous squamous cell carcinoma | ||
| SCCIS:squamous cell carcinoma in situ | ||
| Thyroid | 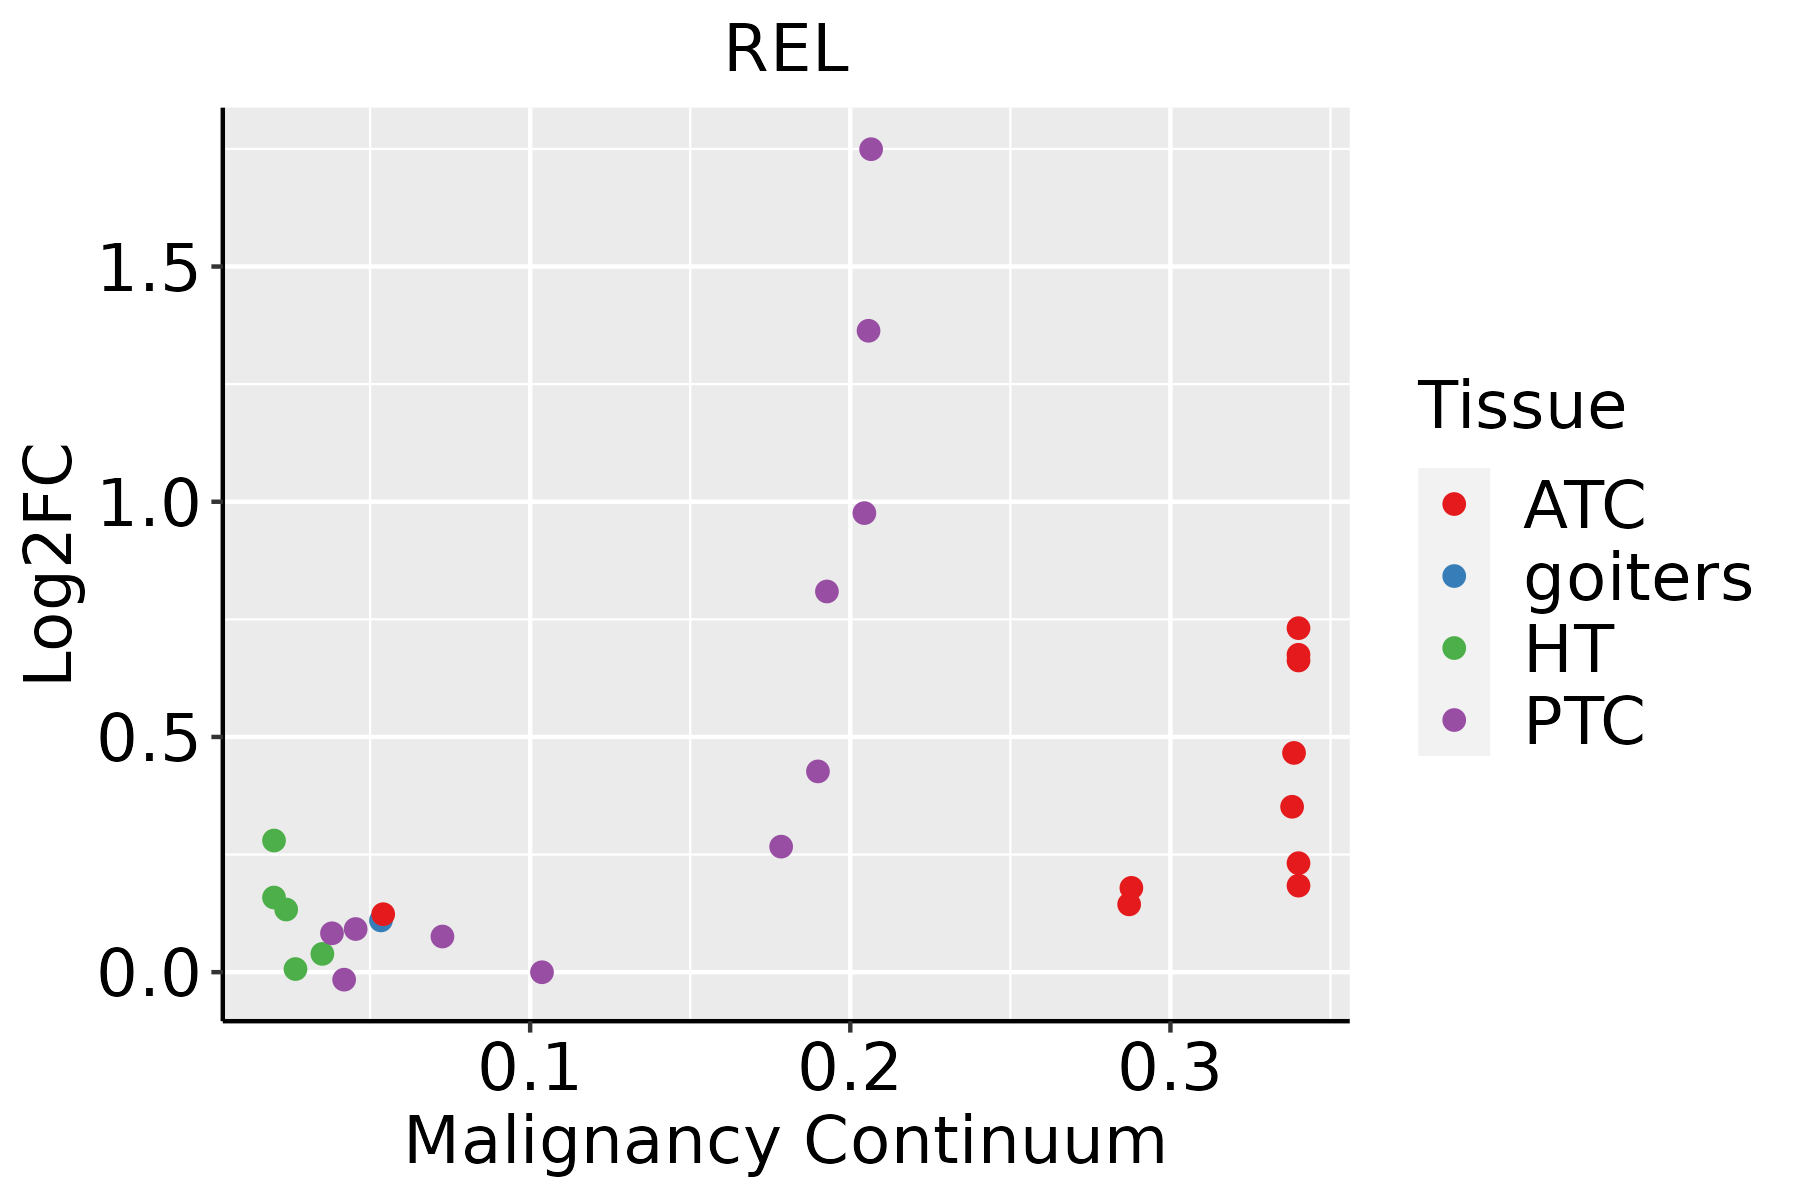 | ATC: Anaplastic thyroid cancer |
| HT: Hashimoto's thyroiditis | ||
| PTC: Papillary thyroid cancer |
| ∗log2FC in expression of this searched gene in stem-like cells from each diseased tissue sample relative to stem-like cells in normal samples in each tissue plotted against the malignancy continuum. Samples are colored based on if they are from different disease stage. |
Top |
Malignant transformation related pathway analysis |
| Find out the enriched GO biological processes and KEGG pathways involved in transition from healthy to precancer to cancer |
| Tissue | Disease Stage | Enriched GO biological Processes |
| Colorectum | AD |  |
| Colorectum | SER |  |
| Colorectum | MSS |  |
| Colorectum | MSI-H |  |
| Colorectum | FAP |  |
| ∗Top 15 enriched GO BP terms are showed in the bar plot of each disease state in each tissue. Each row represents a significant GO biological process which is colored according to the -log10(p.adjust). |
| Page: 1 2 3 4 5 6 7 8 9 |
| GO ID | Tissue | Disease Stage | Description | Gene Ratio | Bg Ratio | pvalue | p.adjust | Count |
| GO:190121410 | Cervix | CC | regulation of neuron death | 61/2311 | 319/18723 | 3.11e-04 | 3.31e-03 | 61 |
| GO:0045580 | Cervix | CC | regulation of T cell differentiation | 33/2311 | 146/18723 | 3.75e-04 | 3.87e-03 | 33 |
| GO:00302173 | Cervix | CC | T cell differentiation | 51/2311 | 257/18723 | 3.81e-04 | 3.89e-03 | 51 |
| GO:19031314 | Cervix | CC | mononuclear cell differentiation | 76/2311 | 426/18723 | 5.66e-04 | 5.42e-03 | 76 |
| GO:00456192 | Cervix | CC | regulation of lymphocyte differentiation | 37/2311 | 174/18723 | 6.06e-04 | 5.69e-03 | 37 |
| GO:00086379 | Cervix | CC | apoptotic mitochondrial changes | 25/2311 | 107/18723 | 1.11e-03 | 9.14e-03 | 25 |
| GO:00018368 | Cervix | CC | release of cytochrome c from mitochondria | 16/2311 | 59/18723 | 1.65e-03 | 1.27e-02 | 16 |
| GO:00431237 | Cervix | CC | positive regulation of I-kappaB kinase/NF-kappaB signaling | 37/2311 | 186/18723 | 2.15e-03 | 1.55e-02 | 37 |
| GO:00324791 | Cervix | CC | regulation of type I interferon production | 21/2311 | 95/18723 | 5.32e-03 | 3.10e-02 | 21 |
| GO:00326061 | Cervix | CC | type I interferon production | 21/2311 | 95/18723 | 5.32e-03 | 3.10e-02 | 21 |
| GO:00300981 | Cervix | CC | lymphocyte differentiation | 63/2311 | 374/18723 | 6.21e-03 | 3.52e-02 | 63 |
| GO:007099715 | Cervix | HSIL_HPV | neuron death | 30/737 | 361/18723 | 1.02e-04 | 2.16e-03 | 30 |
| GO:190121415 | Cervix | HSIL_HPV | regulation of neuron death | 24/737 | 319/18723 | 1.92e-03 | 2.02e-02 | 24 |
| GO:0001818 | Cervix | HSIL_HPV | negative regulation of cytokine production | 25/737 | 357/18723 | 4.05e-03 | 3.47e-02 | 25 |
| GO:004312215 | Cervix | HSIL_HPV | regulation of I-kappaB kinase/NF-kappaB signaling | 19/737 | 249/18723 | 4.66e-03 | 3.88e-02 | 19 |
| GO:200123325 | Cervix | N_HPV | regulation of apoptotic signaling pathway | 36/534 | 356/18723 | 4.95e-11 | 5.63e-08 | 36 |
| GO:000609124 | Cervix | N_HPV | generation of precursor metabolites and energy | 40/534 | 490/18723 | 2.59e-09 | 7.88e-07 | 40 |
| GO:004211022 | Cervix | N_HPV | T cell activation | 39/534 | 487/18723 | 7.04e-09 | 1.58e-06 | 39 |
| GO:005254824 | Cervix | N_HPV | regulation of endopeptidase activity | 36/534 | 432/18723 | 9.74e-09 | 1.72e-06 | 36 |
| GO:004533324 | Cervix | N_HPV | cellular respiration | 25/534 | 230/18723 | 1.10e-08 | 1.85e-06 | 25 |
| Page: 1 2 3 4 5 6 7 8 9 10 11 12 13 14 15 16 17 18 19 20 21 22 23 24 25 26 27 28 29 30 31 32 33 34 35 36 37 38 39 40 41 42 43 44 45 46 47 48 49 50 51 52 53 54 55 56 57 58 59 60 61 62 63 64 65 66 67 68 69 70 71 72 73 74 75 76 77 78 |
| Pathway ID | Tissue | Disease Stage | Description | Gene Ratio | Bg Ratio | pvalue | p.adjust | qvalue | Count |
| hsa040142 | Cervix | CC | Ras signaling pathway | 51/1267 | 236/8465 | 3.55e-03 | 1.34e-02 | 7.91e-03 | 51 |
| hsa0401411 | Cervix | CC | Ras signaling pathway | 51/1267 | 236/8465 | 3.55e-03 | 1.34e-02 | 7.91e-03 | 51 |
| hsa052039 | Esophagus | HGIN | Viral carcinogenesis | 53/1383 | 204/8465 | 2.58e-04 | 2.71e-03 | 2.15e-03 | 53 |
| hsa0520315 | Esophagus | HGIN | Viral carcinogenesis | 53/1383 | 204/8465 | 2.58e-04 | 2.71e-03 | 2.15e-03 | 53 |
| hsa0520325 | Esophagus | ESCC | Viral carcinogenesis | 137/4205 | 204/8465 | 2.47e-07 | 1.88e-06 | 9.62e-07 | 137 |
| hsa052028 | Esophagus | ESCC | Transcriptional misregulation in cancer | 116/4205 | 193/8465 | 2.08e-03 | 5.95e-03 | 3.05e-03 | 116 |
| hsa0520335 | Esophagus | ESCC | Viral carcinogenesis | 137/4205 | 204/8465 | 2.47e-07 | 1.88e-06 | 9.62e-07 | 137 |
| hsa0520213 | Esophagus | ESCC | Transcriptional misregulation in cancer | 116/4205 | 193/8465 | 2.08e-03 | 5.95e-03 | 3.05e-03 | 116 |
| hsa05203 | Liver | Cirrhotic | Viral carcinogenesis | 76/2530 | 204/8465 | 1.34e-02 | 4.20e-02 | 2.59e-02 | 76 |
| hsa052031 | Liver | Cirrhotic | Viral carcinogenesis | 76/2530 | 204/8465 | 1.34e-02 | 4.20e-02 | 2.59e-02 | 76 |
| hsa052032 | Liver | HCC | Viral carcinogenesis | 117/4020 | 204/8465 | 2.68e-03 | 8.98e-03 | 5.00e-03 | 117 |
| hsa052033 | Liver | HCC | Viral carcinogenesis | 117/4020 | 204/8465 | 2.68e-03 | 8.98e-03 | 5.00e-03 | 117 |
| hsa052034 | Lung | IAC | Viral carcinogenesis | 43/1053 | 204/8465 | 3.02e-04 | 3.07e-03 | 2.04e-03 | 43 |
| hsa052026 | Lung | IAC | Transcriptional misregulation in cancer | 40/1053 | 193/8465 | 6.90e-04 | 5.90e-03 | 3.92e-03 | 40 |
| hsa0520311 | Lung | IAC | Viral carcinogenesis | 43/1053 | 204/8465 | 3.02e-04 | 3.07e-03 | 2.04e-03 | 43 |
| hsa0520211 | Lung | IAC | Transcriptional misregulation in cancer | 40/1053 | 193/8465 | 6.90e-04 | 5.90e-03 | 3.92e-03 | 40 |
| hsa052022 | Lung | AIS | Transcriptional misregulation in cancer | 39/961 | 193/8465 | 2.15e-04 | 2.41e-03 | 1.54e-03 | 39 |
| hsa0520321 | Lung | AIS | Viral carcinogenesis | 37/961 | 204/8465 | 2.49e-03 | 1.49e-02 | 9.55e-03 | 37 |
| hsa052023 | Lung | AIS | Transcriptional misregulation in cancer | 39/961 | 193/8465 | 2.15e-04 | 2.41e-03 | 1.54e-03 | 39 |
| hsa0520331 | Lung | AIS | Viral carcinogenesis | 37/961 | 204/8465 | 2.49e-03 | 1.49e-02 | 9.55e-03 | 37 |
| Page: 1 2 |
Top |
Cell-cell communication analysis |
| Identification of potential cell-cell interactions between two cell types and their ligand-receptor pairs for different disease states |
| Ligand | Receptor | LRpair | Pathway | Tissue | Disease Stage |
| Page: 1 |
Top |
Single-cell gene regulatory network inference analysis |
| Find out the significant the regulons (TFs) and the target genes of each regulon across cell types for different disease states |
| TF | Cell Type | Tissue | Disease Stage | Target Gene | RSS | Regulon Activity |
| REL | INCAF | Colorectum | Healthy | NFATC1,ACSL4,FAM177A1, etc. | 1.46e-01 |  |
| REL | QUIE | Esophagus | ESCC | TNFAIP3,SKIL,PNRC1, etc. | 9.27e-02 |  |
| REL | DIFF | Esophagus | Healthy | BCAR3,PXN,SRF, etc. | 1.09e-01 |  |
| REL | AT2 | Lung | IAC | EML4,MAP3K8,CHD1, etc. | 1.81e-01 |  |
| ∗The dot plots of a searched regulon are shown for all cell subpopulations in each disease state of each tissue based on the regulon specific score inferred using pySCENIC and by calculating the average expression. |
| Page: 1 |
Top |
Somatic mutation of malignant transformation related genes |
| Annotation of somatic variants for genes involved in malignant transformation |
| Hugo Symbol | Variant Class | Variant Classification | dbSNP RS | HGVSc | HGVSp | HGVSp Short | SWISSPROT | BIOTYPE | SIFT | PolyPhen | Tumor Sample Barcode | Tissue | Histology | Sex | Age | Stage | Therapy Types | Drugs | Outcome |
| REL | SNV | Missense_Mutation | rs758702004 | c.392N>G | p.Asn131Ser | p.N131S | Q04864 | protein_coding | tolerated(0.14) | benign(0.012) | TCGA-A7-A3IZ-01 | Breast | breast invasive carcinoma | Female | <65 | I/II | Chemotherapy | cytoxan | SD |
| REL | SNV | Missense_Mutation | novel | c.279T>G | p.Phe93Leu | p.F93L | Q04864 | protein_coding | tolerated(0.46) | probably_damaging(0.92) | TCGA-A7-A4SD-01 | Breast | breast invasive carcinoma | Female | <65 | I/II | Chemotherapy | taxotere | CR |
| REL | SNV | Missense_Mutation | c.1066N>A | p.Glu356Lys | p.E356K | Q04864 | protein_coding | deleterious(0) | possibly_damaging(0.629) | TCGA-AN-A04C-01 | Breast | breast invasive carcinoma | Female | <65 | I/II | Unknown | Unknown | SD | |
| REL | insertion | Frame_Shift_Ins | novel | c.728_729insCACCAGATTAATC | p.Phe244ThrfsTer29 | p.F244Tfs*29 | Q04864 | protein_coding | TCGA-AR-A0U0-01 | Breast | breast invasive carcinoma | Female | >=65 | I/II | Unknown | Unknown | SD | ||
| REL | insertion | In_Frame_Ins | novel | c.1828_1829insGCCTACAGGGGTTTCAAGTCAAGCAGAATCCTACTATCCCTC | p.Asp610delinsGlyLeuGlnGlyPheGlnValLysGlnAsnProThrIleProHis | p.D610delinsGLQGFQVKQNPTIPH | Q04864 | protein_coding | TCGA-B6-A0IA-01 | Breast | breast invasive carcinoma | Female | <65 | I/II | Unknown | Unknown | SD | ||
| REL | SNV | Missense_Mutation | novel | c.65G>A | p.Arg22His | p.R22H | Q04864 | protein_coding | deleterious(0) | probably_damaging(0.999) | TCGA-2W-A8YY-01 | Cervix | cervical & endocervical cancer | Female | <65 | I/II | Chemotherapy | cisplatin | CR |
| REL | SNV | Missense_Mutation | c.469N>G | p.Pro157Ala | p.P157A | Q04864 | protein_coding | tolerated(0.11) | benign(0.127) | TCGA-C5-A1M8-01 | Cervix | cervical & endocervical cancer | Female | <65 | I/II | Unknown | Unknown | SD | |
| REL | SNV | Missense_Mutation | c.607N>A | p.Glu203Lys | p.E203K | Q04864 | protein_coding | deleterious(0) | probably_damaging(0.995) | TCGA-EK-A2PL-01 | Cervix | cervical & endocervical cancer | Female | <65 | III/IV | Unknown | Unknown | SD | |
| REL | SNV | Missense_Mutation | c.946N>A | p.Asp316Asn | p.D316N | Q04864 | protein_coding | tolerated_low_confidence(0.61) | benign(0) | TCGA-JW-A852-01 | Cervix | cervical & endocervical cancer | Female | <65 | I/II | Unknown | Unknown | PD | |
| REL | SNV | Missense_Mutation | c.1722N>A | p.Met574Ile | p.M574I | Q04864 | protein_coding | tolerated_low_confidence(0.12) | benign(0) | TCGA-LP-A4AV-01 | Cervix | cervical & endocervical cancer | Female | <65 | I/II | Unknown | Unknown | SD |
| Page: 1 2 3 4 5 6 7 |
Top |
Related drugs of malignant transformation related genes |
| Identification of chemicals and drugs interact with genes involved in malignant transfromation |
| (DGIdb 4.0) |
| Entrez ID | Symbol | Category | Interaction Types | Drug Claim Name | Drug Name | PMIDs |
| Page: 1 |

Copyright 2023-Present -The University of Texas Health Science Center at Houston |