
|
|||||
|
 | |
| |
| |
| |
| |
| |
|
Gene: PTAFR |
Gene summary for PTAFR |
| Gene information | Species | Human | Gene symbol | PTAFR | Gene ID | 5724 |
| Gene name | platelet activating factor receptor | |
| Gene Alias | PAFR | |
| Cytomap | 1p35.3 | |
| Gene Type | protein-coding | GO ID | GO:0000003 | UniProtAcc | P25105 |
Top |
Malignant transformation analysis |
| Identification of the aberrant gene expression in precancerous and cancerous lesions by comparing the gene expression of stem-like cells in diseased tissues with normal stem cells |
| Entrez ID | Symbol | Replicates | Species | Organ | Tissue | Adj P-value | Log2FC | Malignancy |
| 5724 | PTAFR | P1T-E | Human | Esophagus | ESCC | 2.00e-02 | 1.51e-01 | 0.0875 |
| 5724 | PTAFR | P8T-E | Human | Esophagus | ESCC | 1.33e-10 | 1.22e-01 | 0.0889 |
| 5724 | PTAFR | P9T-E | Human | Esophagus | ESCC | 8.55e-03 | -7.21e-03 | 0.1131 |
| 5724 | PTAFR | P21T-E | Human | Esophagus | ESCC | 8.67e-10 | 3.35e-01 | 0.1617 |
| 5724 | PTAFR | P24T-E | Human | Esophagus | ESCC | 1.51e-03 | -2.98e-02 | 0.1287 |
| 5724 | PTAFR | P26T-E | Human | Esophagus | ESCC | 9.56e-11 | 4.52e-02 | 0.1276 |
| 5724 | PTAFR | P27T-E | Human | Esophagus | ESCC | 5.44e-04 | 5.52e-02 | 0.1055 |
| 5724 | PTAFR | P28T-E | Human | Esophagus | ESCC | 1.80e-02 | -3.66e-02 | 0.1149 |
| 5724 | PTAFR | P31T-E | Human | Esophagus | ESCC | 6.79e-03 | -3.24e-02 | 0.1251 |
| 5724 | PTAFR | P36T-E | Human | Esophagus | ESCC | 3.46e-02 | -1.09e-02 | 0.1187 |
| 5724 | PTAFR | P37T-E | Human | Esophagus | ESCC | 9.17e-06 | 1.34e-01 | 0.1371 |
| 5724 | PTAFR | P40T-E | Human | Esophagus | ESCC | 1.07e-03 | 5.40e-02 | 0.109 |
| 5724 | PTAFR | P42T-E | Human | Esophagus | ESCC | 1.29e-02 | 1.26e-01 | 0.1175 |
| 5724 | PTAFR | P47T-E | Human | Esophagus | ESCC | 1.24e-03 | -1.87e-02 | 0.1067 |
| 5724 | PTAFR | P52T-E | Human | Esophagus | ESCC | 4.09e-07 | 1.34e-01 | 0.1555 |
| 5724 | PTAFR | P54T-E | Human | Esophagus | ESCC | 5.40e-03 | 6.92e-02 | 0.0975 |
| 5724 | PTAFR | P61T-E | Human | Esophagus | ESCC | 6.64e-05 | 2.47e-02 | 0.099 |
| 5724 | PTAFR | P62T-E | Human | Esophagus | ESCC | 1.71e-02 | 1.34e-01 | 0.1302 |
| 5724 | PTAFR | P65T-E | Human | Esophagus | ESCC | 9.33e-03 | 1.42e-01 | 0.0978 |
| 5724 | PTAFR | P74T-E | Human | Esophagus | ESCC | 4.86e-03 | 3.10e-01 | 0.1479 |
| Page: 1 2 3 |
| Tissue | Expression Dynamics | Abbreviation |
| Esophagus | 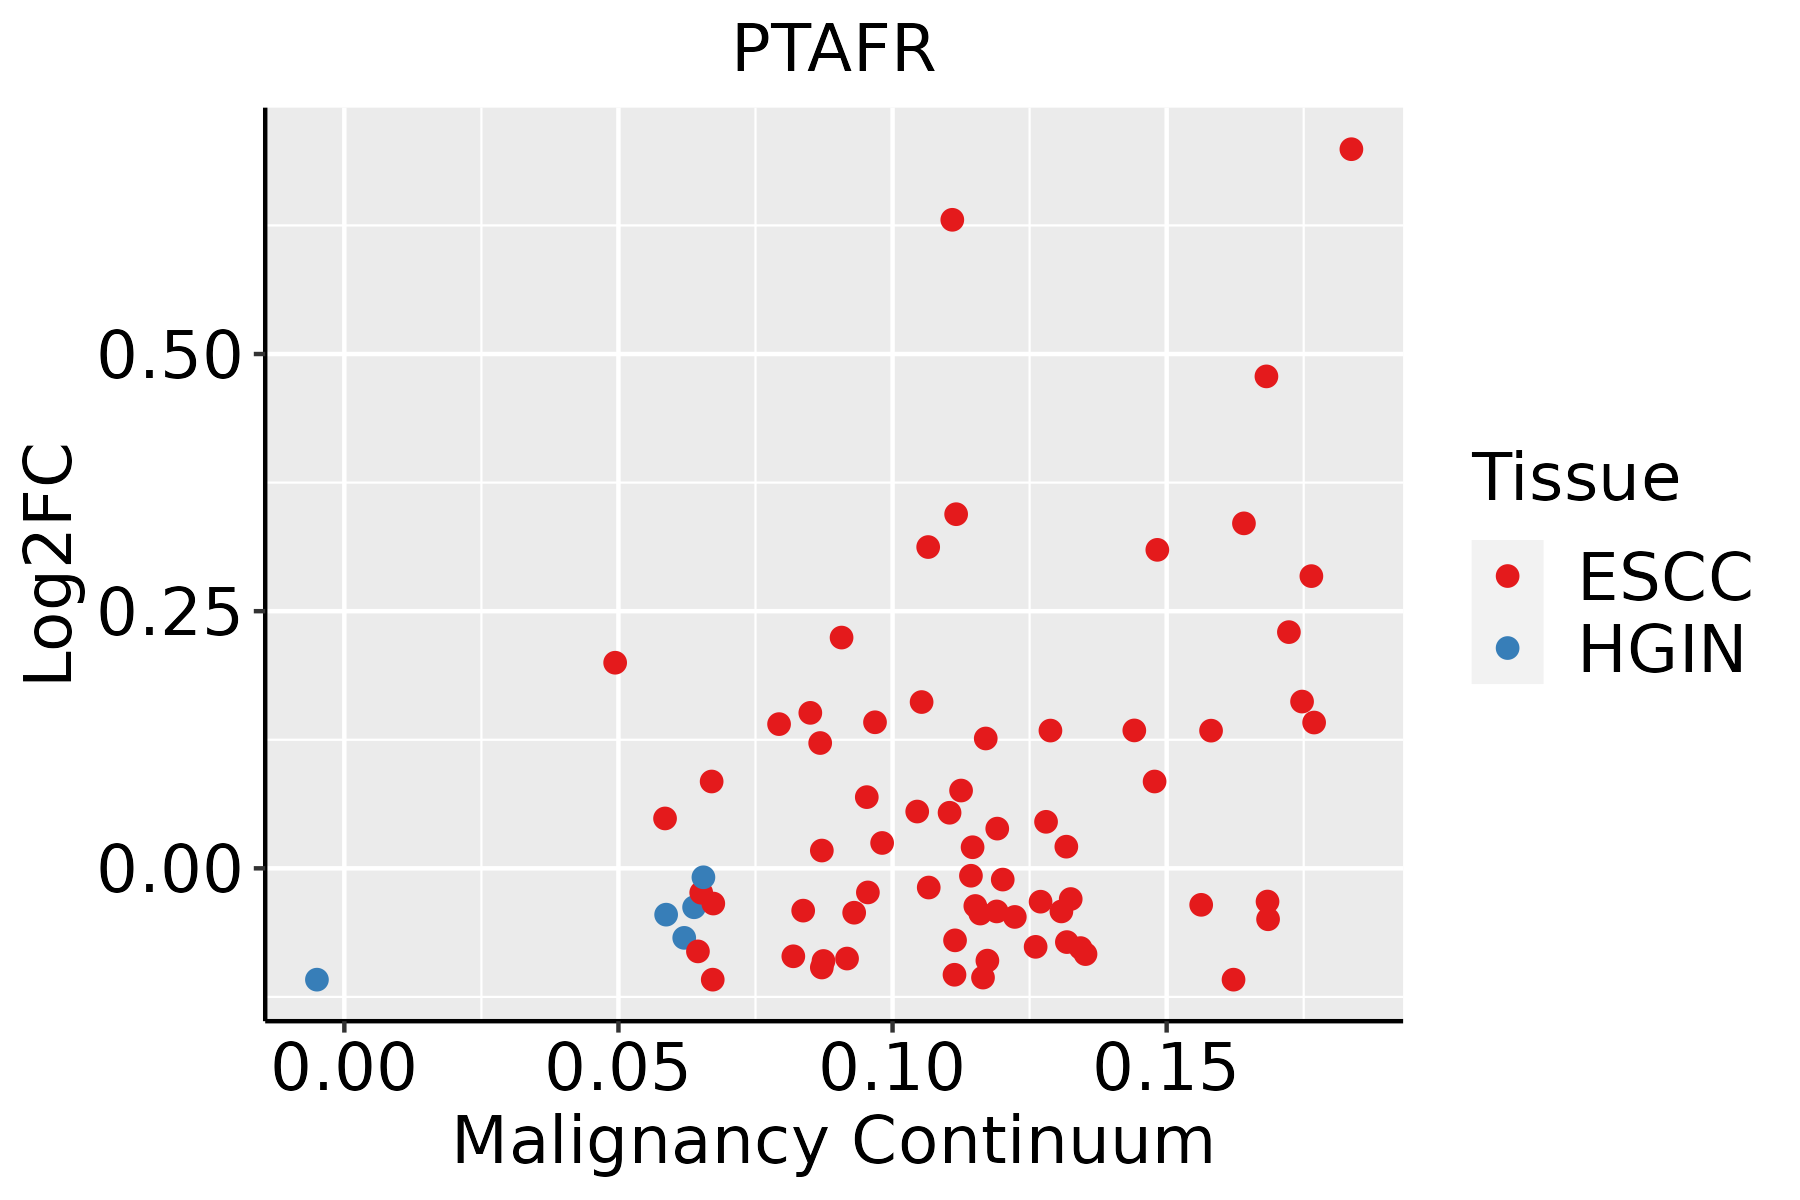 | ESCC: Esophageal squamous cell carcinoma |
| HGIN: High-grade intraepithelial neoplasias | ||
| LGIN: Low-grade intraepithelial neoplasias | ||
| Liver | 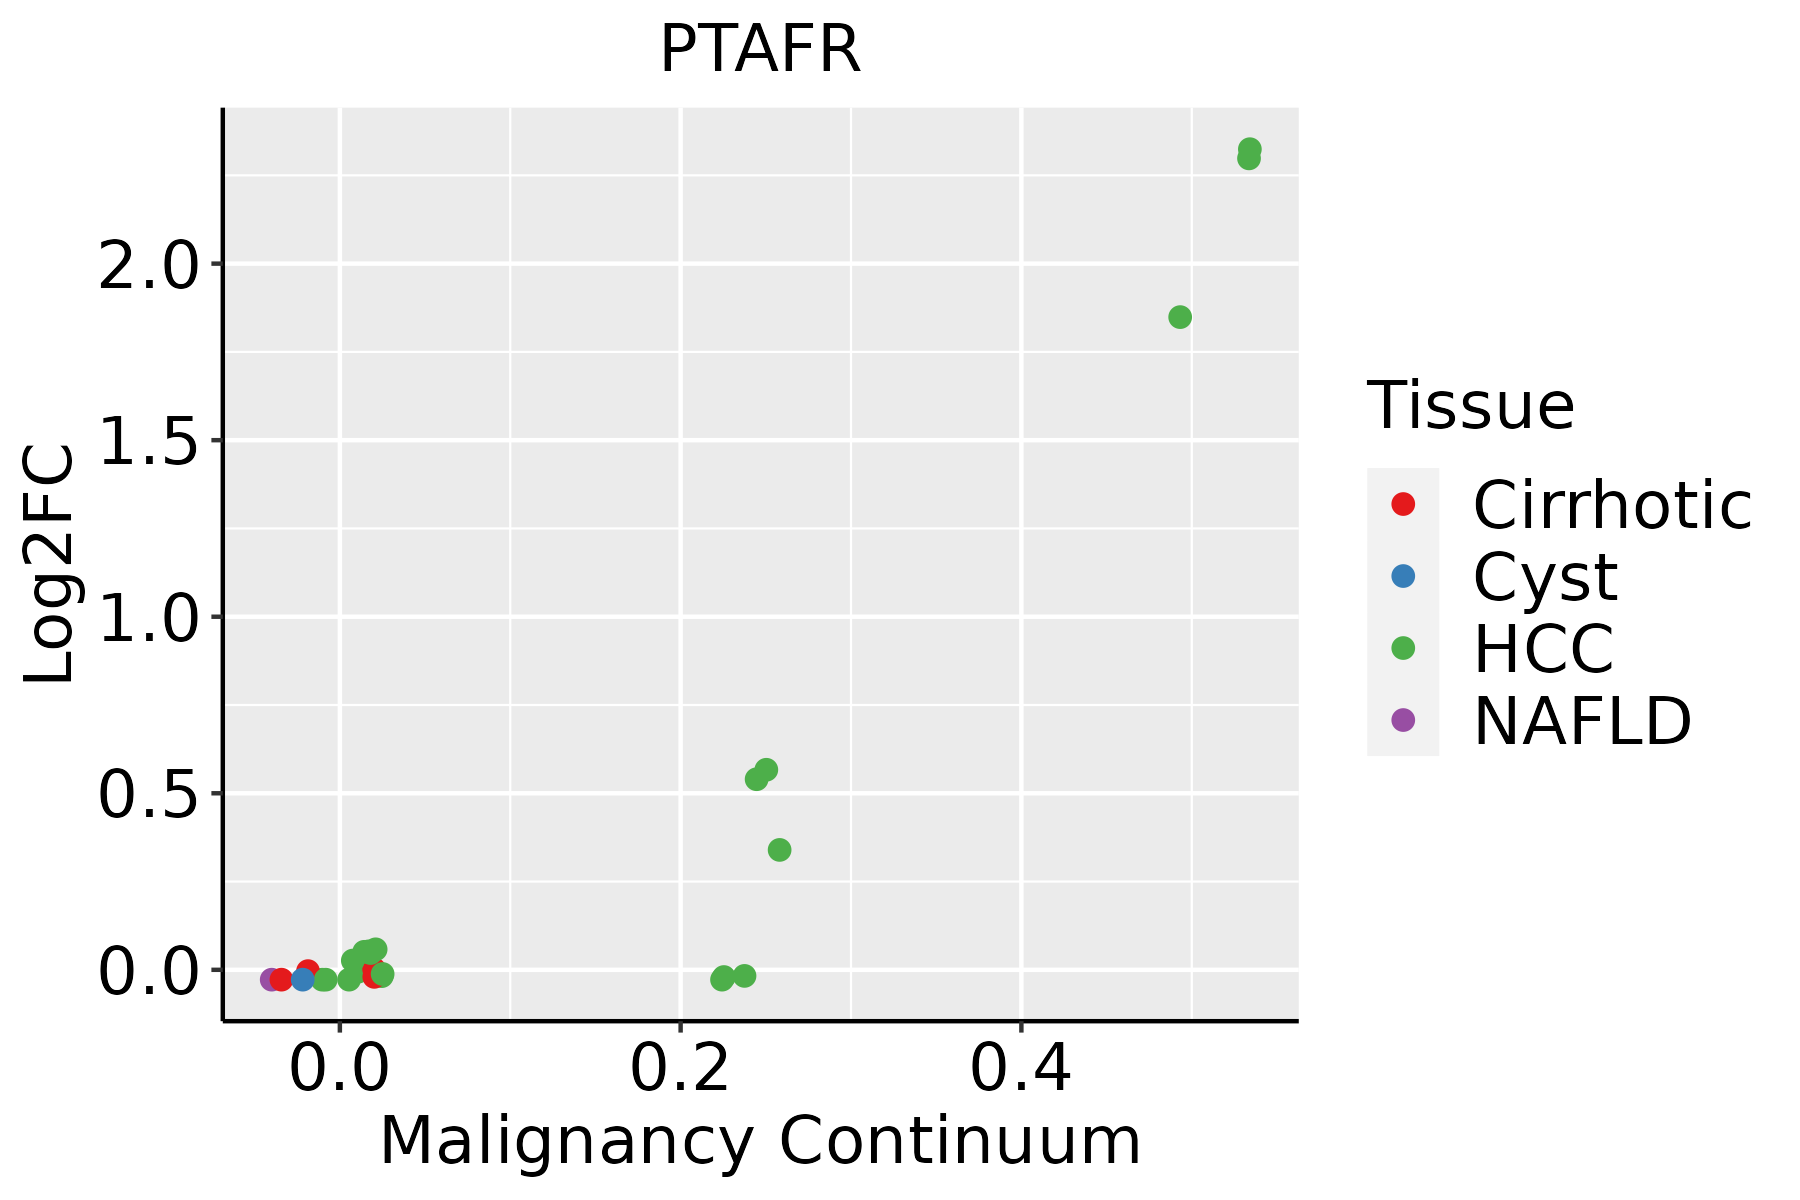 | HCC: Hepatocellular carcinoma |
| NAFLD: Non-alcoholic fatty liver disease | ||
| Oral Cavity |  | EOLP: Erosive Oral lichen planus |
| LP: leukoplakia | ||
| NEOLP: Non-erosive oral lichen planus | ||
| OSCC: Oral squamous cell carcinoma |
| ∗log2FC in expression of this searched gene in stem-like cells from each diseased tissue sample relative to stem-like cells in normal samples in each tissue plotted against the malignancy continuum. Samples are colored based on if they are from different disease stage. |
Top |
Malignant transformation related pathway analysis |
| Find out the enriched GO biological processes and KEGG pathways involved in transition from healthy to precancer to cancer |
| Tissue | Disease Stage | Enriched GO biological Processes |
| Colorectum | AD |  |
| Colorectum | SER |  |
| Colorectum | MSS |  |
| Colorectum | MSI-H |  |
| Colorectum | FAP |  |
| ∗Top 15 enriched GO BP terms are showed in the bar plot of each disease state in each tissue. Each row represents a significant GO biological process which is colored according to the -log10(p.adjust). |
| Page: 1 2 3 4 5 6 7 8 9 |
| GO ID | Tissue | Disease Stage | Description | Gene Ratio | Bg Ratio | pvalue | p.adjust | Count |
| GO:00705427 | Oral cavity | OSCC | response to fatty acid | 36/7305 | 64/18723 | 3.82e-03 | 1.57e-02 | 36 |
| GO:00486614 | Oral cavity | OSCC | positive regulation of smooth muscle cell proliferation | 54/7305 | 104/18723 | 5.00e-03 | 1.96e-02 | 54 |
| GO:00447067 | Oral cavity | OSCC | multi-multicellular organism process | 105/7305 | 220/18723 | 5.05e-03 | 1.97e-02 | 105 |
| GO:00160513 | Oral cavity | OSCC | carbohydrate biosynthetic process | 97/7305 | 202/18723 | 5.50e-03 | 2.13e-02 | 97 |
| GO:00713987 | Oral cavity | OSCC | cellular response to fatty acid | 23/7305 | 38/18723 | 5.87e-03 | 2.24e-02 | 23 |
| GO:00486596 | Oral cavity | OSCC | smooth muscle cell proliferation | 89/7305 | 184/18723 | 5.95e-03 | 2.27e-02 | 89 |
| GO:0042119 | Oral cavity | OSCC | neutrophil activation | 22/7305 | 36/18723 | 5.96e-03 | 2.27e-02 | 22 |
| GO:0002888 | Oral cavity | OSCC | positive regulation of myeloid leukocyte mediated immunity | 13/7305 | 19/18723 | 9.07e-03 | 3.26e-02 | 13 |
| GO:00715486 | Oral cavity | OSCC | response to dexamethasone | 23/7305 | 39/18723 | 9.09e-03 | 3.26e-02 | 23 |
| GO:00442625 | Oral cavity | OSCC | cellular carbohydrate metabolic process | 130/7305 | 283/18723 | 9.98e-03 | 3.49e-02 | 130 |
| GO:00486606 | Oral cavity | OSCC | regulation of smooth muscle cell proliferation | 86/7305 | 180/18723 | 1.00e-02 | 3.49e-02 | 86 |
| GO:00330024 | Oral cavity | OSCC | muscle cell proliferation | 115/7305 | 248/18723 | 1.05e-02 | 3.58e-02 | 115 |
| GO:00024441 | Oral cavity | OSCC | myeloid leukocyte mediated immunity | 50/7305 | 99/18723 | 1.31e-02 | 4.34e-02 | 50 |
| Page: 1 2 3 4 5 6 |
| Pathway ID | Tissue | Disease Stage | Description | Gene Ratio | Bg Ratio | pvalue | p.adjust | qvalue | Count |
| Page: 1 |
Top |
Cell-cell communication analysis |
| Identification of potential cell-cell interactions between two cell types and their ligand-receptor pairs for different disease states |
| Ligand | Receptor | LRpair | Pathway | Tissue | Disease Stage |
| Page: 1 |
Top |
Single-cell gene regulatory network inference analysis |
| Find out the significant the regulons (TFs) and the target genes of each regulon across cell types for different disease states |
| TF | Cell Type | Tissue | Disease Stage | Target Gene | RSS | Regulon Activity |
| ∗The dot plots of a searched regulon are shown for all cell subpopulations in each disease state of each tissue based on the regulon specific score inferred using pySCENIC and by calculating the average expression. |
| Page: 1 |
Top |
Somatic mutation of malignant transformation related genes |
| Annotation of somatic variants for genes involved in malignant transformation |
| Hugo Symbol | Variant Class | Variant Classification | dbSNP RS | HGVSc | HGVSp | HGVSp Short | SWISSPROT | BIOTYPE | SIFT | PolyPhen | Tumor Sample Barcode | Tissue | Histology | Sex | Age | Stage | Therapy Types | Drugs | Outcome |
| PTAFR | SNV | Missense_Mutation | novel | c.183G>C | p.Met61Ile | p.M61I | P25105 | protein_coding | tolerated(0.69) | benign(0.005) | TCGA-AR-A2LR-01 | Breast | breast invasive carcinoma | Female | <65 | I/II | Chemotherapy | adriamycin | SD |
| PTAFR | SNV | Missense_Mutation | rs773660486 | c.794N>A | p.Ser265Asn | p.S265N | P25105 | protein_coding | tolerated(0.51) | benign(0.003) | TCGA-D8-A73X-01 | Breast | breast invasive carcinoma | Female | <65 | I/II | Hormone Therapy | tamoxiphen | SD |
| PTAFR | insertion | Frame_Shift_Ins | novel | c.367_368insGGTCCGGAGT | p.Ile123ArgfsTer56 | p.I123Rfs*56 | P25105 | protein_coding | TCGA-AN-A0AS-01 | Breast | breast invasive carcinoma | Female | >=65 | III/IV | Unknown | Unknown | SD | ||
| PTAFR | SNV | Missense_Mutation | rs542211181 | c.391C>T | p.Arg131Cys | p.R131C | P25105 | protein_coding | deleterious(0) | probably_damaging(0.983) | TCGA-VS-A9V4-01 | Cervix | cervical & endocervical cancer | Female | <65 | I/II | Chemotherapy | cisplatin | PD |
| PTAFR | SNV | Missense_Mutation | c.958N>A | p.Ala320Thr | p.A320T | P25105 | protein_coding | tolerated(0.72) | benign(0) | TCGA-AA-A010-01 | Colorectum | colon adenocarcinoma | Female | <65 | I/II | Chemotherapy | folinic | CR | |
| PTAFR | SNV | Missense_Mutation | c.114N>T | p.Trp38Cys | p.W38C | P25105 | protein_coding | deleterious(0) | probably_damaging(0.969) | TCGA-AZ-4313-01 | Colorectum | colon adenocarcinoma | Female | <65 | I/II | Unknown | Unknown | SD | |
| PTAFR | SNV | Missense_Mutation | rs769811699 | c.164N>G | p.Phe55Cys | p.F55C | P25105 | protein_coding | deleterious(0) | probably_damaging(0.995) | TCGA-A5-A0G2-01 | Endometrium | uterine corpus endometrioid carcinoma | Female | <65 | III/IV | Unknown | Unknown | SD |
| PTAFR | SNV | Missense_Mutation | novel | c.56N>T | p.Pro19Leu | p.P19L | P25105 | protein_coding | deleterious(0) | probably_damaging(0.95) | TCGA-A5-A0G2-01 | Endometrium | uterine corpus endometrioid carcinoma | Female | <65 | III/IV | Unknown | Unknown | SD |
| PTAFR | SNV | Missense_Mutation | rs762152737 | c.934C>T | p.Arg312Cys | p.R312C | P25105 | protein_coding | deleterious(0.01) | possibly_damaging(0.642) | TCGA-AX-A1CE-01 | Endometrium | uterine corpus endometrioid carcinoma | Female | <65 | I/II | Unspecific | Paclitaxel | SD |
| PTAFR | SNV | Missense_Mutation | novel | c.632N>A | p.Arg211His | p.R211H | P25105 | protein_coding | tolerated(0.11) | benign(0.141) | TCGA-B5-A3FA-01 | Endometrium | uterine corpus endometrioid carcinoma | Female | >=65 | I/II | Unknown | Unknown | SD |
| Page: 1 2 3 4 |
Top |
Related drugs of malignant transformation related genes |
| Identification of chemicals and drugs interact with genes involved in malignant transfromation |
| (DGIdb 4.0) |
| Entrez ID | Symbol | Category | Interaction Types | Drug Claim Name | Drug Name | PMIDs |
| 5724 | PTAFR | G PROTEIN COUPLED RECEPTOR, KINASE, DRUGGABLE GENOME | antagonist | 178102699 | BEPAFANT | |
| 5724 | PTAFR | G PROTEIN COUPLED RECEPTOR, KINASE, DRUGGABLE GENOME | antagonist | 178100430 | ||
| 5724 | PTAFR | G PROTEIN COUPLED RECEPTOR, KINASE, DRUGGABLE GENOME | RUPATADINE | RUPATADINE | ||
| 5724 | PTAFR | G PROTEIN COUPLED RECEPTOR, KINASE, DRUGGABLE GENOME | antagonist | 135649880 | ||
| 5724 | PTAFR | G PROTEIN COUPLED RECEPTOR, KINASE, DRUGGABLE GENOME | antagonist | 135650010 | ||
| 5724 | PTAFR | G PROTEIN COUPLED RECEPTOR, KINASE, DRUGGABLE GENOME | CMI-392 | |||
| 5724 | PTAFR | G PROTEIN COUPLED RECEPTOR, KINASE, DRUGGABLE GENOME | YM-264 | |||
| 5724 | PTAFR | G PROTEIN COUPLED RECEPTOR, KINASE, DRUGGABLE GENOME | ISRAPAFANT | ISRAPAFANT | ||
| 5724 | PTAFR | G PROTEIN COUPLED RECEPTOR, KINASE, DRUGGABLE GENOME | agonist | 135651398 | ||
| 5724 | PTAFR | G PROTEIN COUPLED RECEPTOR, KINASE, DRUGGABLE GENOME | agonist | 135651567 |
| Page: 1 2 3 4 |

Copyright 2023-Present -The University of Texas Health Science Center at Houston |