
|
|||||
|
 | |
| |
| |
| |
| |
| |
|
Gene: PIN4 |
Gene summary for PIN4 |
| Gene information | Species | Human | Gene symbol | PIN4 | Gene ID | 5303 |
| Gene name | peptidylprolyl cis/trans isomerase, NIMA-interacting 4 | |
| Gene Alias | EPVH | |
| Cytomap | Xq13.1 | |
| Gene Type | protein-coding | GO ID | GO:0000413 | UniProtAcc | Q9Y237 |
Top |
Malignant transformation analysis |
| Identification of the aberrant gene expression in precancerous and cancerous lesions by comparing the gene expression of stem-like cells in diseased tissues with normal stem cells |
| Entrez ID | Symbol | Replicates | Species | Organ | Tissue | Adj P-value | Log2FC | Malignancy |
| 5303 | PIN4 | GSM4909281 | Human | Breast | IDC | 1.25e-17 | 5.12e-01 | 0.21 |
| 5303 | PIN4 | GSM4909282 | Human | Breast | IDC | 6.07e-04 | 3.52e-01 | -0.0288 |
| 5303 | PIN4 | GSM4909290 | Human | Breast | IDC | 1.52e-10 | 4.26e-01 | 0.2096 |
| 5303 | PIN4 | GSM4909294 | Human | Breast | IDC | 9.48e-06 | 3.13e-01 | 0.2022 |
| 5303 | PIN4 | GSM4909296 | Human | Breast | IDC | 7.37e-06 | 2.50e-01 | 0.1524 |
| 5303 | PIN4 | GSM4909297 | Human | Breast | IDC | 1.39e-08 | 3.96e-02 | 0.1517 |
| 5303 | PIN4 | GSM4909301 | Human | Breast | IDC | 5.26e-13 | 4.89e-01 | 0.1577 |
| 5303 | PIN4 | GSM4909304 | Human | Breast | IDC | 4.81e-05 | 2.77e-01 | 0.1636 |
| 5303 | PIN4 | GSM4909306 | Human | Breast | IDC | 7.51e-07 | 3.37e-01 | 0.1564 |
| 5303 | PIN4 | GSM4909311 | Human | Breast | IDC | 2.05e-17 | -5.06e-03 | 0.1534 |
| 5303 | PIN4 | GSM4909312 | Human | Breast | IDC | 9.03e-05 | -2.36e-02 | 0.1552 |
| 5303 | PIN4 | GSM4909317 | Human | Breast | IDC | 5.47e-08 | 3.43e-01 | 0.1355 |
| 5303 | PIN4 | GSM4909318 | Human | Breast | IDC | 1.50e-05 | 5.15e-01 | 0.2031 |
| 5303 | PIN4 | GSM4909319 | Human | Breast | IDC | 4.69e-19 | -1.55e-01 | 0.1563 |
| 5303 | PIN4 | GSM4909320 | Human | Breast | IDC | 3.73e-04 | 1.54e-01 | 0.1575 |
| 5303 | PIN4 | GSM4909321 | Human | Breast | IDC | 4.47e-08 | -4.02e-02 | 0.1559 |
| 5303 | PIN4 | brca2 | Human | Breast | Precancer | 5.19e-17 | 4.17e-01 | -0.024 |
| 5303 | PIN4 | brca3 | Human | Breast | Precancer | 9.52e-10 | 3.00e-01 | -0.0263 |
| 5303 | PIN4 | NCCBC5 | Human | Breast | DCIS | 1.61e-04 | 5.31e-02 | 0.2046 |
| 5303 | PIN4 | P1 | Human | Breast | IDC | 4.33e-10 | -1.72e-01 | 0.1527 |
| Page: 1 2 3 4 5 6 7 8 9 |
| Tissue | Expression Dynamics | Abbreviation |
| Breast | 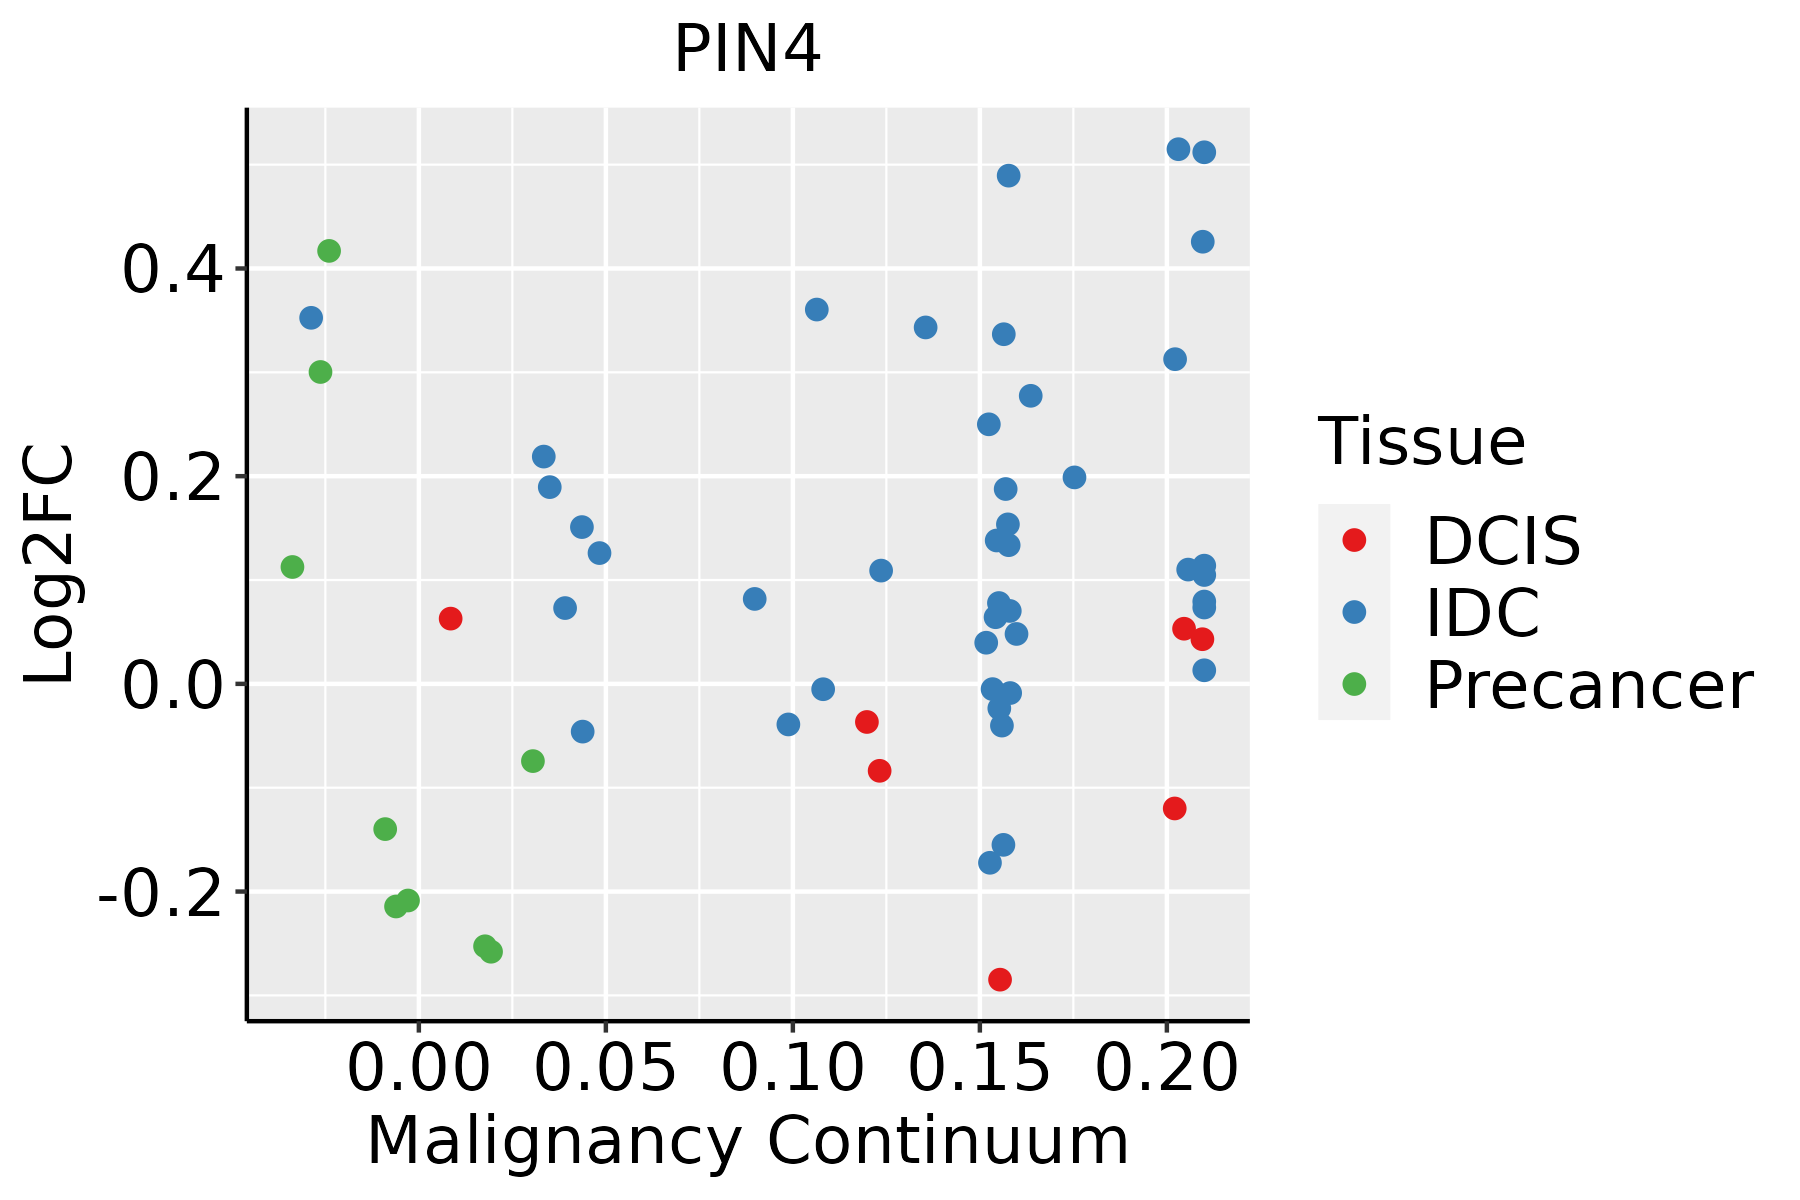 | IDC: Invasive ductal carcinoma |
| DCIS: Ductal carcinoma in situ | ||
| Precancer(BRCA1-mut): Precancerous lesion from BRCA1 mutation carriers | ||
| Endometrium | 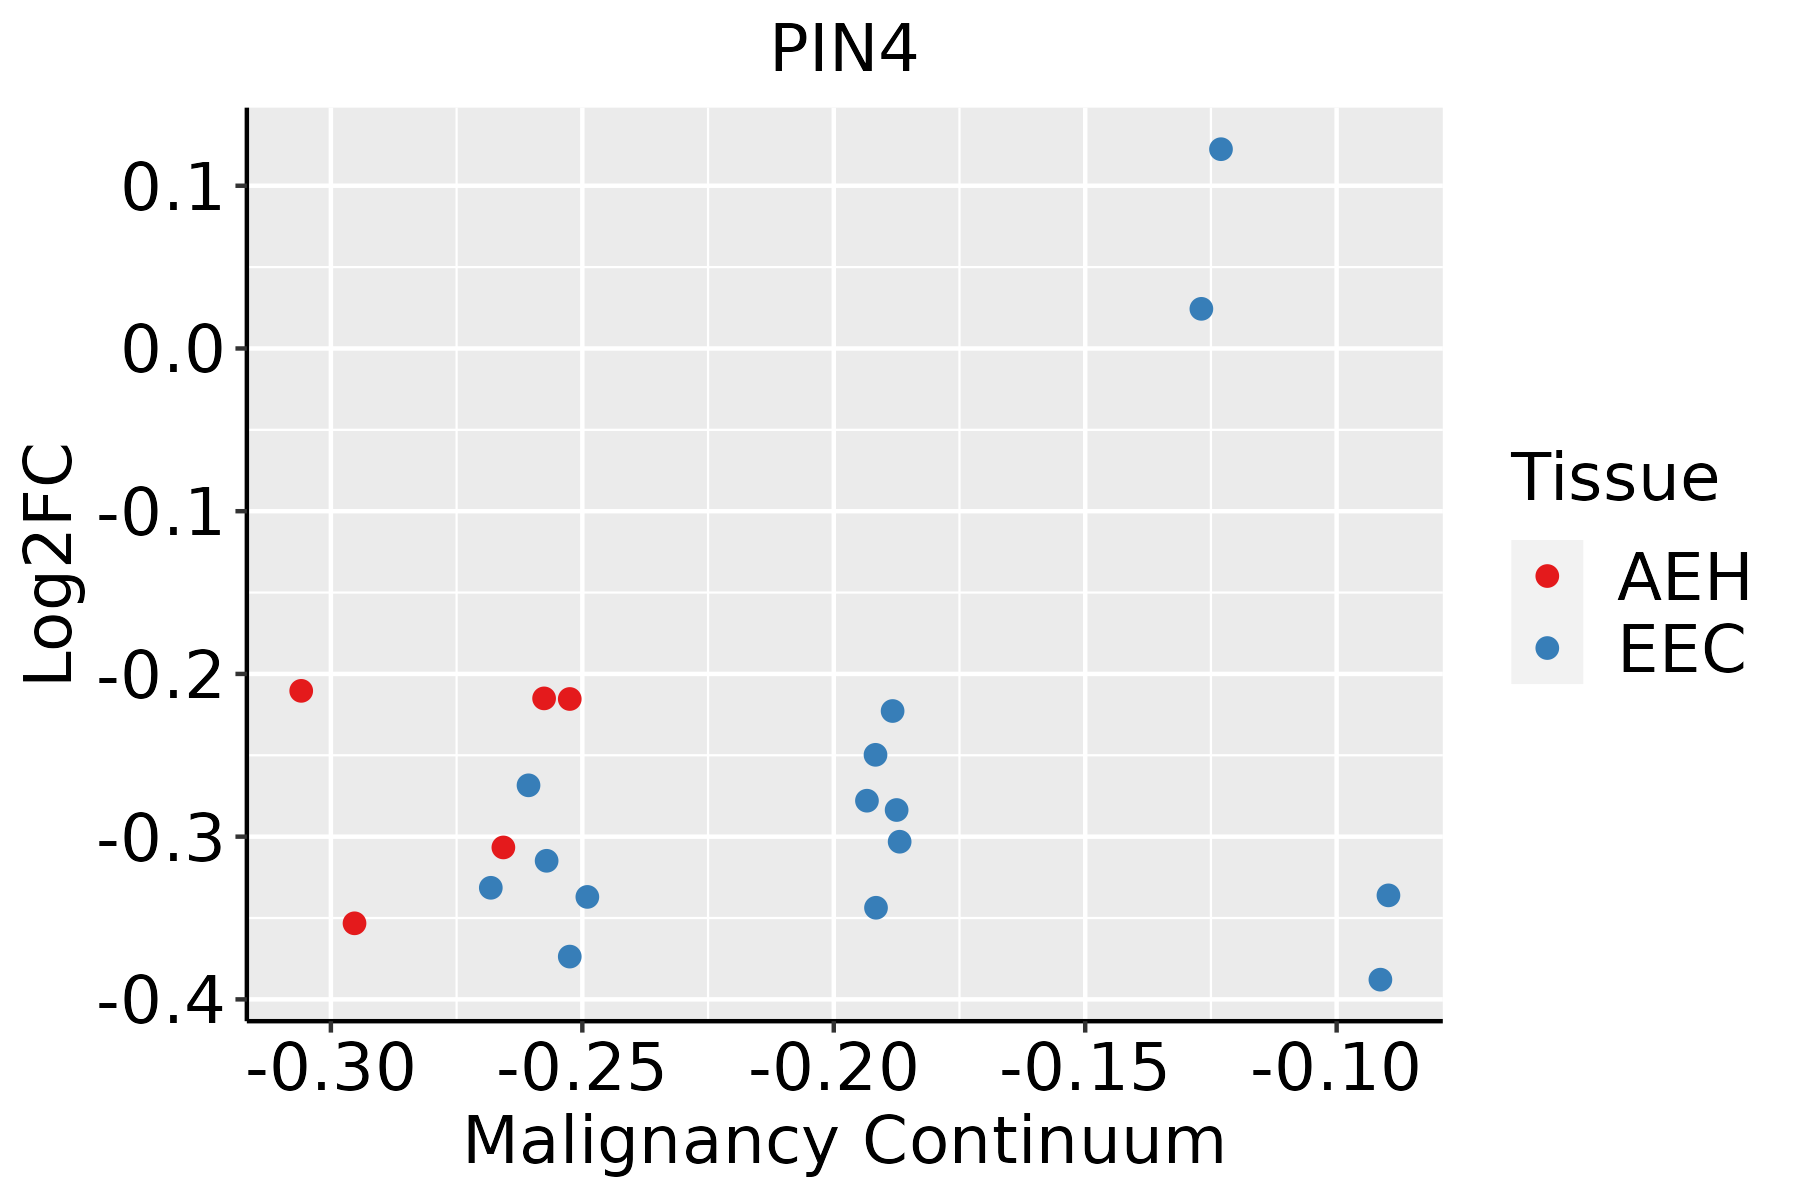 | AEH: Atypical endometrial hyperplasia |
| EEC: Endometrioid Cancer | ||
| Esophagus | 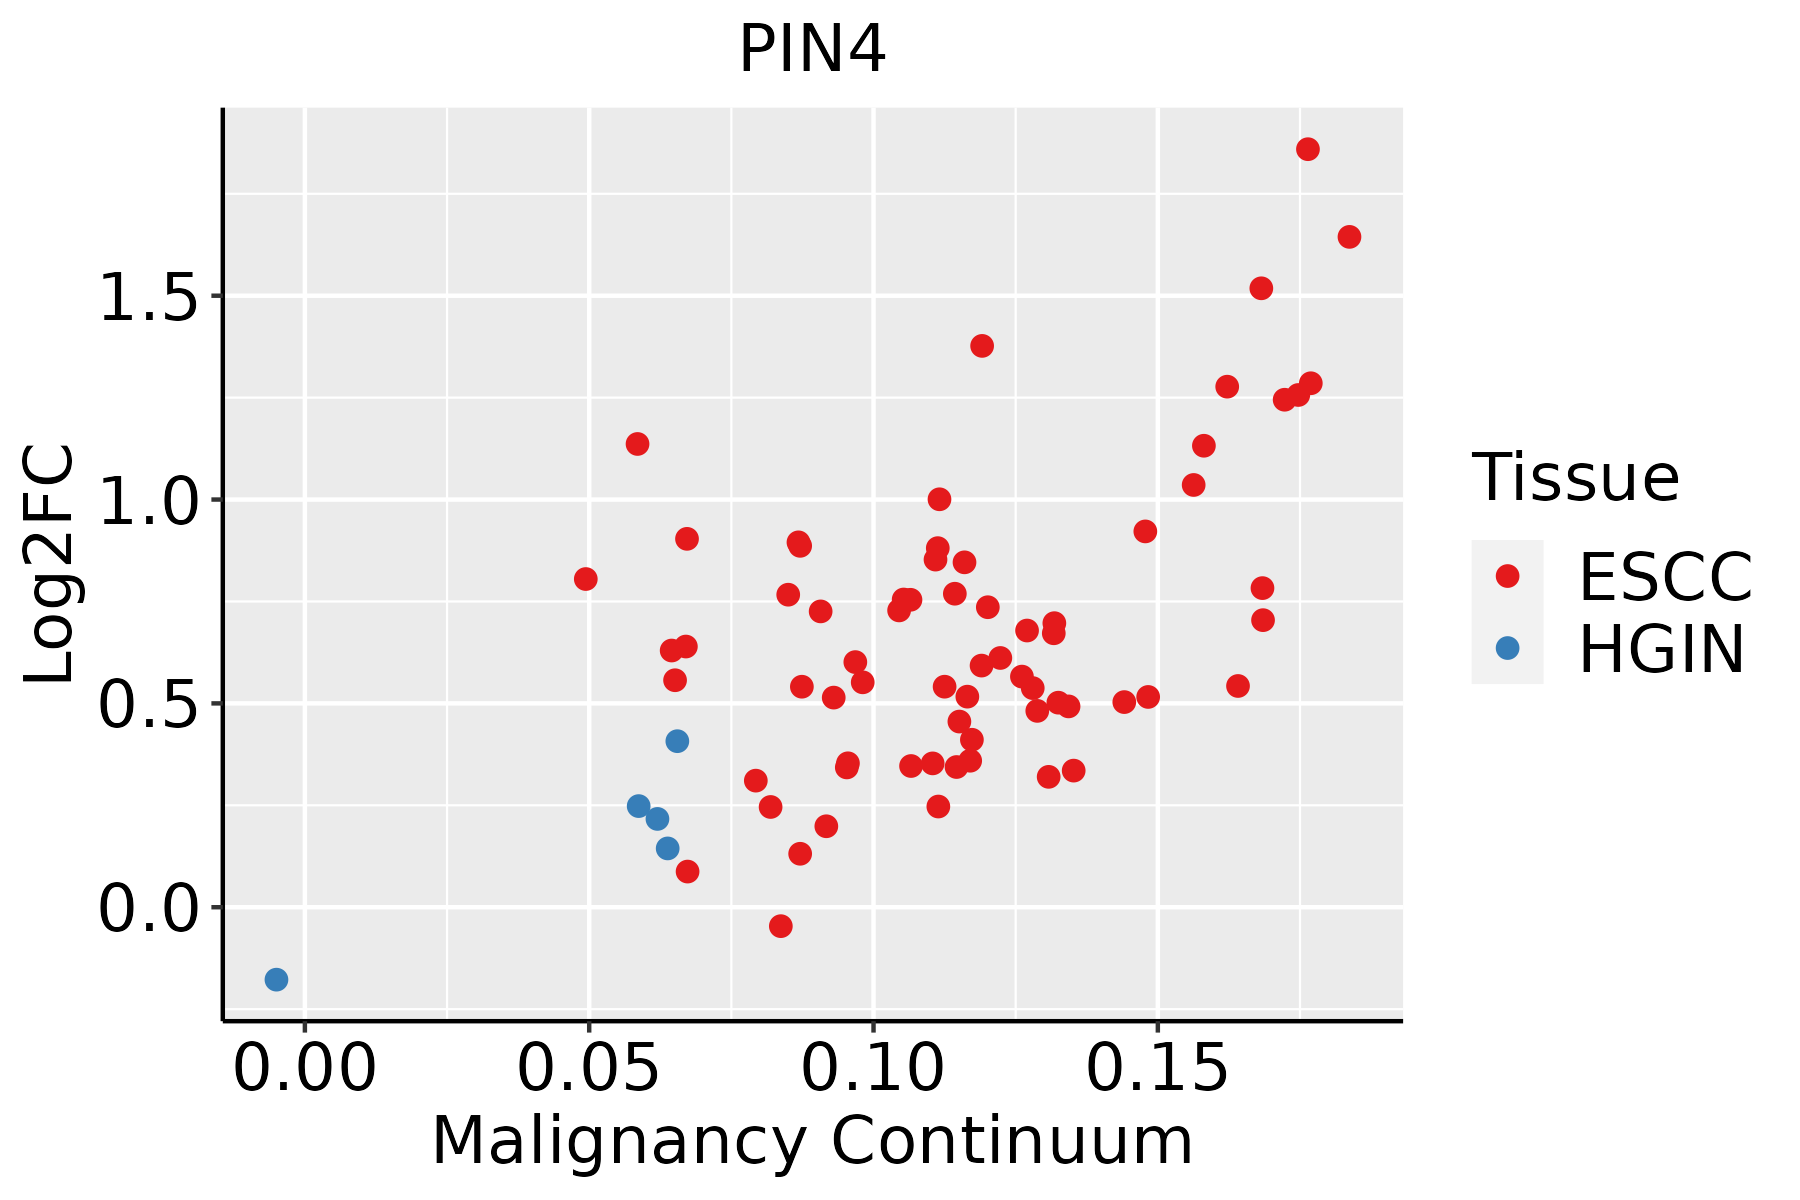 | ESCC: Esophageal squamous cell carcinoma |
| HGIN: High-grade intraepithelial neoplasias | ||
| LGIN: Low-grade intraepithelial neoplasias | ||
| Liver | 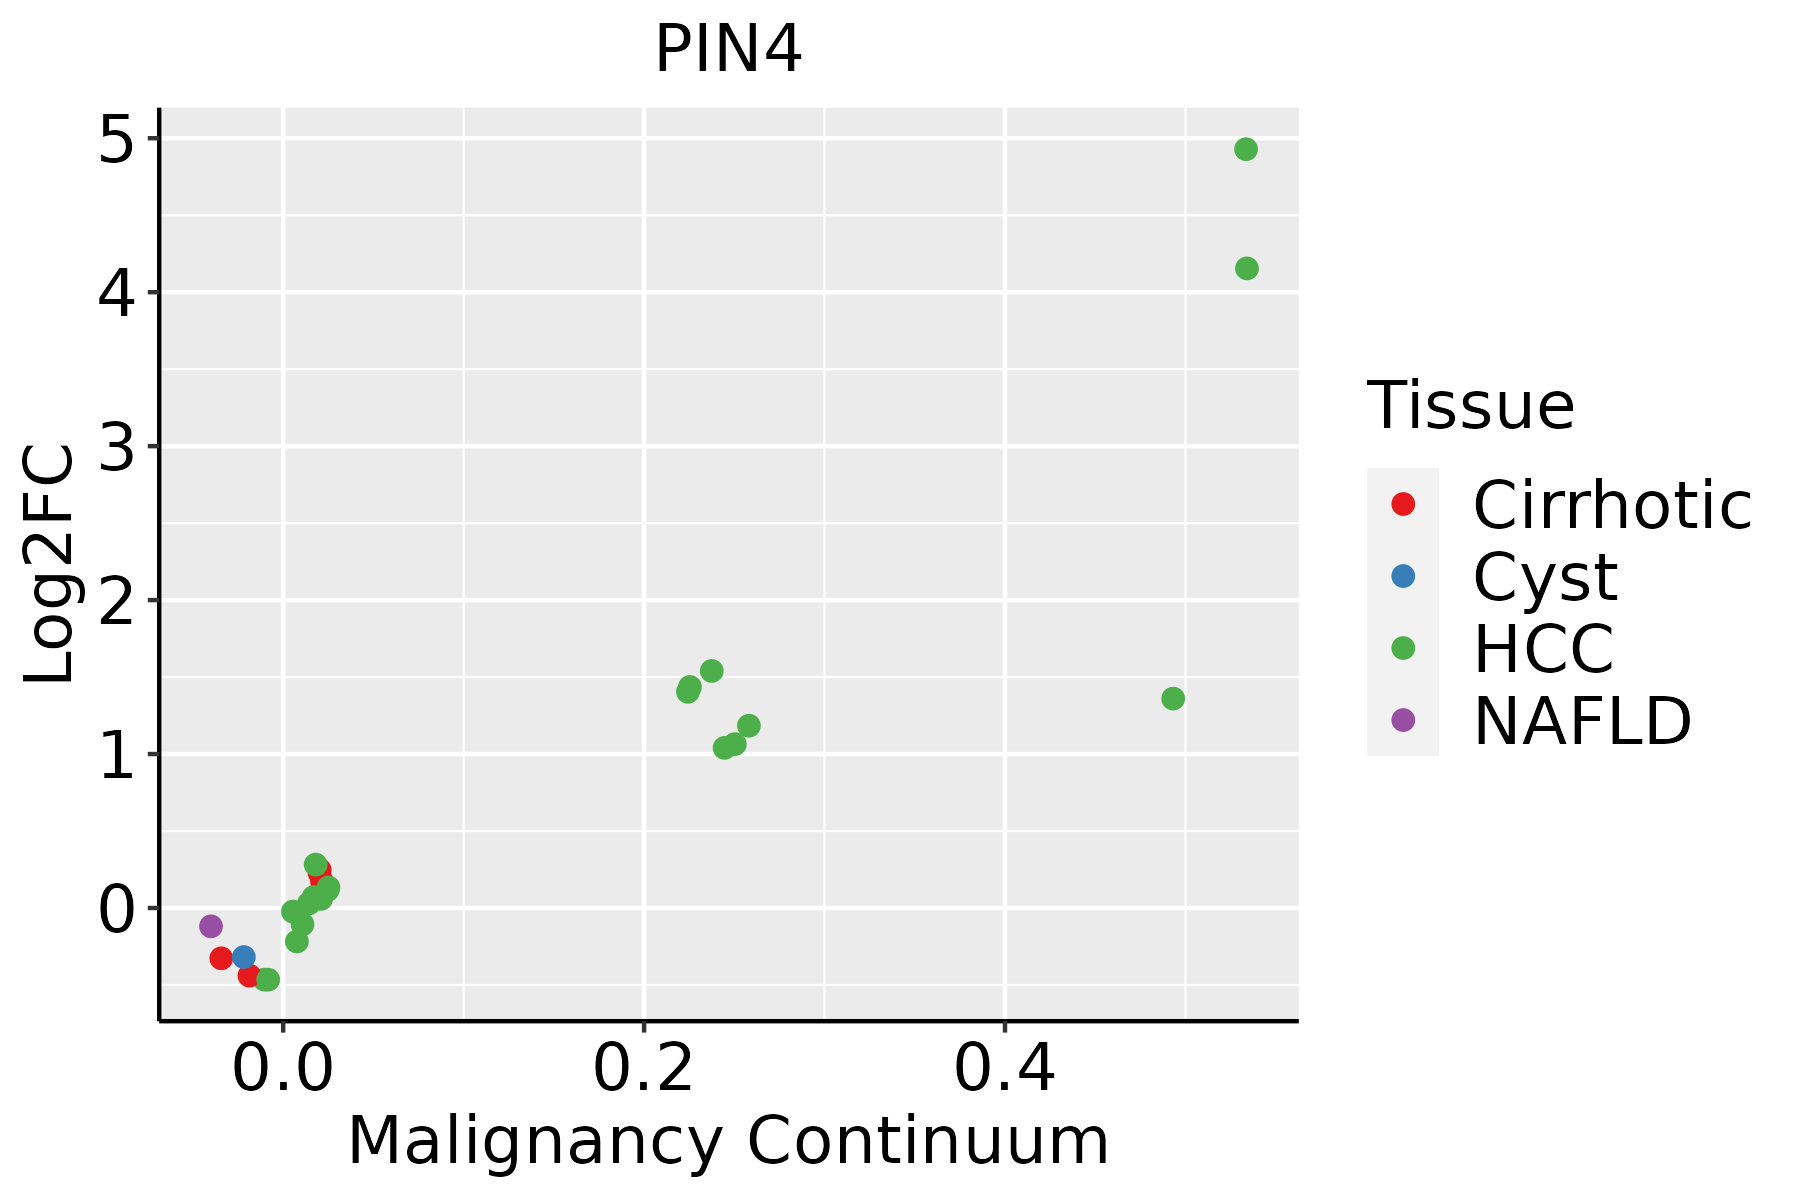 | HCC: Hepatocellular carcinoma |
| NAFLD: Non-alcoholic fatty liver disease | ||
| Oral Cavity | 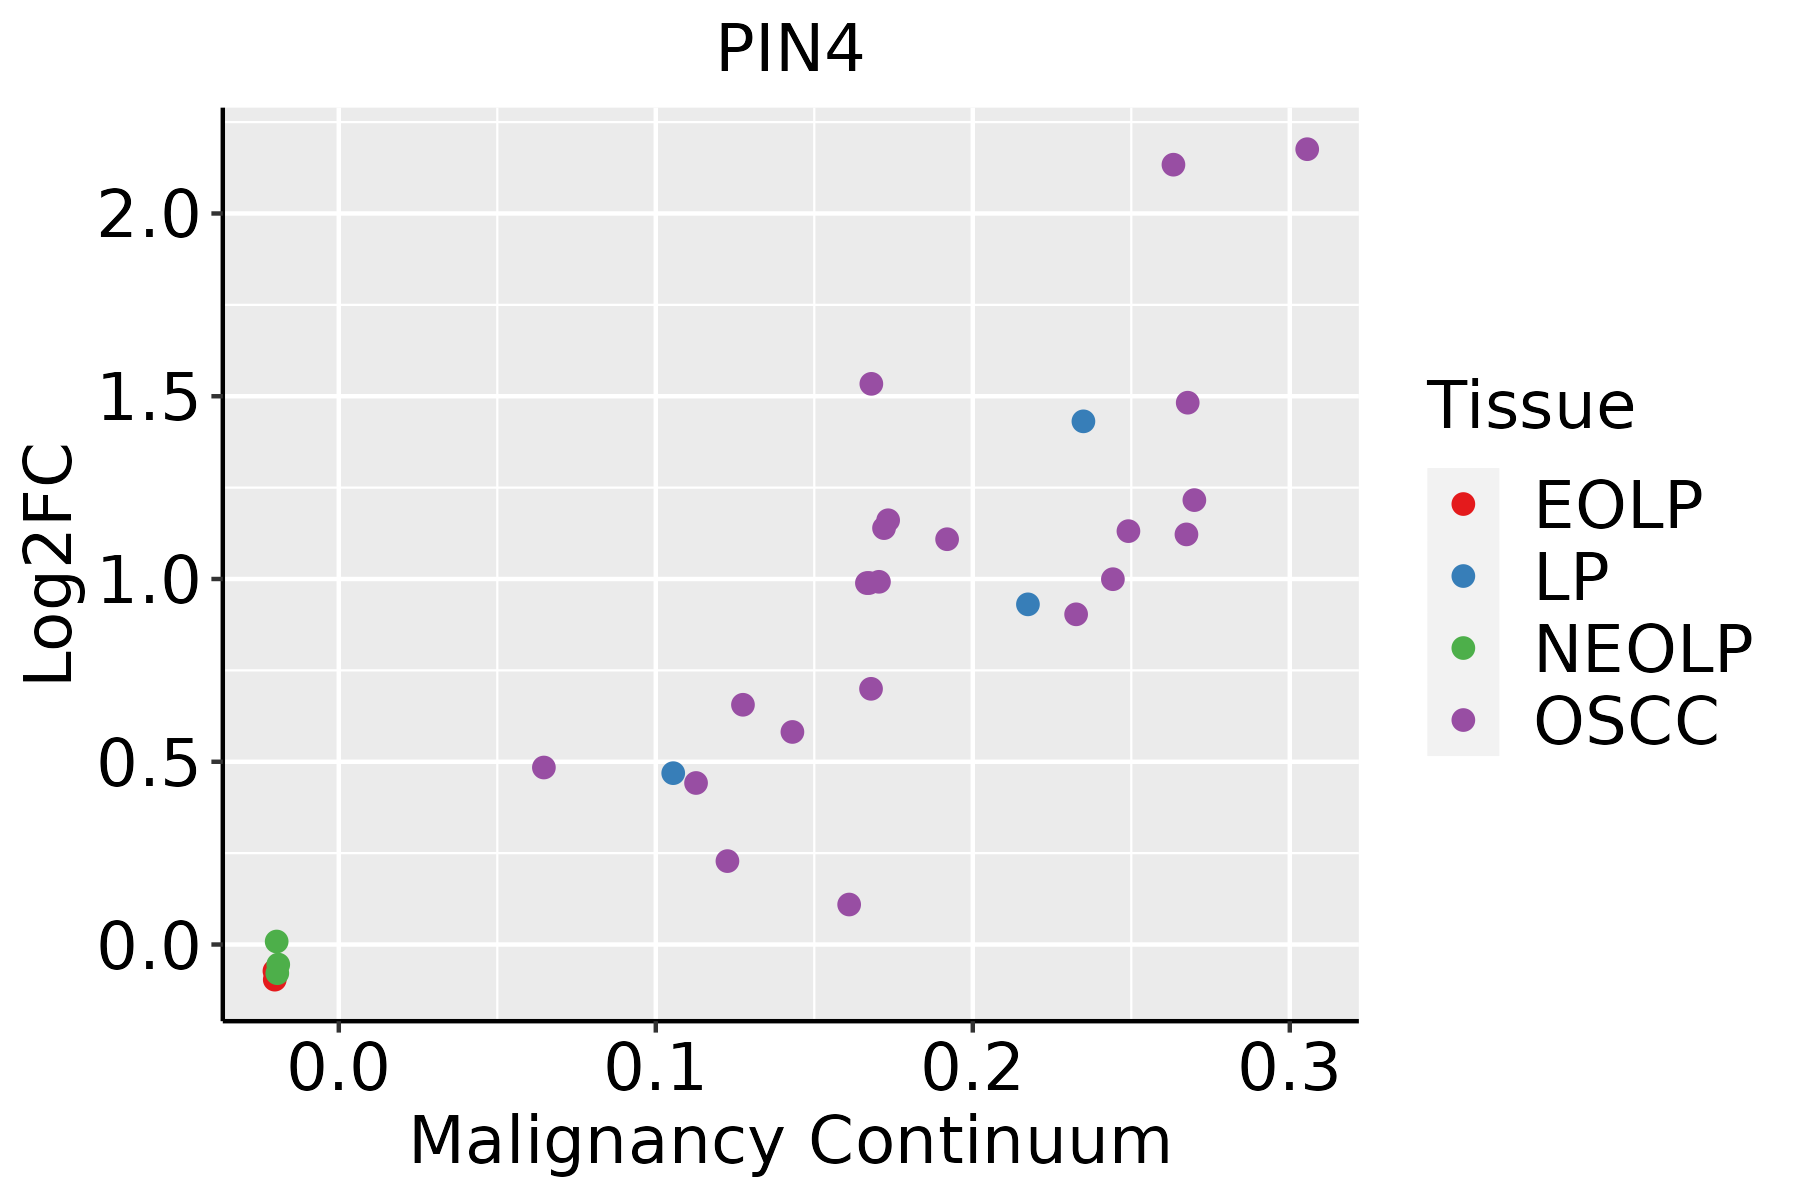 | EOLP: Erosive Oral lichen planus |
| LP: leukoplakia | ||
| NEOLP: Non-erosive oral lichen planus | ||
| OSCC: Oral squamous cell carcinoma | ||
| Prostate | 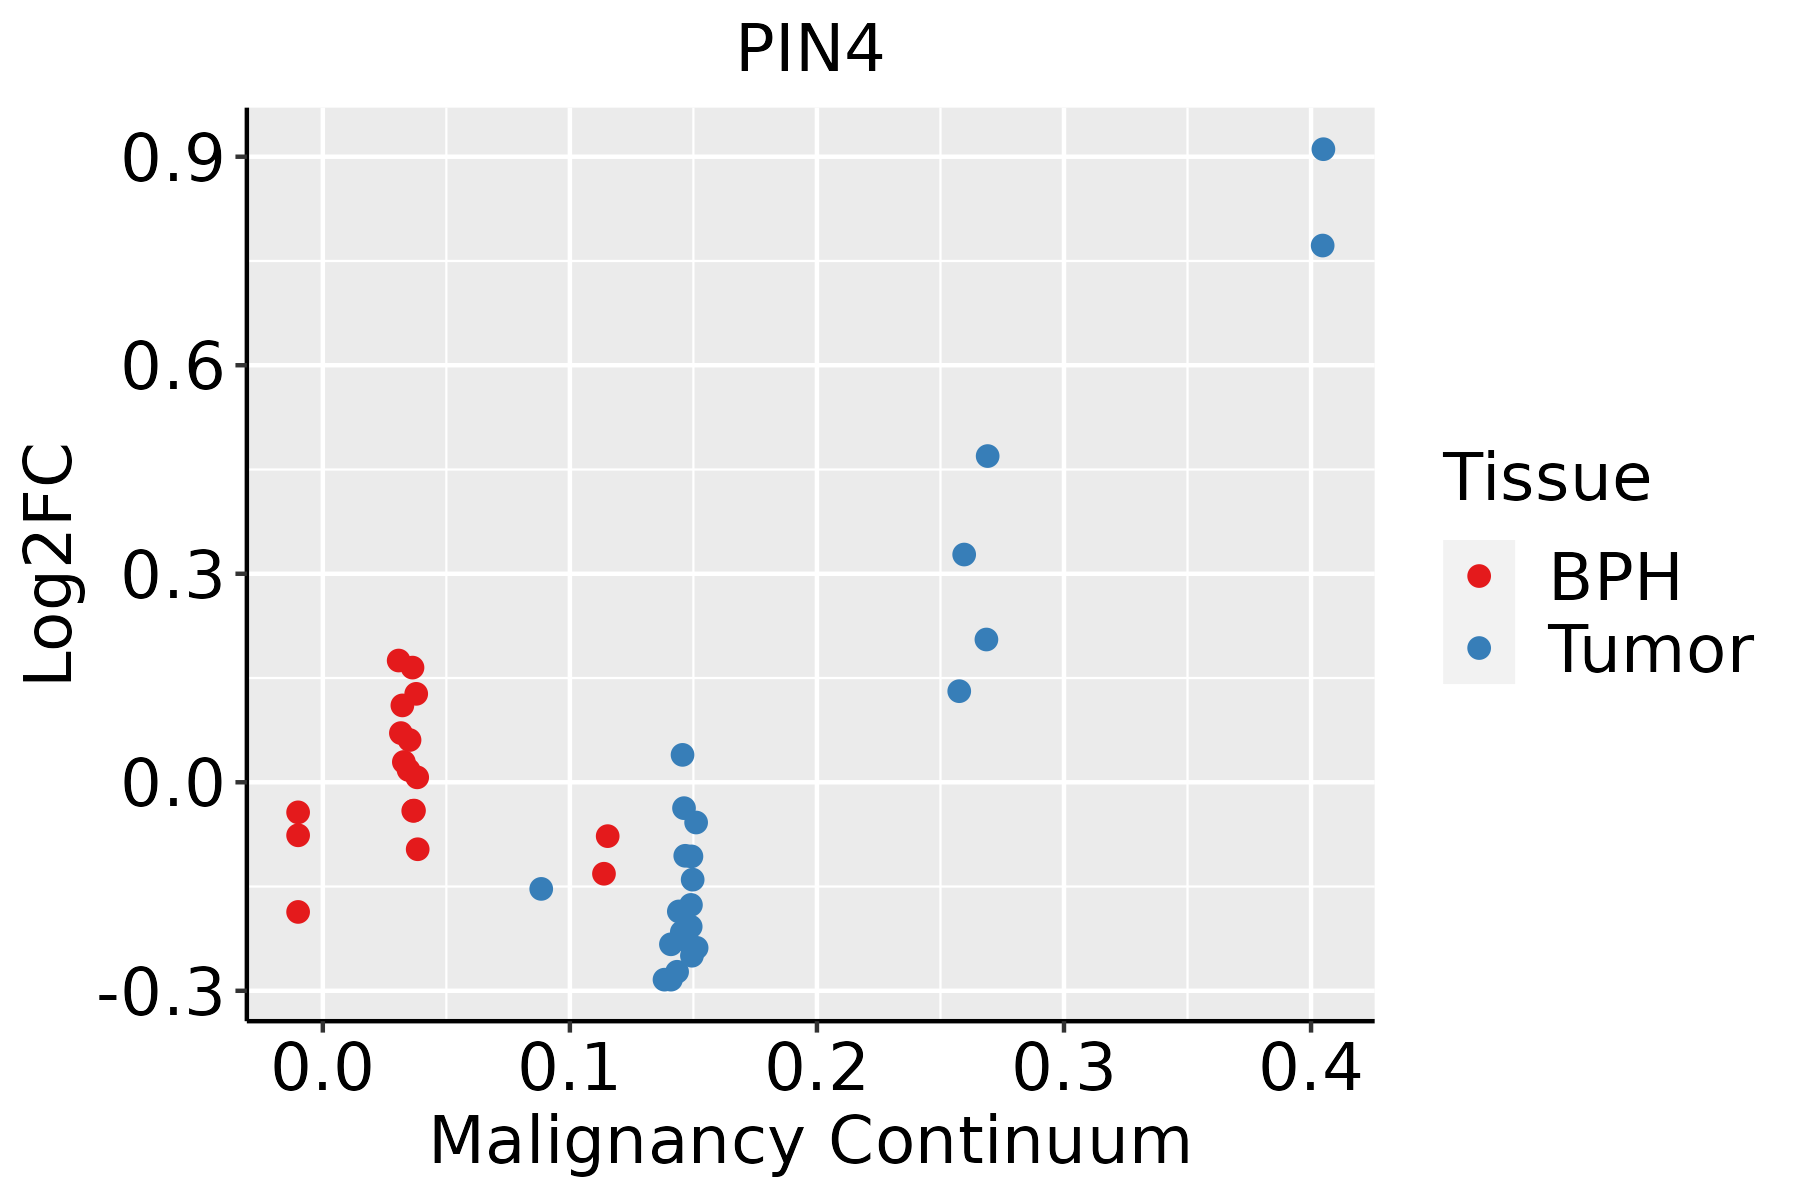 | BPH: Benign Prostatic Hyperplasia |
| Skin |  | AK: Actinic keratosis |
| cSCC: Cutaneous squamous cell carcinoma | ||
| SCCIS:squamous cell carcinoma in situ | ||
| Thyroid | 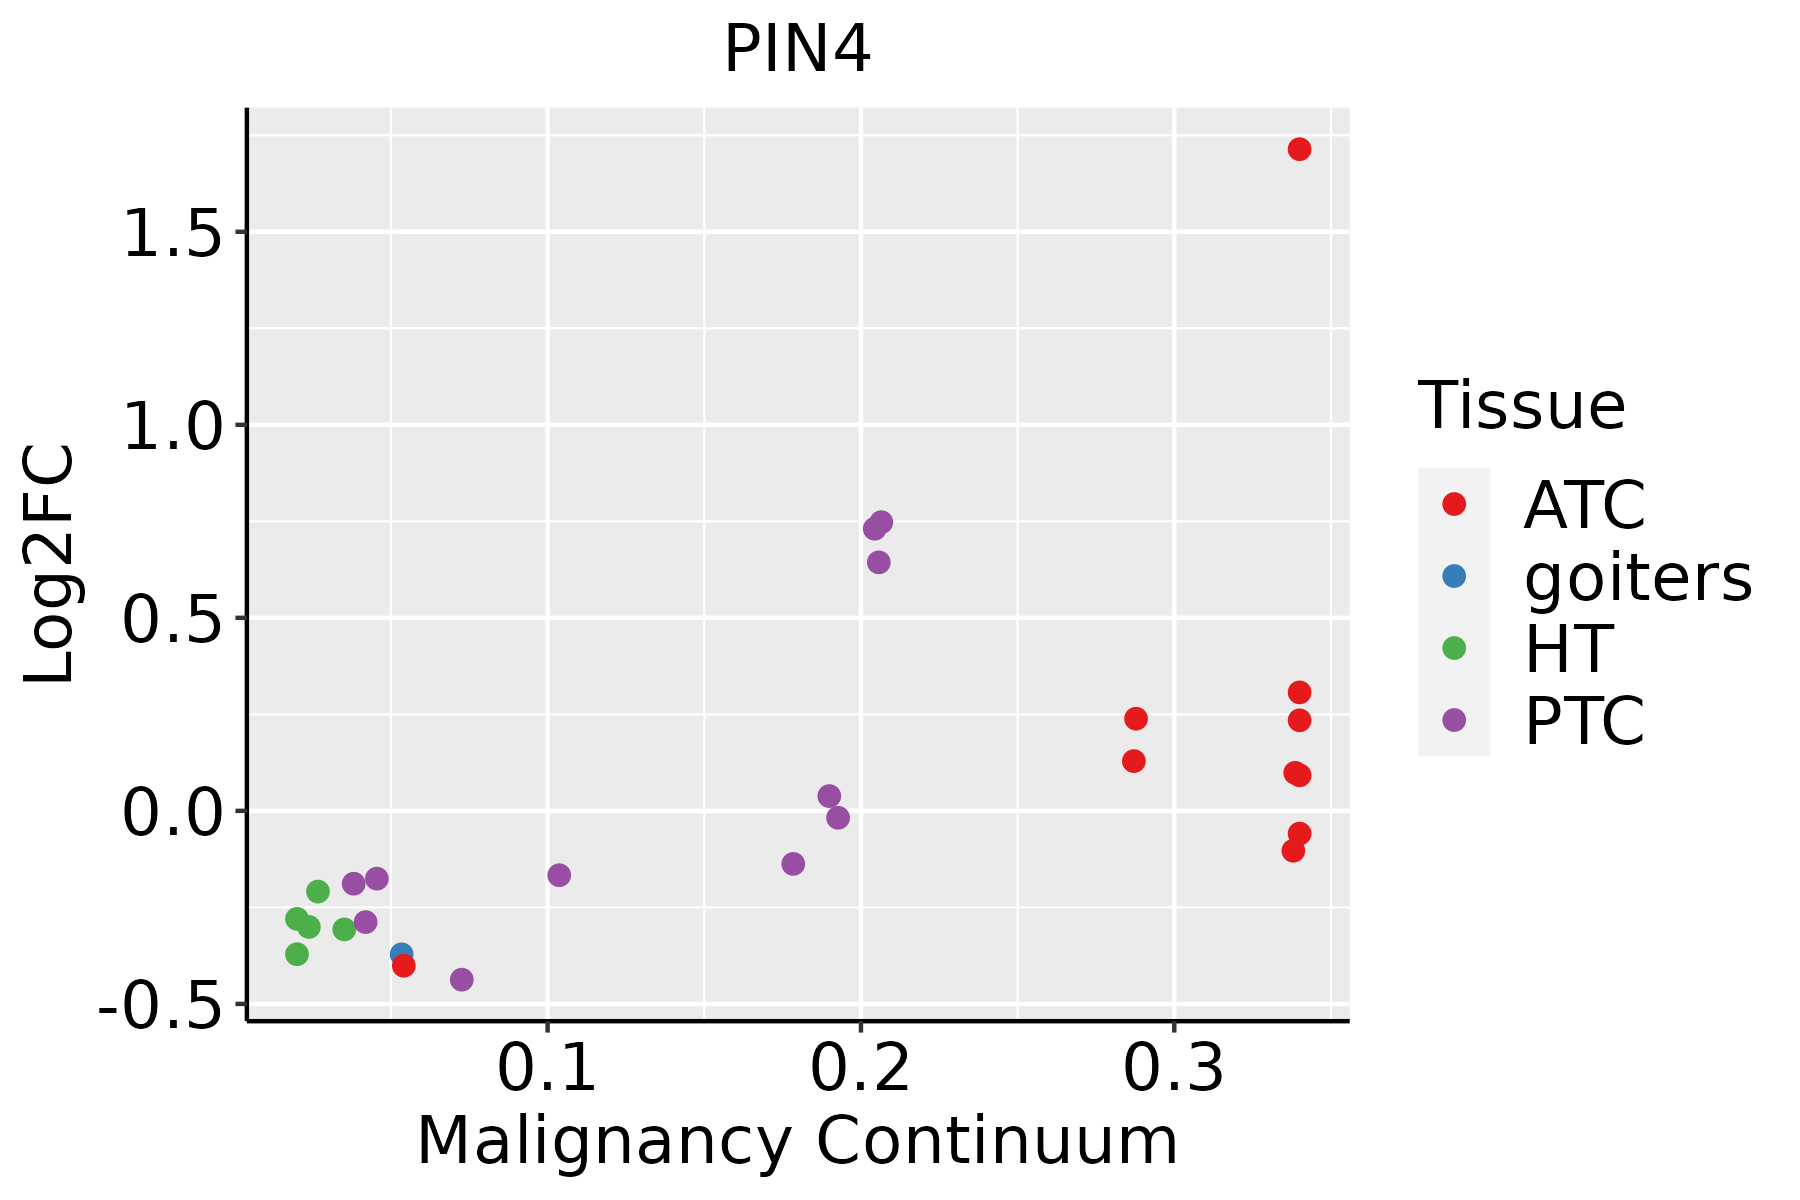 | ATC: Anaplastic thyroid cancer |
| HT: Hashimoto's thyroiditis | ||
| PTC: Papillary thyroid cancer |
| ∗log2FC in expression of this searched gene in stem-like cells from each diseased tissue sample relative to stem-like cells in normal samples in each tissue plotted against the malignancy continuum. Samples are colored based on if they are from different disease stage. |
Top |
Malignant transformation related pathway analysis |
| Find out the enriched GO biological processes and KEGG pathways involved in transition from healthy to precancer to cancer |
| Tissue | Disease Stage | Enriched GO biological Processes |
| Colorectum | AD |  |
| Colorectum | SER |  |
| Colorectum | MSS |  |
| Colorectum | MSI-H |  |
| Colorectum | FAP |  |
| ∗Top 15 enriched GO BP terms are showed in the bar plot of each disease state in each tissue. Each row represents a significant GO biological process which is colored according to the -log10(p.adjust). |
| Page: 1 2 3 4 5 6 7 8 9 |
| GO ID | Tissue | Disease Stage | Description | Gene Ratio | Bg Ratio | pvalue | p.adjust | Count |
| GO:0022613113 | Thyroid | PTC | ribonucleoprotein complex biogenesis | 292/5968 | 463/18723 | 3.24e-44 | 2.05e-40 | 292 |
| GO:0042254113 | Thyroid | PTC | ribosome biogenesis | 202/5968 | 299/18723 | 3.47e-37 | 5.47e-34 | 202 |
| GO:0006364112 | Thyroid | PTC | rRNA processing | 156/5968 | 225/18723 | 5.58e-31 | 5.03e-28 | 156 |
| GO:0016072112 | Thyroid | PTC | rRNA metabolic process | 160/5968 | 236/18723 | 5.68e-30 | 3.58e-27 | 160 |
| GO:003447018 | Thyroid | PTC | ncRNA processing | 215/5968 | 395/18723 | 7.14e-21 | 1.22e-18 | 215 |
| GO:00346608 | Thyroid | PTC | ncRNA metabolic process | 239/5968 | 485/18723 | 5.54e-16 | 4.26e-14 | 239 |
| GO:001820817 | Thyroid | PTC | peptidyl-proline modification | 42/5968 | 58/18723 | 2.71e-10 | 8.91e-09 | 42 |
| GO:00004137 | Thyroid | PTC | protein peptidyl-prolyl isomerization | 30/5968 | 42/18723 | 1.65e-07 | 3.13e-06 | 30 |
| GO:002261334 | Thyroid | ATC | ribonucleoprotein complex biogenesis | 292/6293 | 463/18723 | 3.05e-39 | 9.63e-36 | 292 |
| GO:004225434 | Thyroid | ATC | ribosome biogenesis | 203/6293 | 299/18723 | 3.63e-34 | 4.59e-31 | 203 |
| GO:000636432 | Thyroid | ATC | rRNA processing | 157/6293 | 225/18723 | 9.02e-29 | 5.70e-26 | 157 |
| GO:001607232 | Thyroid | ATC | rRNA metabolic process | 161/6293 | 236/18723 | 1.02e-27 | 5.89e-25 | 161 |
| GO:003447021 | Thyroid | ATC | ncRNA processing | 216/6293 | 395/18723 | 3.14e-18 | 3.98e-16 | 216 |
| GO:003466021 | Thyroid | ATC | ncRNA metabolic process | 240/6293 | 485/18723 | 2.03e-13 | 9.91e-12 | 240 |
| GO:001820818 | Thyroid | ATC | peptidyl-proline modification | 42/6293 | 58/18723 | 1.70e-09 | 4.21e-08 | 42 |
| GO:000041314 | Thyroid | ATC | protein peptidyl-prolyl isomerization | 30/6293 | 42/18723 | 6.06e-07 | 8.44e-06 | 30 |
| Page: 1 2 3 4 5 6 |
| Pathway ID | Tissue | Disease Stage | Description | Gene Ratio | Bg Ratio | pvalue | p.adjust | qvalue | Count |
| Page: 1 |
Top |
Cell-cell communication analysis |
| Identification of potential cell-cell interactions between two cell types and their ligand-receptor pairs for different disease states |
| Ligand | Receptor | LRpair | Pathway | Tissue | Disease Stage |
| Page: 1 |
Top |
Single-cell gene regulatory network inference analysis |
| Find out the significant the regulons (TFs) and the target genes of each regulon across cell types for different disease states |
| TF | Cell Type | Tissue | Disease Stage | Target Gene | RSS | Regulon Activity |
| ∗The dot plots of a searched regulon are shown for all cell subpopulations in each disease state of each tissue based on the regulon specific score inferred using pySCENIC and by calculating the average expression. |
| Page: 1 |
Top |
Somatic mutation of malignant transformation related genes |
| Annotation of somatic variants for genes involved in malignant transformation |
| Hugo Symbol | Variant Class | Variant Classification | dbSNP RS | HGVSc | HGVSp | HGVSp Short | SWISSPROT | BIOTYPE | SIFT | PolyPhen | Tumor Sample Barcode | Tissue | Histology | Sex | Age | Stage | Therapy Types | Drugs | Outcome |
| PIN4 | SNV | Missense_Mutation | c.261N>A | p.Met87Ile | p.M87I | Q9Y237 | protein_coding | tolerated(0.23) | benign(0.015) | TCGA-A2-A25A-01 | Breast | breast invasive carcinoma | Female | <65 | I/II | Unspecific | Cytoxan | SD | |
| PIN4 | SNV | Missense_Mutation | novel | c.113G>A | p.Gly38Glu | p.G38E | Q9Y237 | protein_coding | deleterious(0.04) | probably_damaging(0.999) | TCGA-PL-A8LV-01 | Breast | breast invasive carcinoma | Female | <65 | III/IV | Unknown | Unknown | SD |
| PIN4 | insertion | Frame_Shift_Ins | novel | c.309_310insT | p.Gly104TrpfsTer3 | p.G104Wfs*3 | Q9Y237 | protein_coding | TCGA-A6-6653-01 | Colorectum | colon adenocarcinoma | Male | >=65 | I/II | Unknown | Unknown | SD | ||
| PIN4 | SNV | Missense_Mutation | novel | c.185N>T | p.Ala62Val | p.A62V | Q9Y237 | protein_coding | deleterious(0.02) | possibly_damaging(0.602) | TCGA-AX-A1C9-01 | Endometrium | uterine corpus endometrioid carcinoma | Female | >=65 | I/II | Unknown | Unknown | SD |
| PIN4 | SNV | Missense_Mutation | c.191N>G | p.Lys64Arg | p.K64R | Q9Y237 | protein_coding | deleterious(0.03) | possibly_damaging(0.732) | TCGA-B5-A11E-01 | Endometrium | uterine corpus endometrioid carcinoma | Female | <65 | I/II | Unknown | Unknown | SD | |
| PIN4 | SNV | Missense_Mutation | rs756299765 | c.457G>A | p.Glu153Lys | p.E153K | Q9Y237 | protein_coding | deleterious(0.03) | possibly_damaging(0.88) | TCGA-BS-A0UV-01 | Endometrium | uterine corpus endometrioid carcinoma | Female | <65 | III/IV | Unknown | Unknown | SD |
| PIN4 | SNV | Missense_Mutation | novel | c.374N>T | p.Ala125Val | p.A125V | Q9Y237 | protein_coding | deleterious(0.03) | benign(0.24) | TCGA-EO-A22X-01 | Endometrium | uterine corpus endometrioid carcinoma | Female | <65 | III/IV | Unspecific | Carboplatin | Complete Response |
| PIN4 | SNV | Missense_Mutation | c.353N>A | p.Pro118Gln | p.P118Q | Q9Y237 | protein_coding | tolerated(0.05) | possibly_damaging(0.844) | TCGA-FV-A3I1-01 | Liver | liver hepatocellular carcinoma | Female | >=65 | I/II | Unknown | Unknown | SD | |
| PIN4 | SNV | Missense_Mutation | c.156N>T | p.Lys52Asn | p.K52N | Q9Y237 | protein_coding | deleterious(0.02) | probably_damaging(0.994) | TCGA-44-7670-01 | Lung | lung adenocarcinoma | Female | <65 | I/II | Chemotherapy | docetaxel | SD | |
| PIN4 | SNV | Missense_Mutation | novel | c.80C>A | p.Pro27Gln | p.P27Q | Q9Y237 | protein_coding | deleterious(0) | possibly_damaging(0.68) | TCGA-39-5039-01 | Lung | lung squamous cell carcinoma | Male | >=65 | I/II | Unknown | Unknown | SD |
| Page: 1 2 |
Top |
Related drugs of malignant transformation related genes |
| Identification of chemicals and drugs interact with genes involved in malignant transfromation |
| (DGIdb 4.0) |
| Entrez ID | Symbol | Category | Interaction Types | Drug Claim Name | Drug Name | PMIDs |
| Page: 1 |

Copyright 2023-Present -The University of Texas Health Science Center at Houston |