| Tissue | Expression Dynamics | Abbreviation |
| Colorectum (GSE201348) | 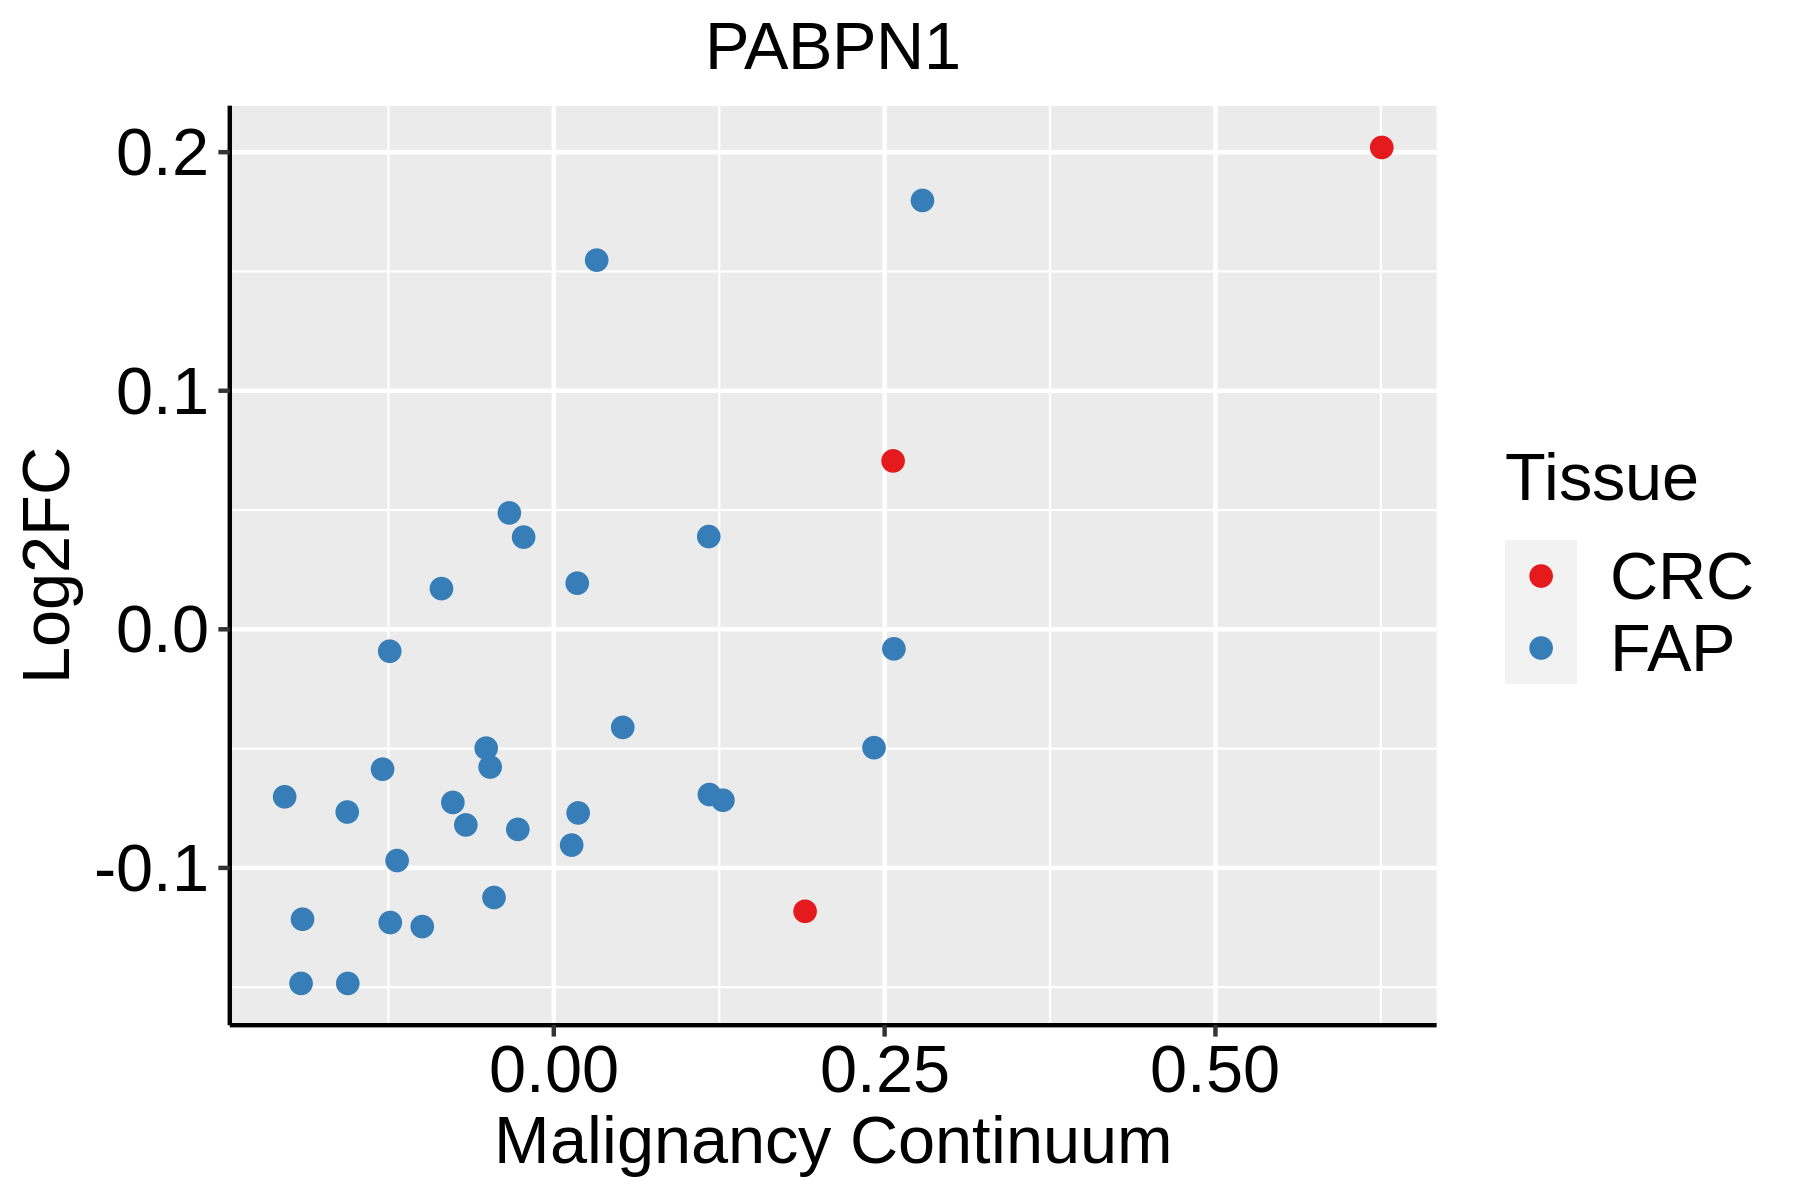 | FAP: Familial adenomatous polyposis |
| CRC: Colorectal cancer |
| Colorectum (HTA11) |  | AD: Adenomas |
| SER: Sessile serrated lesions |
| MSI-H: Microsatellite-high colorectal cancer |
| MSS: Microsatellite stable colorectal cancer |
| Endometrium |  | AEH: Atypical endometrial hyperplasia |
| EEC: Endometrioid Cancer |
| Esophagus | 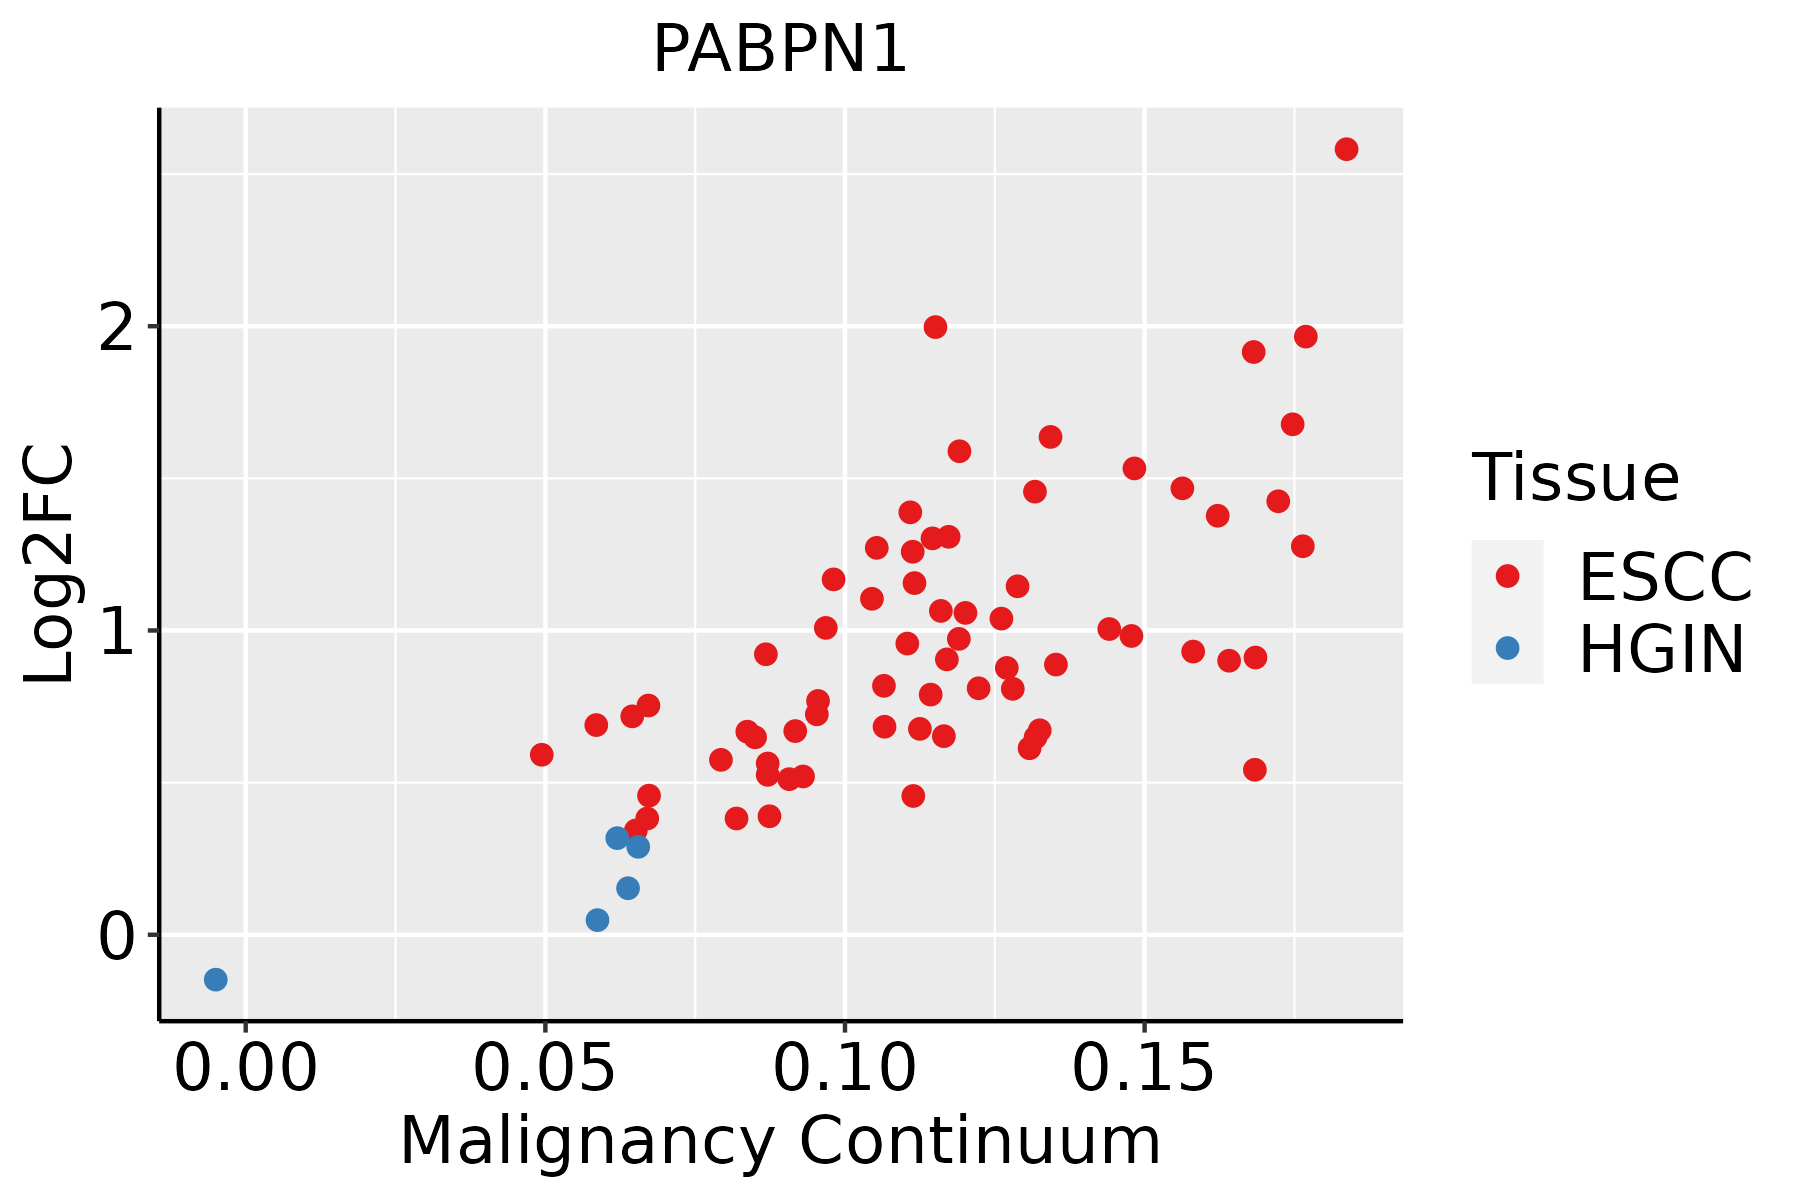 | ESCC: Esophageal squamous cell carcinoma |
| HGIN: High-grade intraepithelial neoplasias |
| LGIN: Low-grade intraepithelial neoplasias |
| Liver |  | HCC: Hepatocellular carcinoma |
| NAFLD: Non-alcoholic fatty liver disease |
| Oral Cavity | 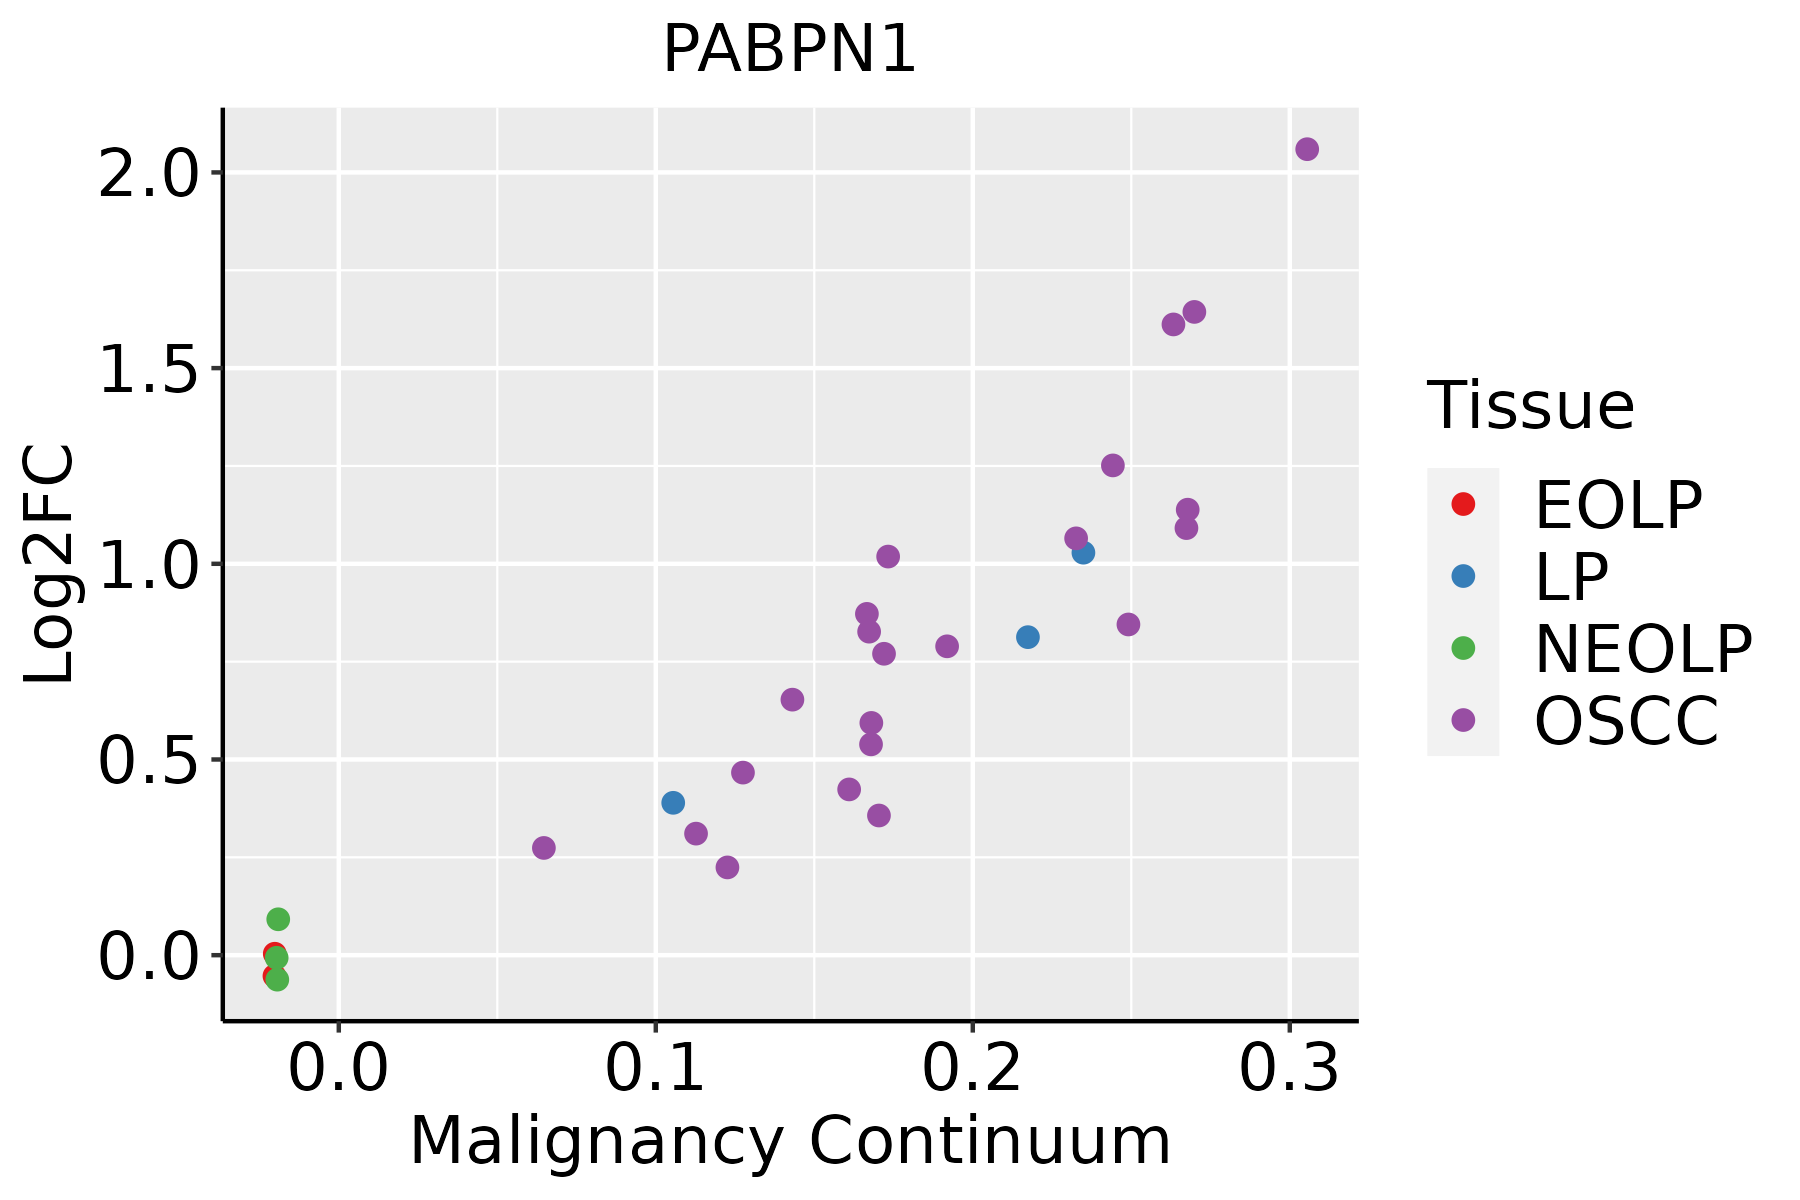 | EOLP: Erosive Oral lichen planus |
| LP: leukoplakia |
| NEOLP: Non-erosive oral lichen planus |
| OSCC: Oral squamous cell carcinoma |
| Prostate | 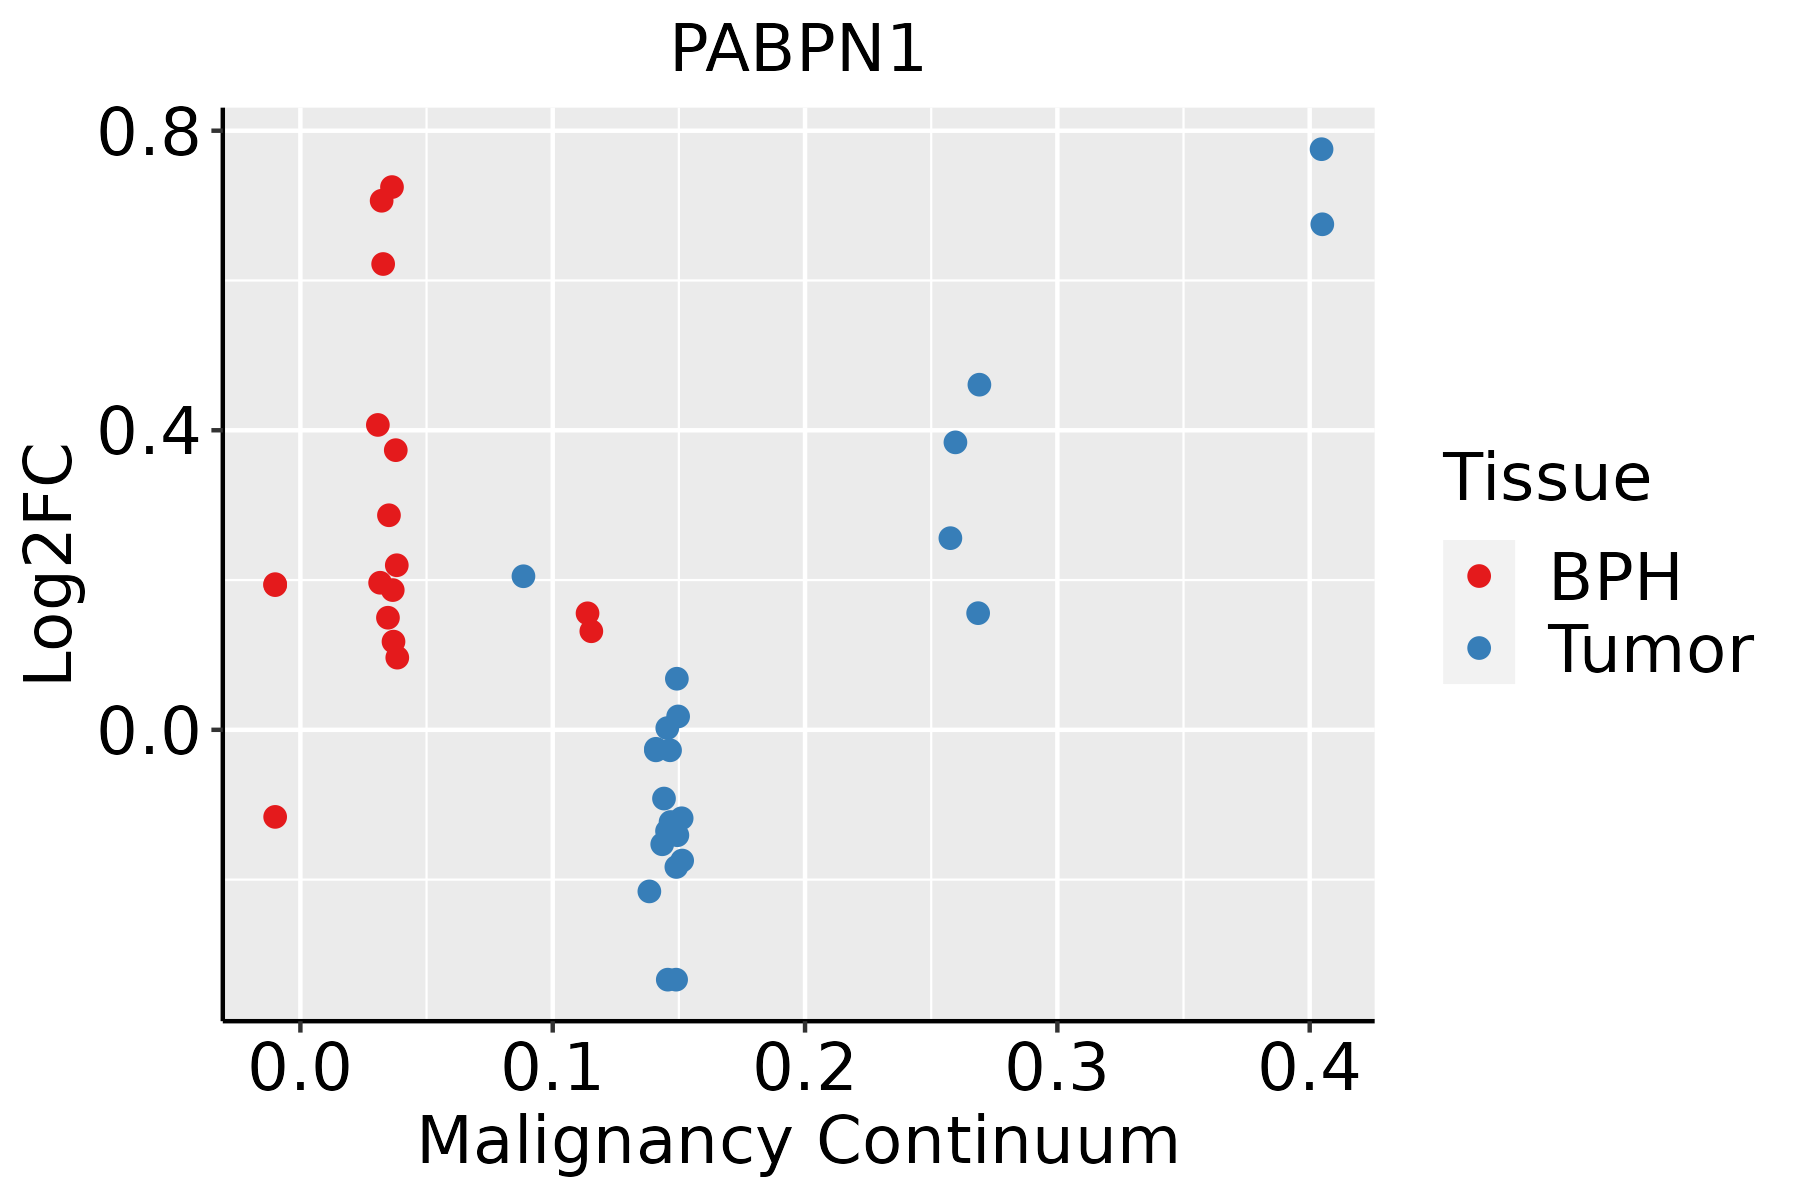 | BPH: Benign Prostatic Hyperplasia |
| Skin | 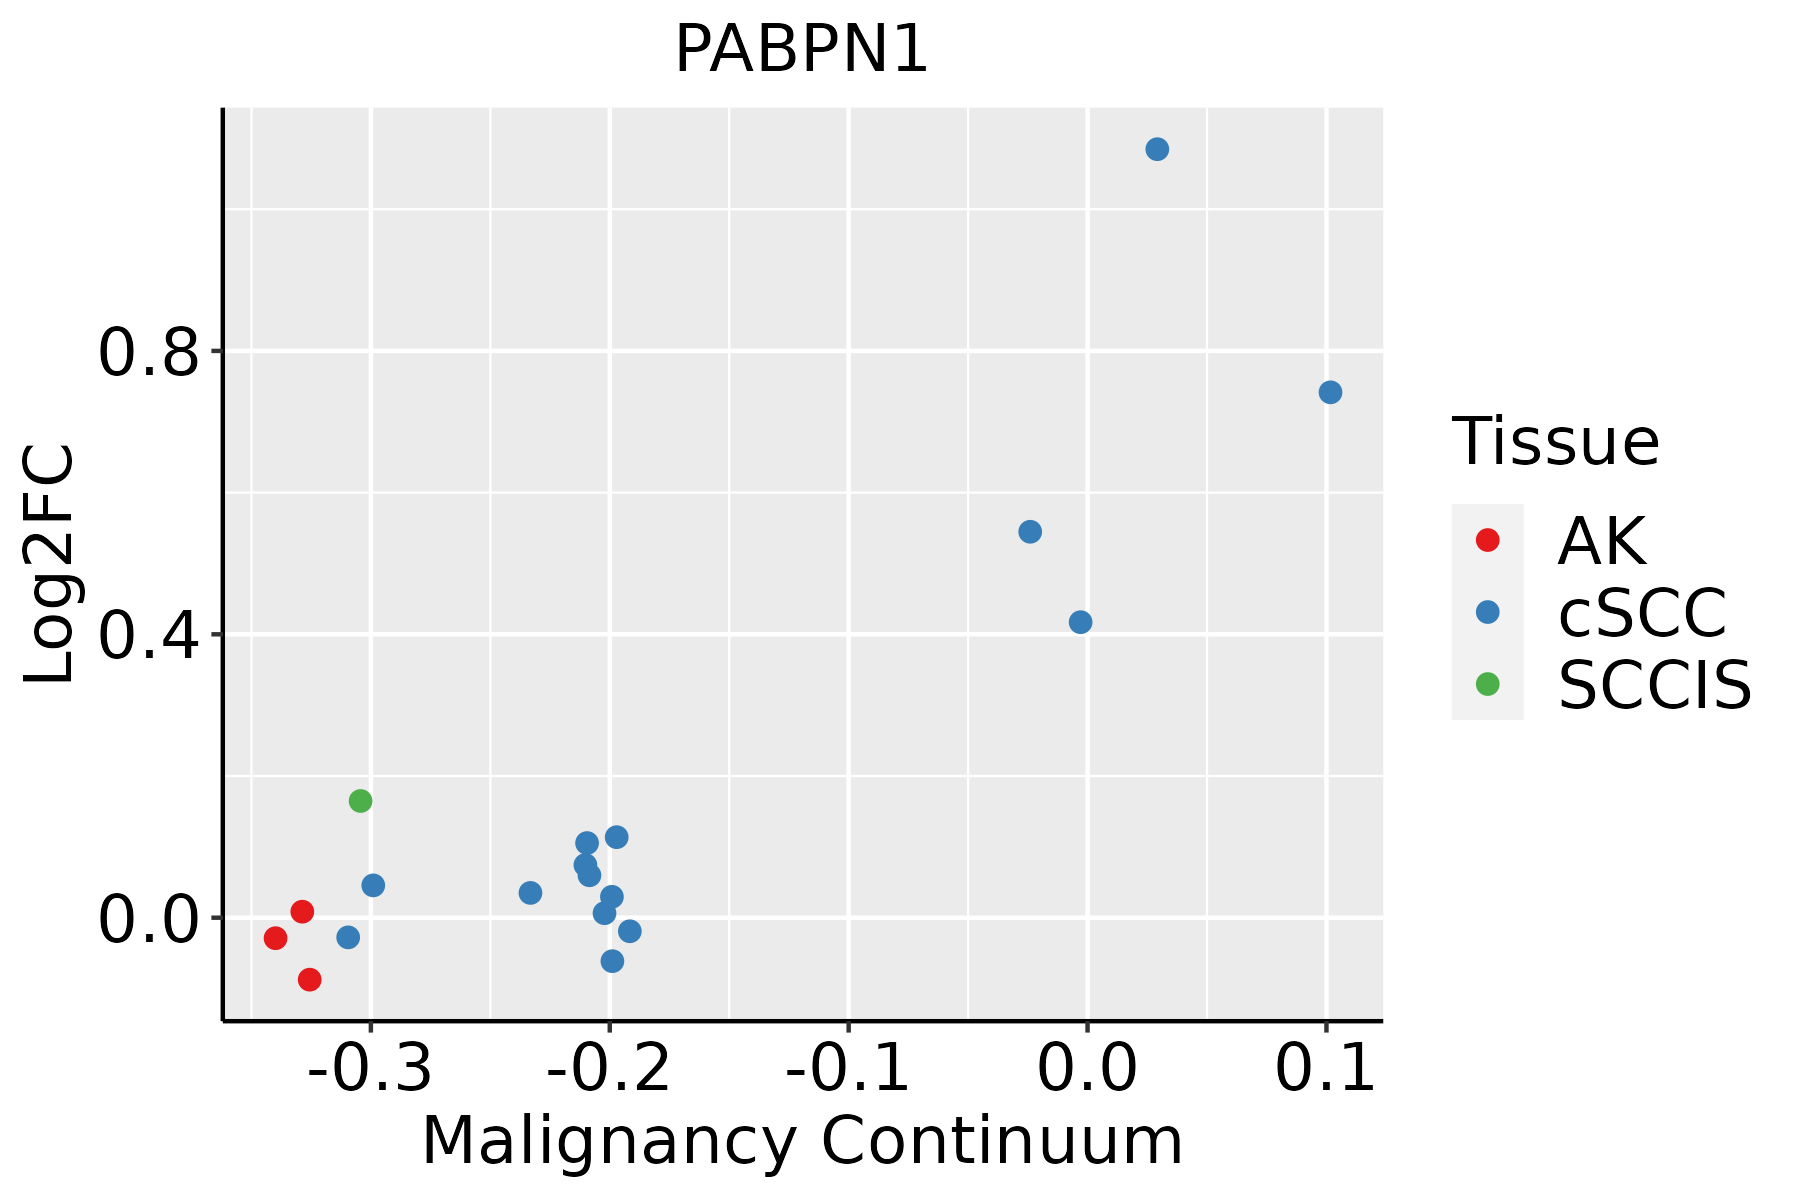 | AK: Actinic keratosis |
| cSCC: Cutaneous squamous cell carcinoma |
| SCCIS:squamous cell carcinoma in situ |
| Thyroid | 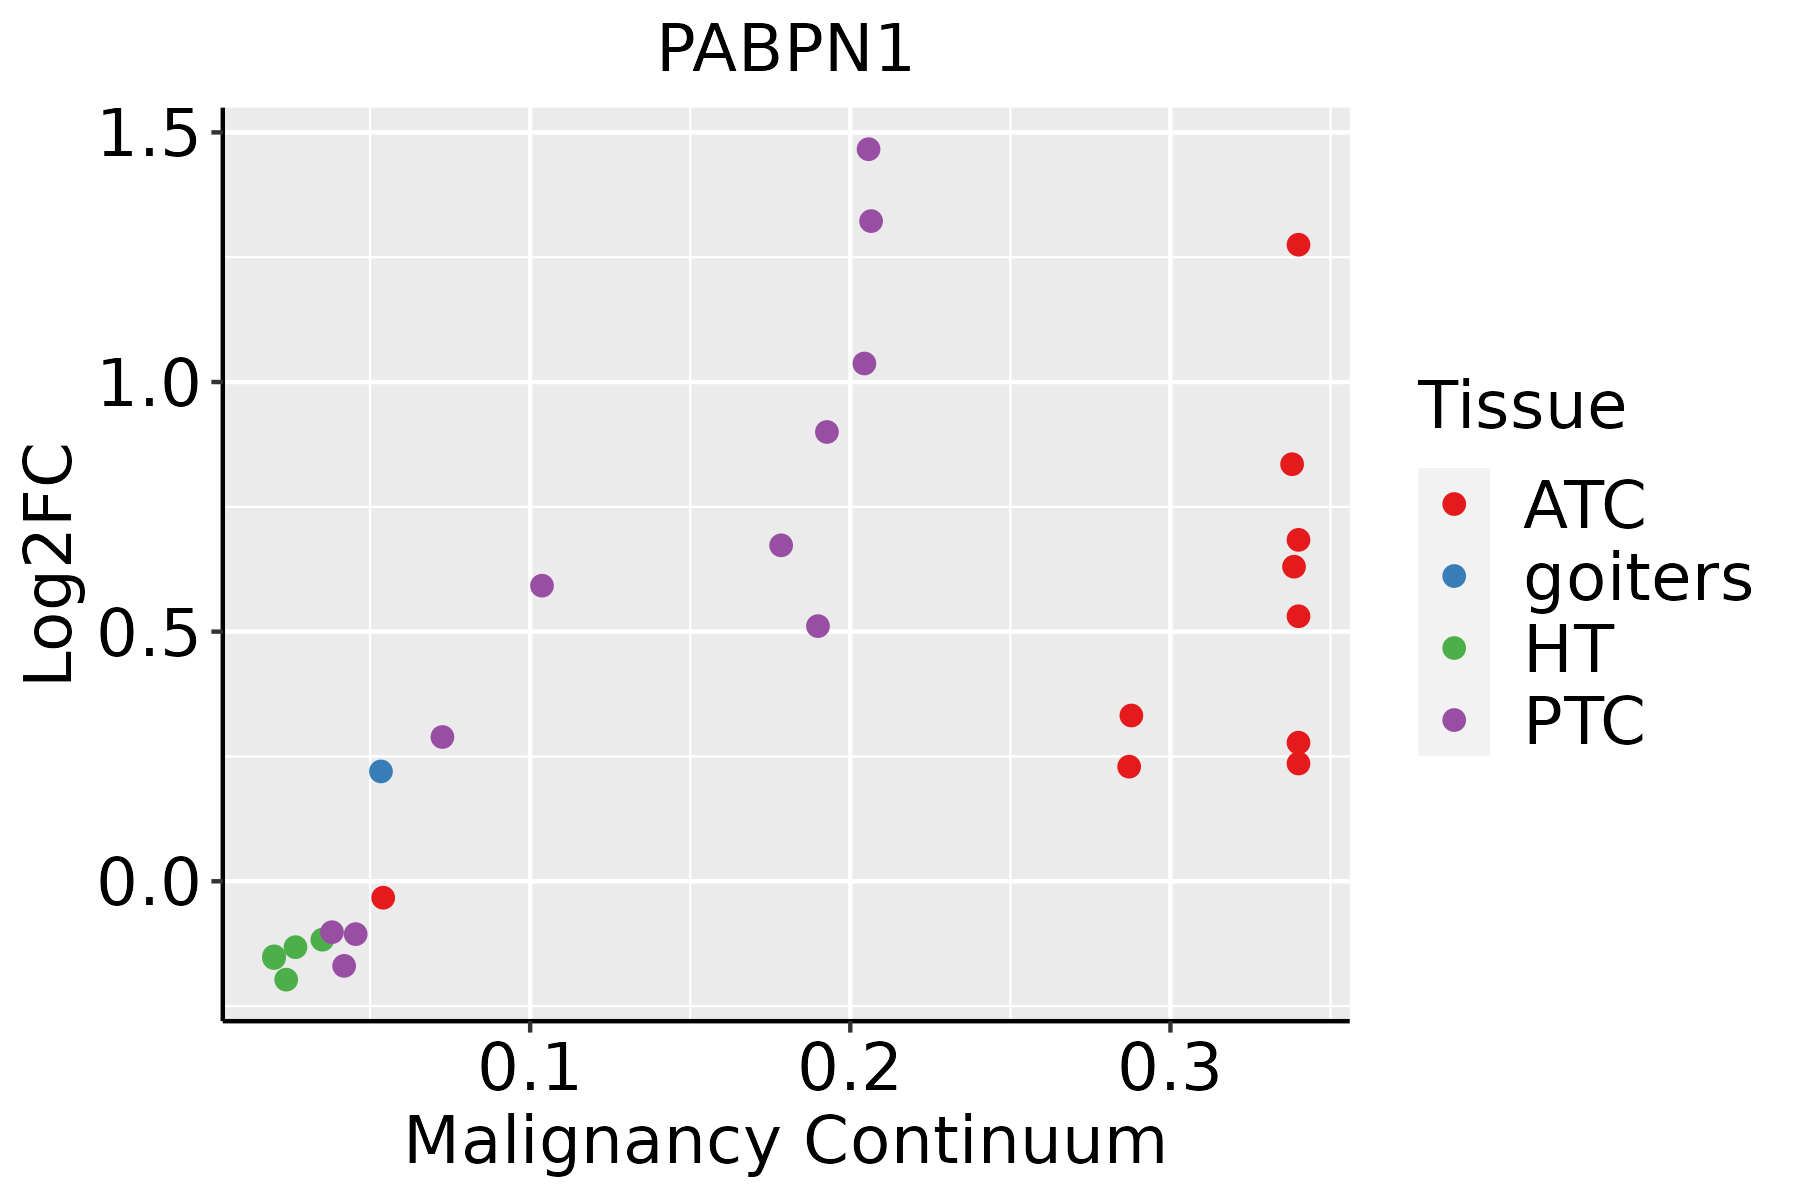 | ATC: Anaplastic thyroid cancer |
| HT: Hashimoto's thyroiditis |
| PTC: Papillary thyroid cancer |
| GO ID | Tissue | Disease Stage | Description | Gene Ratio | Bg Ratio | pvalue | p.adjust | Count |
| GO:000223719 | Esophagus | ESCC | response to molecule of bacterial origin | 194/8552 | 363/18723 | 1.64e-03 | 7.61e-03 | 194 |
| GO:007122215 | Esophagus | ESCC | cellular response to lipopolysaccharide | 113/8552 | 209/18723 | 8.79e-03 | 3.10e-02 | 113 |
| GO:007121617 | Esophagus | ESCC | cellular response to biotic stimulus | 131/8552 | 246/18723 | 9.85e-03 | 3.39e-02 | 131 |
| GO:000640312 | Liver | Cirrhotic | RNA localization | 94/4634 | 201/18723 | 8.57e-12 | 5.66e-10 | 94 |
| GO:000691312 | Liver | Cirrhotic | nucleocytoplasmic transport | 118/4634 | 301/18723 | 1.71e-08 | 6.27e-07 | 118 |
| GO:005116912 | Liver | Cirrhotic | nuclear transport | 118/4634 | 301/18723 | 1.71e-08 | 6.27e-07 | 118 |
| GO:005123611 | Liver | Cirrhotic | establishment of RNA localization | 71/4634 | 166/18723 | 2.56e-07 | 6.41e-06 | 71 |
| GO:005116812 | Liver | Cirrhotic | nuclear export | 67/4634 | 154/18723 | 2.57e-07 | 6.41e-06 | 67 |
| GO:00506576 | Liver | Cirrhotic | nucleic acid transport | 69/4634 | 163/18723 | 5.97e-07 | 1.30e-05 | 69 |
| GO:00506586 | Liver | Cirrhotic | RNA transport | 69/4634 | 163/18723 | 5.97e-07 | 1.30e-05 | 69 |
| GO:00159316 | Liver | Cirrhotic | nucleobase-containing compound transport | 87/4634 | 222/18723 | 1.25e-06 | 2.52e-05 | 87 |
| GO:00510282 | Liver | Cirrhotic | mRNA transport | 56/4634 | 130/18723 | 3.47e-06 | 5.97e-05 | 56 |
| GO:00324966 | Liver | Cirrhotic | response to lipopolysaccharide | 111/4634 | 343/18723 | 8.15e-04 | 5.95e-03 | 111 |
| GO:0071166 | Liver | Cirrhotic | ribonucleoprotein complex localization | 32/4634 | 77/18723 | 8.65e-04 | 6.23e-03 | 32 |
| GO:00064052 | Liver | Cirrhotic | RNA export from nucleus | 34/4634 | 84/18723 | 1.06e-03 | 7.40e-03 | 34 |
| GO:0031503 | Liver | Cirrhotic | protein-containing complex localization | 75/4634 | 220/18723 | 1.13e-03 | 7.73e-03 | 75 |
| GO:0071426 | Liver | Cirrhotic | ribonucleoprotein complex export from nucleus | 31/4634 | 76/18723 | 1.49e-03 | 9.87e-03 | 31 |
| GO:00022376 | Liver | Cirrhotic | response to molecule of bacterial origin | 113/4634 | 363/18723 | 3.23e-03 | 1.81e-02 | 113 |
| GO:00064062 | Liver | Cirrhotic | mRNA export from nucleus | 23/4634 | 59/18723 | 1.08e-02 | 4.77e-02 | 23 |
| GO:00714272 | Liver | Cirrhotic | mRNA-containing ribonucleoprotein complex export from nucleus | 23/4634 | 59/18723 | 1.08e-02 | 4.77e-02 | 23 |
| Pathway ID | Tissue | Disease Stage | Description | Gene Ratio | Bg Ratio | pvalue | p.adjust | qvalue | Count |
| hsa03015 | Colorectum | AD | mRNA surveillance pathway | 35/2092 | 97/8465 | 7.95e-03 | 3.13e-02 | 2.00e-02 | 35 |
| hsa030151 | Colorectum | AD | mRNA surveillance pathway | 35/2092 | 97/8465 | 7.95e-03 | 3.13e-02 | 2.00e-02 | 35 |
| hsa030159 | Esophagus | HGIN | mRNA surveillance pathway | 30/1383 | 97/8465 | 2.48e-04 | 2.69e-03 | 2.14e-03 | 30 |
| hsa0516420 | Esophagus | HGIN | Influenza A | 42/1383 | 171/8465 | 3.41e-03 | 2.54e-02 | 2.02e-02 | 42 |
| hsa0301514 | Esophagus | HGIN | mRNA surveillance pathway | 30/1383 | 97/8465 | 2.48e-04 | 2.69e-03 | 2.14e-03 | 30 |
| hsa05164110 | Esophagus | HGIN | Influenza A | 42/1383 | 171/8465 | 3.41e-03 | 2.54e-02 | 2.02e-02 | 42 |
| hsa0516425 | Esophagus | ESCC | Influenza A | 122/4205 | 171/8465 | 5.01e-09 | 4.79e-08 | 2.45e-08 | 122 |
| hsa0301524 | Esophagus | ESCC | mRNA surveillance pathway | 72/4205 | 97/8465 | 6.12e-07 | 4.10e-06 | 2.10e-06 | 72 |
| hsa0516435 | Esophagus | ESCC | Influenza A | 122/4205 | 171/8465 | 5.01e-09 | 4.79e-08 | 2.45e-08 | 122 |
| hsa0301534 | Esophagus | ESCC | mRNA surveillance pathway | 72/4205 | 97/8465 | 6.12e-07 | 4.10e-06 | 2.10e-06 | 72 |
| hsa030154 | Liver | Cirrhotic | mRNA surveillance pathway | 46/2530 | 97/8465 | 1.92e-04 | 1.30e-03 | 8.03e-04 | 46 |
| hsa0516410 | Liver | Cirrhotic | Influenza A | 66/2530 | 171/8465 | 8.56e-03 | 2.91e-02 | 1.79e-02 | 66 |
| hsa0301511 | Liver | Cirrhotic | mRNA surveillance pathway | 46/2530 | 97/8465 | 1.92e-04 | 1.30e-03 | 8.03e-04 | 46 |
| hsa0516411 | Liver | Cirrhotic | Influenza A | 66/2530 | 171/8465 | 8.56e-03 | 2.91e-02 | 1.79e-02 | 66 |
| hsa0301521 | Liver | HCC | mRNA surveillance pathway | 66/4020 | 97/8465 | 3.16e-05 | 1.88e-04 | 1.04e-04 | 66 |
| hsa0516421 | Liver | HCC | Influenza A | 101/4020 | 171/8465 | 1.41e-03 | 5.07e-03 | 2.82e-03 | 101 |
| hsa0301531 | Liver | HCC | mRNA surveillance pathway | 66/4020 | 97/8465 | 3.16e-05 | 1.88e-04 | 1.04e-04 | 66 |
| hsa0516431 | Liver | HCC | Influenza A | 101/4020 | 171/8465 | 1.41e-03 | 5.07e-03 | 2.82e-03 | 101 |
| hsa030158 | Oral cavity | OSCC | mRNA surveillance pathway | 75/3704 | 97/8465 | 1.30e-11 | 2.01e-10 | 1.02e-10 | 75 |
| hsa0516418 | Oral cavity | OSCC | Influenza A | 116/3704 | 171/8465 | 1.23e-10 | 1.78e-09 | 9.08e-10 | 116 |
| Hugo Symbol | Variant Class | Variant Classification | dbSNP RS | HGVSc | HGVSp | HGVSp Short | SWISSPROT | BIOTYPE | SIFT | PolyPhen | Tumor Sample Barcode | Tissue | Histology | Sex | Age | Stage | Therapy Types | Drugs | Outcome |
| PABPN1 | SNV | Missense_Mutation | | c.424G>A | p.Glu142Lys | p.E142K | Q86U42 | protein_coding | tolerated(0.18) | benign(0.125) | TCGA-BH-A18P-01 | Breast | breast invasive carcinoma | Female | <65 | I/II | Unknown | Unknown | PD |
| PABPN1 | SNV | Missense_Mutation | rs201713476 | c.533N>G | p.Asn178Ser | p.N178S | Q86U42 | protein_coding | deleterious(0.01) | probably_damaging(0.966) | TCGA-D8-A27K-01 | Breast | breast invasive carcinoma | Female | <65 | I/II | Chemotherapy | adriamycin+cyclophosphamid | SD |
| PABPN1 | SNV | Missense_Mutation | novel | c.729N>T | p.Lys243Asn | p.K243N | Q86U42 | protein_coding | deleterious(0) | possibly_damaging(0.823) | TCGA-C5-A7CJ-01 | Cervix | cervical & endocervical cancer | Female | <65 | I/II | Chemotherapy | cisplatin | SD |
| PABPN1 | SNV | Missense_Mutation | | c.833C>G | p.Ser278Cys | p.S278C | Q86U42 | protein_coding | tolerated(0.05) | benign(0.017) | TCGA-IR-A3LK-01 | Cervix | cervical & endocervical cancer | Female | >=65 | I/II | Chemotherapy | cisplatin | PD |
| PABPN1 | SNV | Missense_Mutation | | c.802N>T | p.Ala268Ser | p.A268S | Q86U42 | protein_coding | tolerated(0.12) | benign(0.031) | TCGA-DY-A1DG-01 | Colorectum | rectum adenocarcinoma | Male | >=65 | I/II | Unknown | Unknown | PD |
| PABPN1 | deletion | Frame_Shift_Del | | c.862delN | p.Arg289GlyfsTer24 | p.R289Gfs*24 | Q86U42 | protein_coding | | | TCGA-AA-3966-01 | Colorectum | colon adenocarcinoma | Female | >=65 | I/II | Unknown | Unknown | SD |
| PABPN1 | SNV | Missense_Mutation | rs758290474 | c.805N>T | p.Arg269Trp | p.R269W | Q86U42 | protein_coding | deleterious(0.01) | probably_damaging(0.988) | TCGA-AJ-A3OK-01 | Endometrium | uterine corpus endometrioid carcinoma | Female | >=65 | I/II | Chemotherapy | carboplatin | CR |
| PABPN1 | SNV | Missense_Mutation | | c.411N>T | p.Lys137Asn | p.K137N | Q86U42 | protein_coding | deleterious(0.02) | possibly_damaging(0.885) | TCGA-D1-A103-01 | Endometrium | uterine corpus endometrioid carcinoma | Female | >=65 | I/II | Unknown | Unknown | SD |
| PABPN1 | SNV | Missense_Mutation | | c.872N>A | p.Arg291His | p.R291H | Q86U42 | protein_coding | tolerated(0.08) | probably_damaging(0.987) | TCGA-D1-A103-01 | Endometrium | uterine corpus endometrioid carcinoma | Female | >=65 | I/II | Unknown | Unknown | SD |
| PABPN1 | SNV | Missense_Mutation | novel | c.559N>A | p.Glu187Lys | p.E187K | Q86U42 | protein_coding | deleterious(0) | probably_damaging(0.954) | TCGA-DF-A2KU-01 | Endometrium | uterine corpus endometrioid carcinoma | Female | Unknown | I/II | Unknown | Unknown | SD |


