
|
|||||
|
 | |
| |
| |
| |
| |
| |
|
Gene: NUS1 |
Gene summary for NUS1 |
| Gene information | Species | Human | Gene symbol | NUS1 | Gene ID | 116150 |
| Gene name | NUS1 dehydrodolichyl diphosphate synthase subunit | |
| Gene Alias | C6orf68 | |
| Cytomap | 6q22.1 | |
| Gene Type | protein-coding | GO ID | GO:0001525 | UniProtAcc | Q96E22 |
Top |
Malignant transformation analysis |
| Identification of the aberrant gene expression in precancerous and cancerous lesions by comparing the gene expression of stem-like cells in diseased tissues with normal stem cells |
| Entrez ID | Symbol | Replicates | Species | Organ | Tissue | Adj P-value | Log2FC | Malignancy |
| 116150 | NUS1 | LZE20T | Human | Esophagus | ESCC | 1.94e-06 | 2.09e-02 | 0.0662 |
| 116150 | NUS1 | LZE24T | Human | Esophagus | ESCC | 1.15e-09 | 2.50e-01 | 0.0596 |
| 116150 | NUS1 | LZE21T | Human | Esophagus | ESCC | 1.65e-02 | 4.10e-02 | 0.0655 |
| 116150 | NUS1 | P2T-E | Human | Esophagus | ESCC | 1.27e-15 | 2.27e-01 | 0.1177 |
| 116150 | NUS1 | P4T-E | Human | Esophagus | ESCC | 1.18e-14 | 3.74e-01 | 0.1323 |
| 116150 | NUS1 | P5T-E | Human | Esophagus | ESCC | 2.53e-20 | 4.68e-01 | 0.1327 |
| 116150 | NUS1 | P8T-E | Human | Esophagus | ESCC | 4.19e-12 | 1.77e-01 | 0.0889 |
| 116150 | NUS1 | P9T-E | Human | Esophagus | ESCC | 1.64e-05 | 7.49e-02 | 0.1131 |
| 116150 | NUS1 | P10T-E | Human | Esophagus | ESCC | 3.26e-23 | 2.24e-01 | 0.116 |
| 116150 | NUS1 | P11T-E | Human | Esophagus | ESCC | 2.28e-09 | 2.50e-01 | 0.1426 |
| 116150 | NUS1 | P12T-E | Human | Esophagus | ESCC | 3.87e-25 | 2.22e-01 | 0.1122 |
| 116150 | NUS1 | P15T-E | Human | Esophagus | ESCC | 8.94e-20 | 4.13e-01 | 0.1149 |
| 116150 | NUS1 | P16T-E | Human | Esophagus | ESCC | 1.93e-21 | 4.41e-01 | 0.1153 |
| 116150 | NUS1 | P17T-E | Human | Esophagus | ESCC | 1.23e-11 | 3.04e-01 | 0.1278 |
| 116150 | NUS1 | P19T-E | Human | Esophagus | ESCC | 2.89e-03 | 2.97e-01 | 0.1662 |
| 116150 | NUS1 | P20T-E | Human | Esophagus | ESCC | 1.12e-13 | 1.20e-01 | 0.1124 |
| 116150 | NUS1 | P21T-E | Human | Esophagus | ESCC | 3.88e-19 | 4.40e-01 | 0.1617 |
| 116150 | NUS1 | P22T-E | Human | Esophagus | ESCC | 1.27e-13 | 9.52e-02 | 0.1236 |
| 116150 | NUS1 | P23T-E | Human | Esophagus | ESCC | 3.11e-16 | 5.28e-01 | 0.108 |
| 116150 | NUS1 | P24T-E | Human | Esophagus | ESCC | 5.16e-20 | 3.42e-01 | 0.1287 |
| Page: 1 2 3 4 5 6 |
| Tissue | Expression Dynamics | Abbreviation |
| Esophagus | 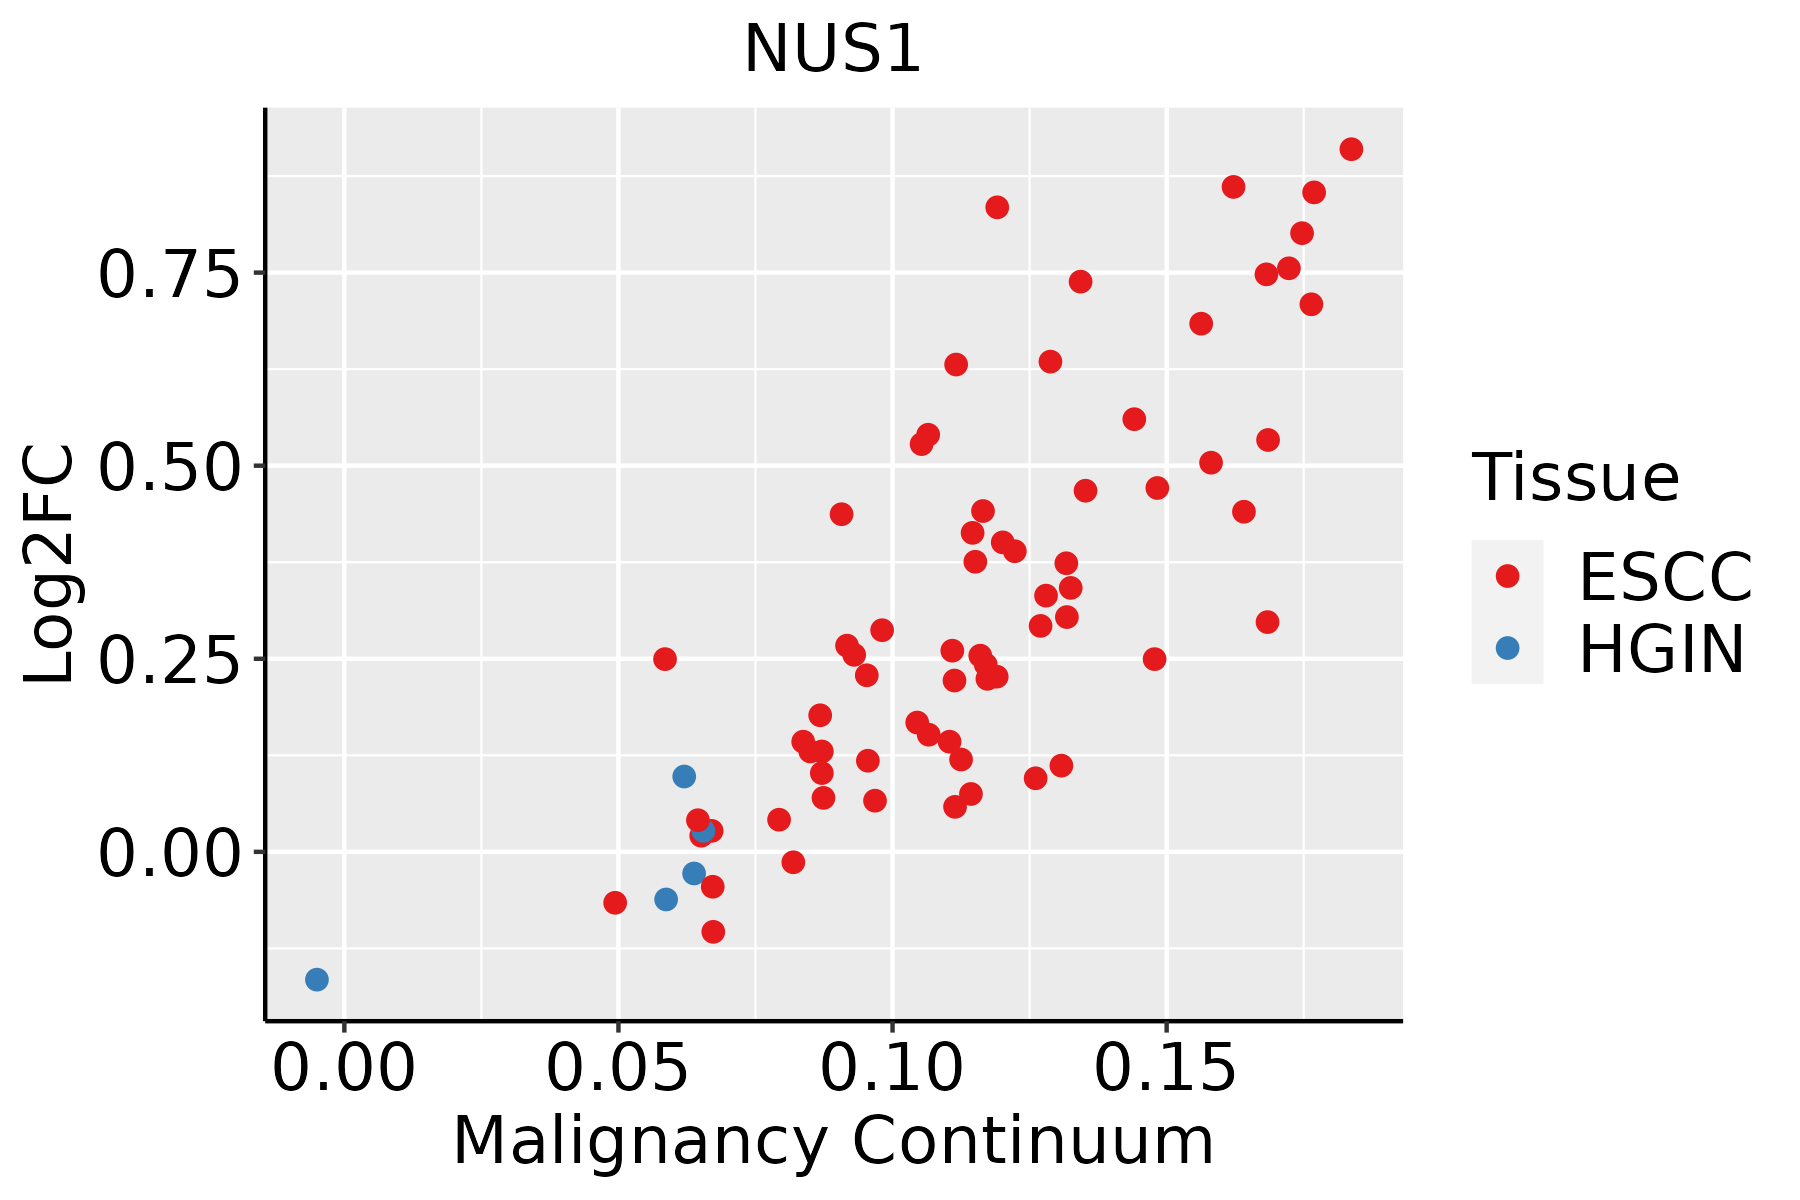 | ESCC: Esophageal squamous cell carcinoma |
| HGIN: High-grade intraepithelial neoplasias | ||
| LGIN: Low-grade intraepithelial neoplasias | ||
| Liver | 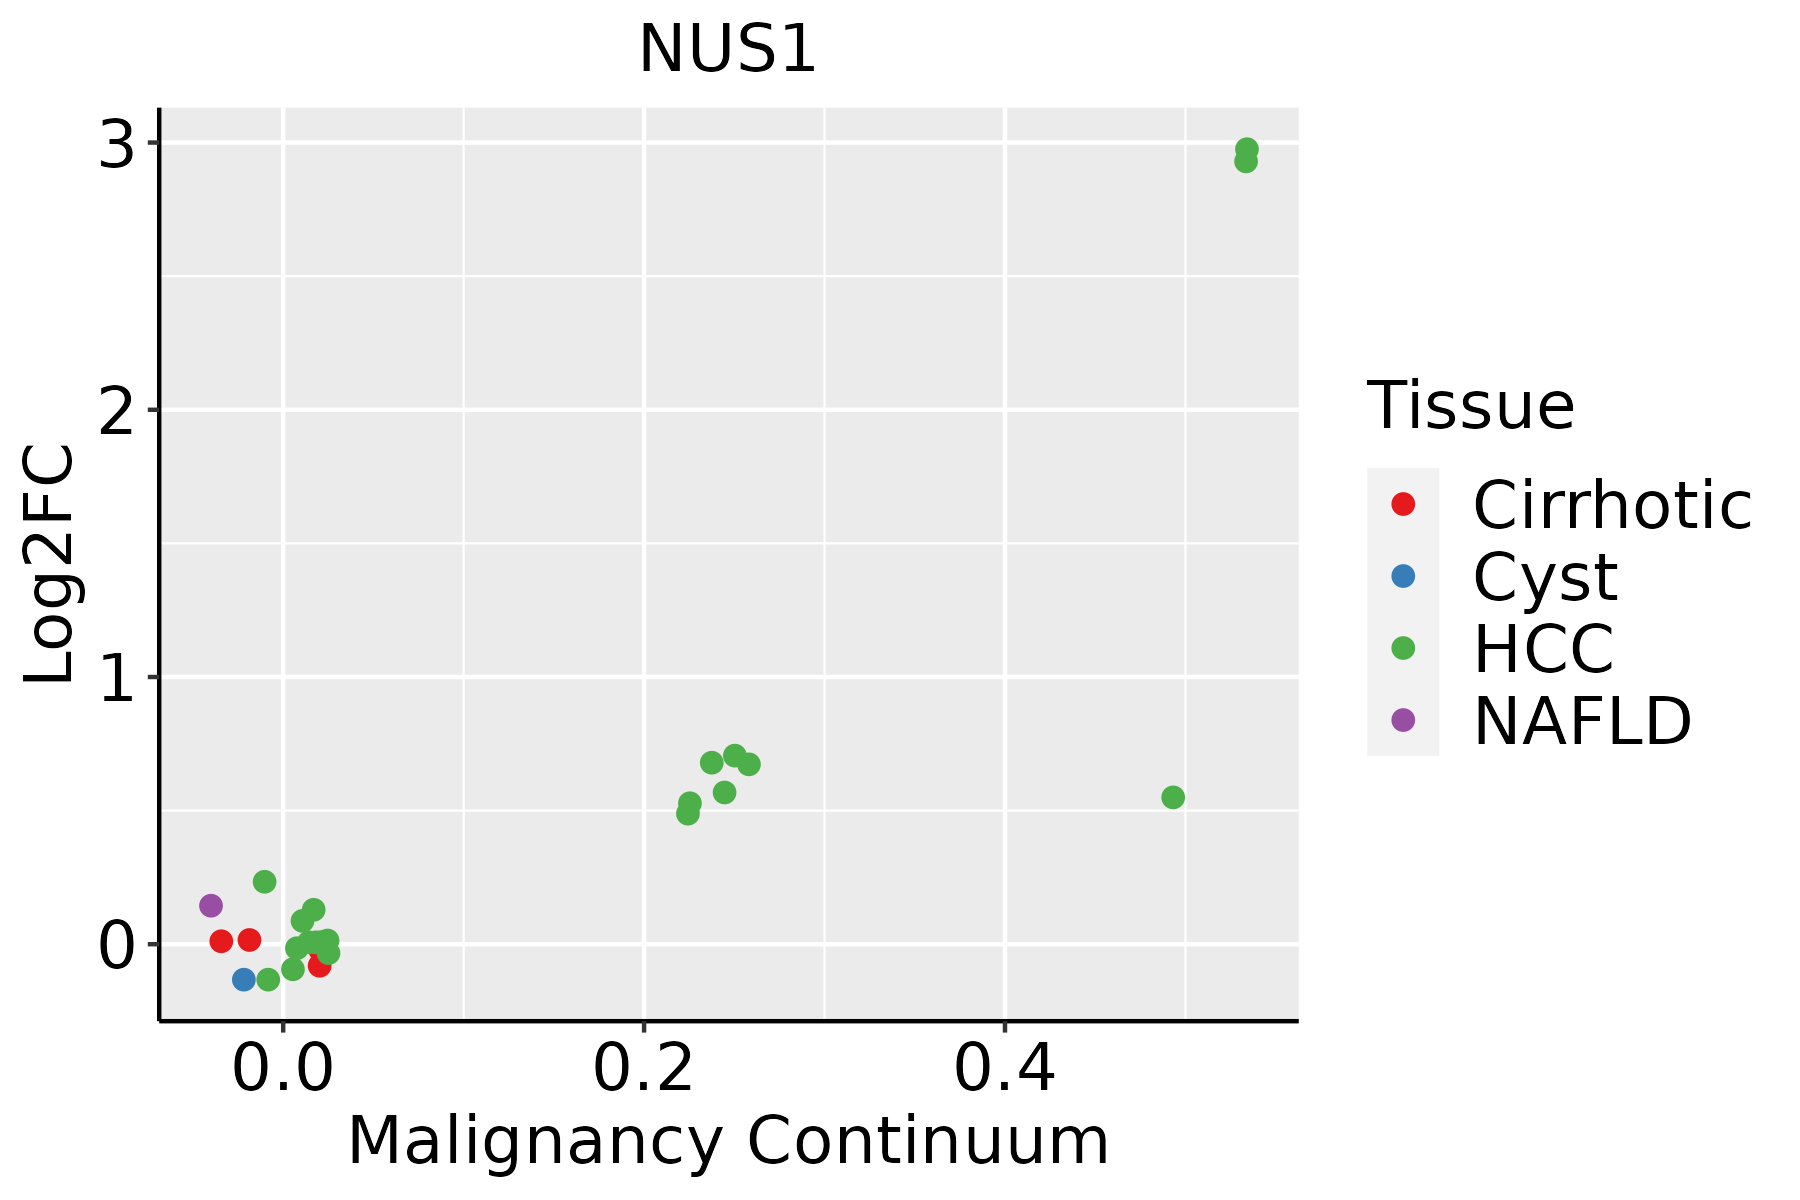 | HCC: Hepatocellular carcinoma |
| NAFLD: Non-alcoholic fatty liver disease | ||
| Oral Cavity |  | EOLP: Erosive Oral lichen planus |
| LP: leukoplakia | ||
| NEOLP: Non-erosive oral lichen planus | ||
| OSCC: Oral squamous cell carcinoma | ||
| Skin |  | AK: Actinic keratosis |
| cSCC: Cutaneous squamous cell carcinoma | ||
| SCCIS:squamous cell carcinoma in situ | ||
| Thyroid |  | ATC: Anaplastic thyroid cancer |
| HT: Hashimoto's thyroiditis | ||
| PTC: Papillary thyroid cancer |
| ∗log2FC in expression of this searched gene in stem-like cells from each diseased tissue sample relative to stem-like cells in normal samples in each tissue plotted against the malignancy continuum. Samples are colored based on if they are from different disease stage. |
Top |
Malignant transformation related pathway analysis |
| Find out the enriched GO biological processes and KEGG pathways involved in transition from healthy to precancer to cancer |
| Tissue | Disease Stage | Enriched GO biological Processes |
| Colorectum | AD |  |
| Colorectum | SER |  |
| Colorectum | MSS |  |
| Colorectum | MSI-H |  |
| Colorectum | FAP |  |
| ∗Top 15 enriched GO BP terms are showed in the bar plot of each disease state in each tissue. Each row represents a significant GO biological process which is colored according to the -log10(p.adjust). |
| Page: 1 2 3 4 5 6 7 8 9 |
| GO ID | Tissue | Disease Stage | Description | Gene Ratio | Bg Ratio | pvalue | p.adjust | Count |
| GO:004354219 | Thyroid | PTC | endothelial cell migration | 112/5968 | 279/18723 | 2.03e-03 | 1.09e-02 | 112 |
| GO:00323662 | Thyroid | PTC | intracellular sterol transport | 17/5968 | 29/18723 | 2.65e-03 | 1.35e-02 | 17 |
| GO:00323672 | Thyroid | PTC | intracellular cholesterol transport | 17/5968 | 29/18723 | 2.65e-03 | 1.35e-02 | 17 |
| GO:00700855 | Thyroid | PTC | glycosylation | 96/5968 | 240/18723 | 4.57e-03 | 2.15e-02 | 96 |
| GO:00091013 | Thyroid | PTC | glycoprotein biosynthetic process | 123/5968 | 317/18723 | 5.05e-03 | 2.33e-02 | 123 |
| GO:00091003 | Thyroid | PTC | glycoprotein metabolic process | 147/5968 | 387/18723 | 5.87e-03 | 2.64e-02 | 147 |
| GO:00509991 | Thyroid | PTC | regulation of nitric-oxide synthase activity | 22/5968 | 44/18723 | 9.27e-03 | 3.82e-02 | 22 |
| GO:001059416 | Thyroid | PTC | regulation of endothelial cell migration | 91/5968 | 232/18723 | 1.03e-02 | 4.18e-02 | 91 |
| GO:003238632 | Thyroid | ATC | regulation of intracellular transport | 203/6293 | 337/18723 | 6.16e-24 | 1.85e-21 | 203 |
| GO:000166731 | Thyroid | ATC | ameboidal-type cell migration | 228/6293 | 475/18723 | 3.72e-11 | 1.22e-09 | 228 |
| GO:001063131 | Thyroid | ATC | epithelial cell migration | 169/6293 | 357/18723 | 4.21e-08 | 7.69e-07 | 169 |
| GO:009013031 | Thyroid | ATC | tissue migration | 171/6293 | 365/18723 | 8.55e-08 | 1.47e-06 | 171 |
| GO:009013231 | Thyroid | ATC | epithelium migration | 169/6293 | 360/18723 | 8.57e-08 | 1.47e-06 | 169 |
| GO:001063432 | Thyroid | ATC | positive regulation of epithelial cell migration | 92/6293 | 176/18723 | 2.38e-07 | 3.70e-06 | 92 |
| GO:001063231 | Thyroid | ATC | regulation of epithelial cell migration | 137/6293 | 292/18723 | 1.44e-06 | 1.77e-05 | 137 |
| GO:004354231 | Thyroid | ATC | endothelial cell migration | 127/6293 | 279/18723 | 2.14e-05 | 1.91e-04 | 127 |
| GO:000648715 | Thyroid | ATC | protein N-linked glycosylation | 38/6293 | 65/18723 | 3.39e-05 | 2.80e-04 | 38 |
| GO:001059531 | Thyroid | ATC | positive regulation of endothelial cell migration | 67/6293 | 133/18723 | 4.61e-05 | 3.70e-04 | 67 |
| GO:001059431 | Thyroid | ATC | regulation of endothelial cell migration | 102/6293 | 232/18723 | 6.17e-04 | 3.51e-03 | 102 |
| GO:003236611 | Thyroid | ATC | intracellular sterol transport | 17/6293 | 29/18723 | 4.95e-03 | 2.03e-02 | 17 |
| Page: 1 2 3 4 5 6 7 |
| Pathway ID | Tissue | Disease Stage | Description | Gene Ratio | Bg Ratio | pvalue | p.adjust | qvalue | Count |
| hsa009005 | Esophagus | ESCC | Terpenoid backbone biosynthesis | 20/4205 | 23/8465 | 2.14e-04 | 7.87e-04 | 4.03e-04 | 20 |
| hsa0090012 | Esophagus | ESCC | Terpenoid backbone biosynthesis | 20/4205 | 23/8465 | 2.14e-04 | 7.87e-04 | 4.03e-04 | 20 |
| hsa00900 | Liver | HCC | Terpenoid backbone biosynthesis | 17/4020 | 23/8465 | 9.26e-03 | 2.46e-02 | 1.37e-02 | 17 |
| hsa009001 | Liver | HCC | Terpenoid backbone biosynthesis | 17/4020 | 23/8465 | 9.26e-03 | 2.46e-02 | 1.37e-02 | 17 |
| hsa009004 | Oral cavity | OSCC | Terpenoid backbone biosynthesis | 19/3704 | 23/8465 | 1.55e-04 | 5.34e-04 | 2.72e-04 | 19 |
| hsa0090011 | Oral cavity | OSCC | Terpenoid backbone biosynthesis | 19/3704 | 23/8465 | 1.55e-04 | 5.34e-04 | 2.72e-04 | 19 |
| Page: 1 |
Top |
Cell-cell communication analysis |
| Identification of potential cell-cell interactions between two cell types and their ligand-receptor pairs for different disease states |
| Ligand | Receptor | LRpair | Pathway | Tissue | Disease Stage |
| Page: 1 |
Top |
Single-cell gene regulatory network inference analysis |
| Find out the significant the regulons (TFs) and the target genes of each regulon across cell types for different disease states |
| TF | Cell Type | Tissue | Disease Stage | Target Gene | RSS | Regulon Activity |
| ∗The dot plots of a searched regulon are shown for all cell subpopulations in each disease state of each tissue based on the regulon specific score inferred using pySCENIC and by calculating the average expression. |
| Page: 1 |
Top |
Somatic mutation of malignant transformation related genes |
| Annotation of somatic variants for genes involved in malignant transformation |
| Hugo Symbol | Variant Class | Variant Classification | dbSNP RS | HGVSc | HGVSp | HGVSp Short | SWISSPROT | BIOTYPE | SIFT | PolyPhen | Tumor Sample Barcode | Tissue | Histology | Sex | Age | Stage | Therapy Types | Drugs | Outcome |
| NUS1 | SNV | Missense_Mutation | c.353C>G | p.Ala118Gly | p.A118G | Q96E22 | protein_coding | deleterious(0.01) | probably_damaging(1) | TCGA-D8-A1JN-01 | Breast | breast invasive carcinoma | Female | >=65 | III/IV | Hormone Therapy | anastrozolum | SD | |
| NUS1 | SNV | Missense_Mutation | c.428N>T | p.Arg143Ile | p.R143I | Q96E22 | protein_coding | deleterious(0) | probably_damaging(0.942) | TCGA-AA-3984-01 | Colorectum | colon adenocarcinoma | Female | <65 | I/II | Unknown | Unknown | SD | |
| NUS1 | SNV | Missense_Mutation | c.274N>T | p.Arg92Cys | p.R92C | Q96E22 | protein_coding | tolerated(0.08) | benign(0.005) | TCGA-AD-6964-01 | Colorectum | colon adenocarcinoma | Male | <65 | III/IV | Chemotherapy | folfox | PD | |
| NUS1 | SNV | Missense_Mutation | c.428N>T | p.Arg143Ile | p.R143I | Q96E22 | protein_coding | deleterious(0) | probably_damaging(0.942) | TCGA-CA-6718-01 | Colorectum | colon adenocarcinoma | Male | <65 | I/II | Unknown | Unknown | PD | |
| NUS1 | SNV | Missense_Mutation | c.670G>A | p.Asp224Asn | p.D224N | Q96E22 | protein_coding | tolerated(0.77) | benign(0.001) | TCGA-G4-6628-01 | Colorectum | colon adenocarcinoma | Male | >=65 | I/II | Unknown | Unknown | SD | |
| NUS1 | SNV | Missense_Mutation | c.454N>G | p.Ile152Val | p.I152V | Q96E22 | protein_coding | deleterious(0.04) | possibly_damaging(0.497) | TCGA-AG-4007-01 | Colorectum | rectum adenocarcinoma | Male | >=65 | III/IV | Unknown | Unknown | SD | |
| NUS1 | SNV | Missense_Mutation | c.428N>T | p.Arg143Ile | p.R143I | Q96E22 | protein_coding | deleterious(0) | probably_damaging(0.942) | TCGA-EI-6917-01 | Colorectum | rectum adenocarcinoma | Male | <65 | III/IV | Chemotherapy | 5fluorouracil+oxaciplatina+l-folinian | SD | |
| NUS1 | SNV | Missense_Mutation | novel | c.834N>A | p.Phe278Leu | p.F278L | Q96E22 | protein_coding | tolerated(0.46) | benign(0.026) | TCGA-EI-6917-01 | Colorectum | rectum adenocarcinoma | Male | <65 | III/IV | Chemotherapy | 5fluorouracil+oxaciplatina+l-folinian | SD |
| NUS1 | SNV | Missense_Mutation | novel | c.577N>A | p.Pro193Thr | p.P193T | Q96E22 | protein_coding | deleterious(0.01) | possibly_damaging(0.468) | TCGA-A5-A0G2-01 | Endometrium | uterine corpus endometrioid carcinoma | Female | <65 | III/IV | Unknown | Unknown | SD |
| NUS1 | SNV | Missense_Mutation | novel | c.379N>A | p.Val127Met | p.V127M | Q96E22 | protein_coding | tolerated(0.2) | possibly_damaging(0.766) | TCGA-A5-A2K7-01 | Endometrium | uterine corpus endometrioid carcinoma | Female | <65 | I/II | Chemotherapy | taxol | SD |
| Page: 1 2 |
Top |
Related drugs of malignant transformation related genes |
| Identification of chemicals and drugs interact with genes involved in malignant transfromation |
| (DGIdb 4.0) |
| Entrez ID | Symbol | Category | Interaction Types | Drug Claim Name | Drug Name | PMIDs |
| Page: 1 |

Copyright 2023-Present -The University of Texas Health Science Center at Houston |