Schematic overview of the cellular and molecular mechanisms involved in the cancer progression, including the proposed cellular and molecular mechanisms in cancer cells trajectory. AT1: alveolar type 1 cells; AT2: alveolar type 2 cells; AAH: atypical adenomatous hyperplasia; AIS: adenocarcinoma in situ; MIA: minimally invasive adenocarcinoma; IA: invasive adenocarcinoma; EMT: epithelial-mesenchymal transition

Home

Download

Statistics

Help

Contact

Center for Computational Systems Medicine
leaf

Gene summary

leaf

Malignant transformation analysis

leaf

Malignant transformation related pathway analysis

leaf

Cell-cell communication analysis

leaf

Single-cell gene regulatory network inference analysis

leaf

Somatic mutation of malignant transformation related genes

leaf

Related drugs of malignant transformation related genes

Gene: NUDT5

Gene summary for NUDT5

check button Gene summary.

Gene informationSpeciesHuman
Gene symbol

NUDT5

Gene ID

11164

Gene namenudix hydrolase 5
Gene AliasYSA1
Cytomap10p14
Gene Typeprotein-coding
GO ID

GO:0005975

UniProtAcc

Q9UKK9


Top

Malignant transformation analysis

check button Identification of the aberrant gene expression in precancerous and cancerous lesions by comparing the gene expression of stem-like cells in diseased tissues with normal stem cells
check button Malignant transformation involving gene list.
Entrez IDSymbolReplicatesSpeciesOrganTissueAdj P-valueLog2FCMalignancy
11164NUDT5GSM4909281HumanBreastIDC2.25e-123.50e-010.21
11164NUDT5GSM4909282HumanBreastIDC3.96e-326.23e-01-0.0288
11164NUDT5GSM4909285HumanBreastIDC1.56e-649.29e-010.21
11164NUDT5GSM4909290HumanBreastIDC4.02e-032.75e-010.2096
11164NUDT5GSM4909297HumanBreastIDC7.72e-05-5.59e-020.1517
11164NUDT5GSM4909311HumanBreastIDC8.65e-10-1.11e-010.1534
11164NUDT5GSM4909312HumanBreastIDC5.06e-047.90e-020.1552
11164NUDT5GSM4909319HumanBreastIDC4.44e-13-5.36e-020.1563
11164NUDT5GSM4909321HumanBreastIDC2.53e-03-1.25e-020.1559
11164NUDT5brca1HumanBreastPrecancer1.90e-113.42e-01-0.0338
11164NUDT5brca2HumanBreastPrecancer5.57e-102.70e-01-0.024
11164NUDT5M2HumanBreastIDC1.33e-033.94e-010.21
11164NUDT5P1HumanBreastIDC8.57e-05-5.81e-020.1527
11164NUDT5P2HumanBreastIDC5.57e-033.02e-010.21
11164NUDT5DCIS2HumanBreastDCIS1.83e-357.09e-020.0085
11164NUDT5LZE2THumanEsophagusESCC3.69e-065.74e-010.082
11164NUDT5LZE4THumanEsophagusESCC3.58e-146.36e-010.0811
11164NUDT5LZE5THumanEsophagusESCC1.31e-036.16e-010.0514
11164NUDT5LZE7THumanEsophagusESCC4.31e-044.98e-010.0667
11164NUDT5LZE8THumanEsophagusESCC7.32e-154.30e-010.067
Page: 1 2 3 4 5 6 7 8 

check button Transcriptomic changes along malignancy continuum.
TissueExpression DynamicsAbbreviation
BreastThe image shows the transcriptomic changes along malignancy continuum.log2FC in expression of this searched gene in stem-like cells from each diseased tissue sample relative to stem-like cells in normal samples in each tissue plotted against the malignancy continuum. Samples are colored based on if they are from different disease stage.
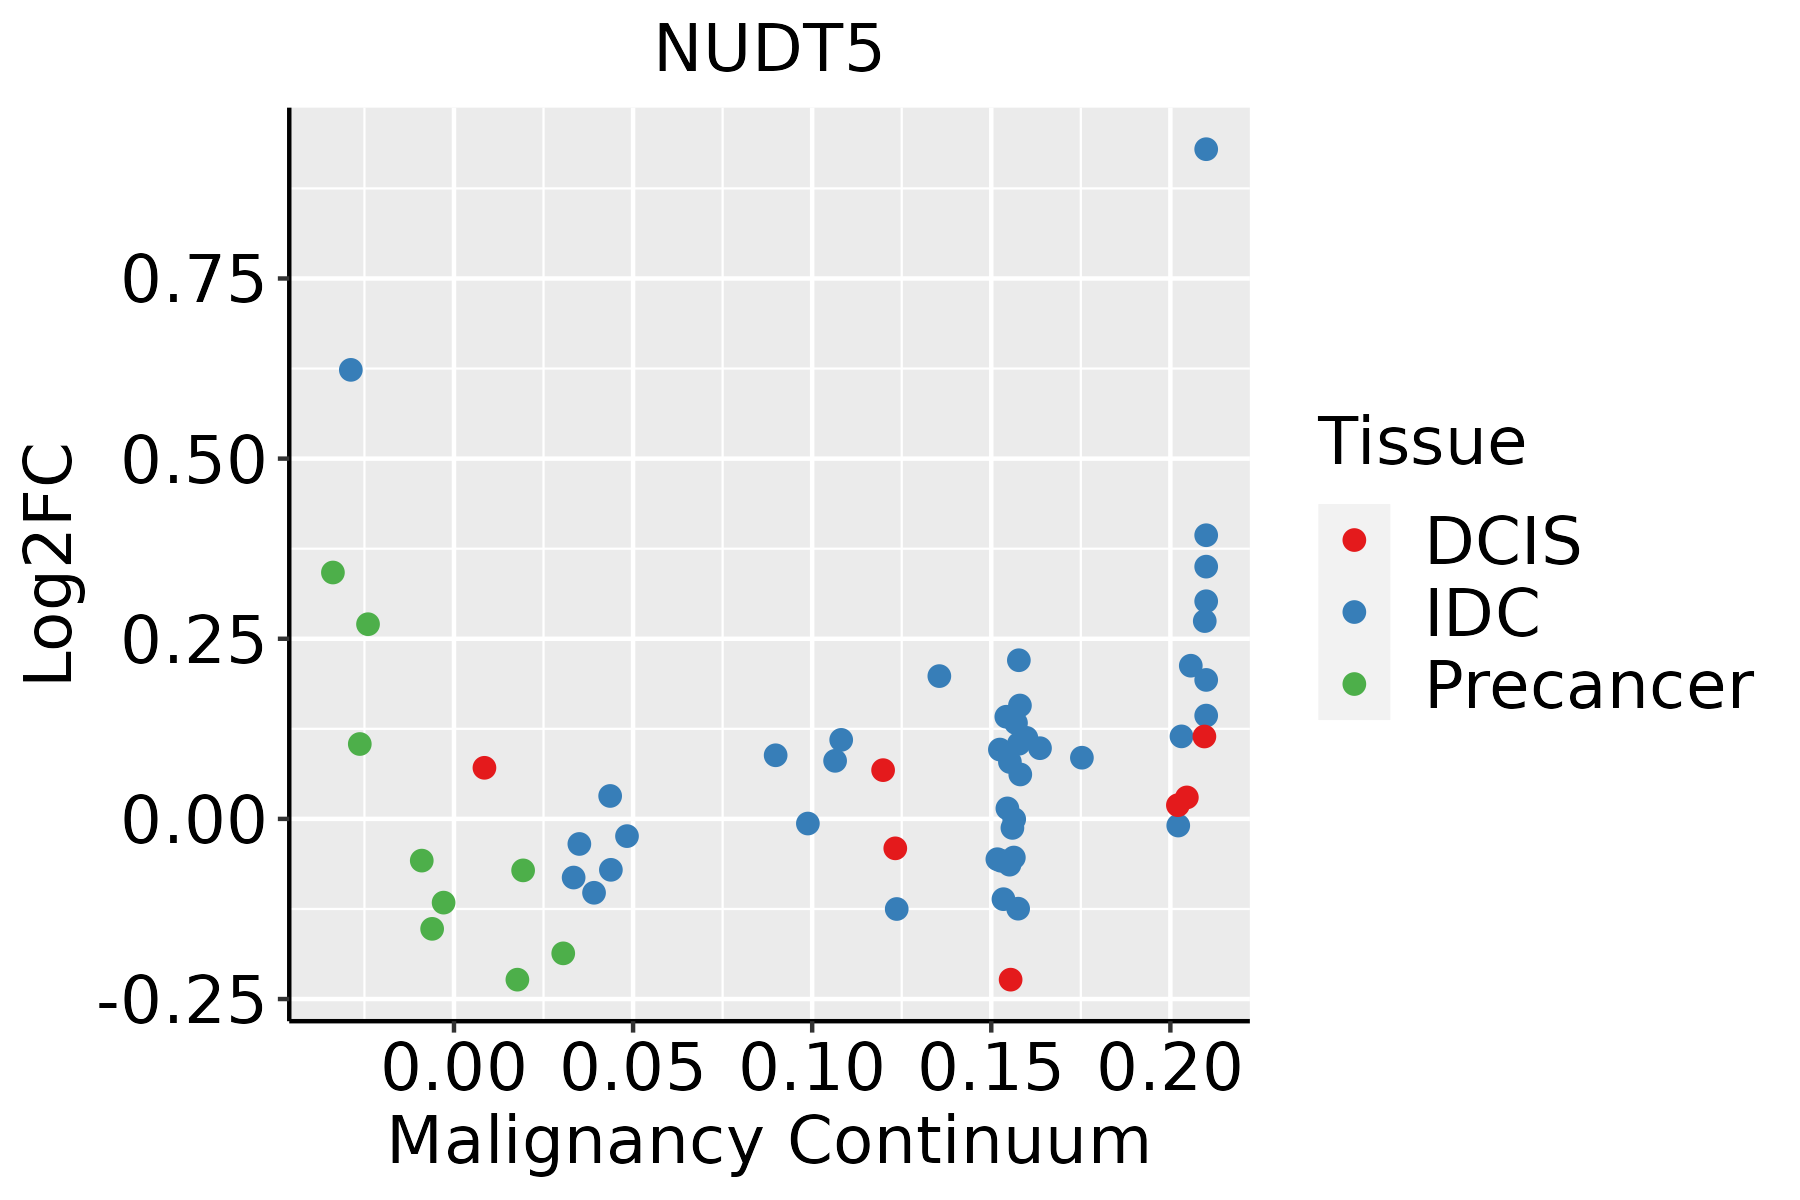
IDC: Invasive ductal carcinoma
DCIS: Ductal carcinoma in situ
Precancer(BRCA1-mut): Precancerous lesion from BRCA1 mutation carriers
EsophagusThe image shows the transcriptomic changes along malignancy continuum.log2FC in expression of this searched gene in stem-like cells from each diseased tissue sample relative to stem-like cells in normal samples in each tissue plotted against the malignancy continuum. Samples are colored based on if they are from different disease stage.
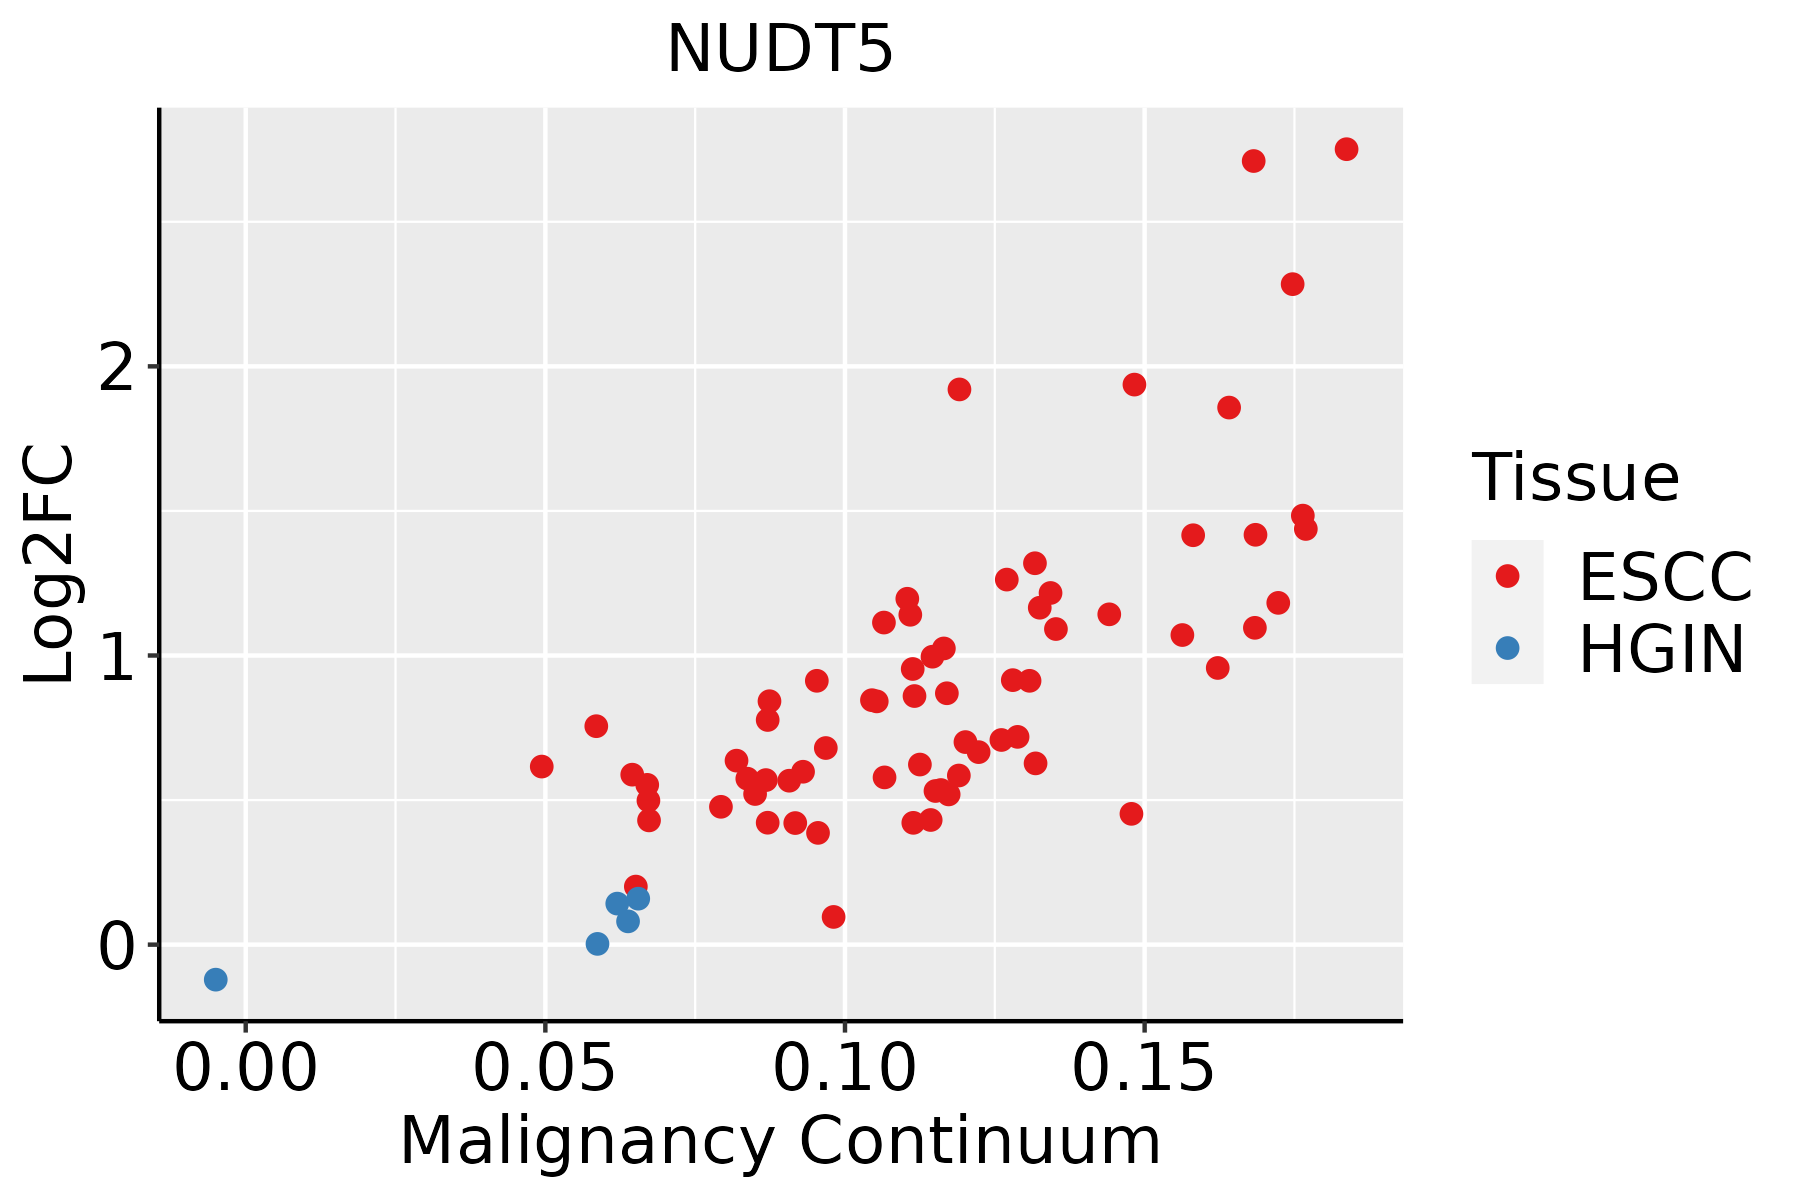
ESCC: Esophageal squamous cell carcinoma
HGIN: High-grade intraepithelial neoplasias
LGIN: Low-grade intraepithelial neoplasias
LiverThe image shows the transcriptomic changes along malignancy continuum.log2FC in expression of this searched gene in stem-like cells from each diseased tissue sample relative to stem-like cells in normal samples in each tissue plotted against the malignancy continuum. Samples are colored based on if they are from different disease stage.HCC: Hepatocellular carcinoma
NAFLD: Non-alcoholic fatty liver disease
Oral CavityThe image shows the transcriptomic changes along malignancy continuum.log2FC in expression of this searched gene in stem-like cells from each diseased tissue sample relative to stem-like cells in normal samples in each tissue plotted against the malignancy continuum. Samples are colored based on if they are from different disease stage.EOLP: Erosive Oral lichen planus
LP: leukoplakia
NEOLP: Non-erosive oral lichen planus
OSCC: Oral squamous cell carcinoma
SkinThe image shows the transcriptomic changes along malignancy continuum.log2FC in expression of this searched gene in stem-like cells from each diseased tissue sample relative to stem-like cells in normal samples in each tissue plotted against the malignancy continuum. Samples are colored based on if they are from different disease stage.AK: Actinic keratosis
cSCC: Cutaneous squamous cell carcinoma
SCCIS:squamous cell carcinoma in situ
ThyroidThe image shows the transcriptomic changes along malignancy continuum.log2FC in expression of this searched gene in stem-like cells from each diseased tissue sample relative to stem-like cells in normal samples in each tissue plotted against the malignancy continuum. Samples are colored based on if they are from different disease stage.
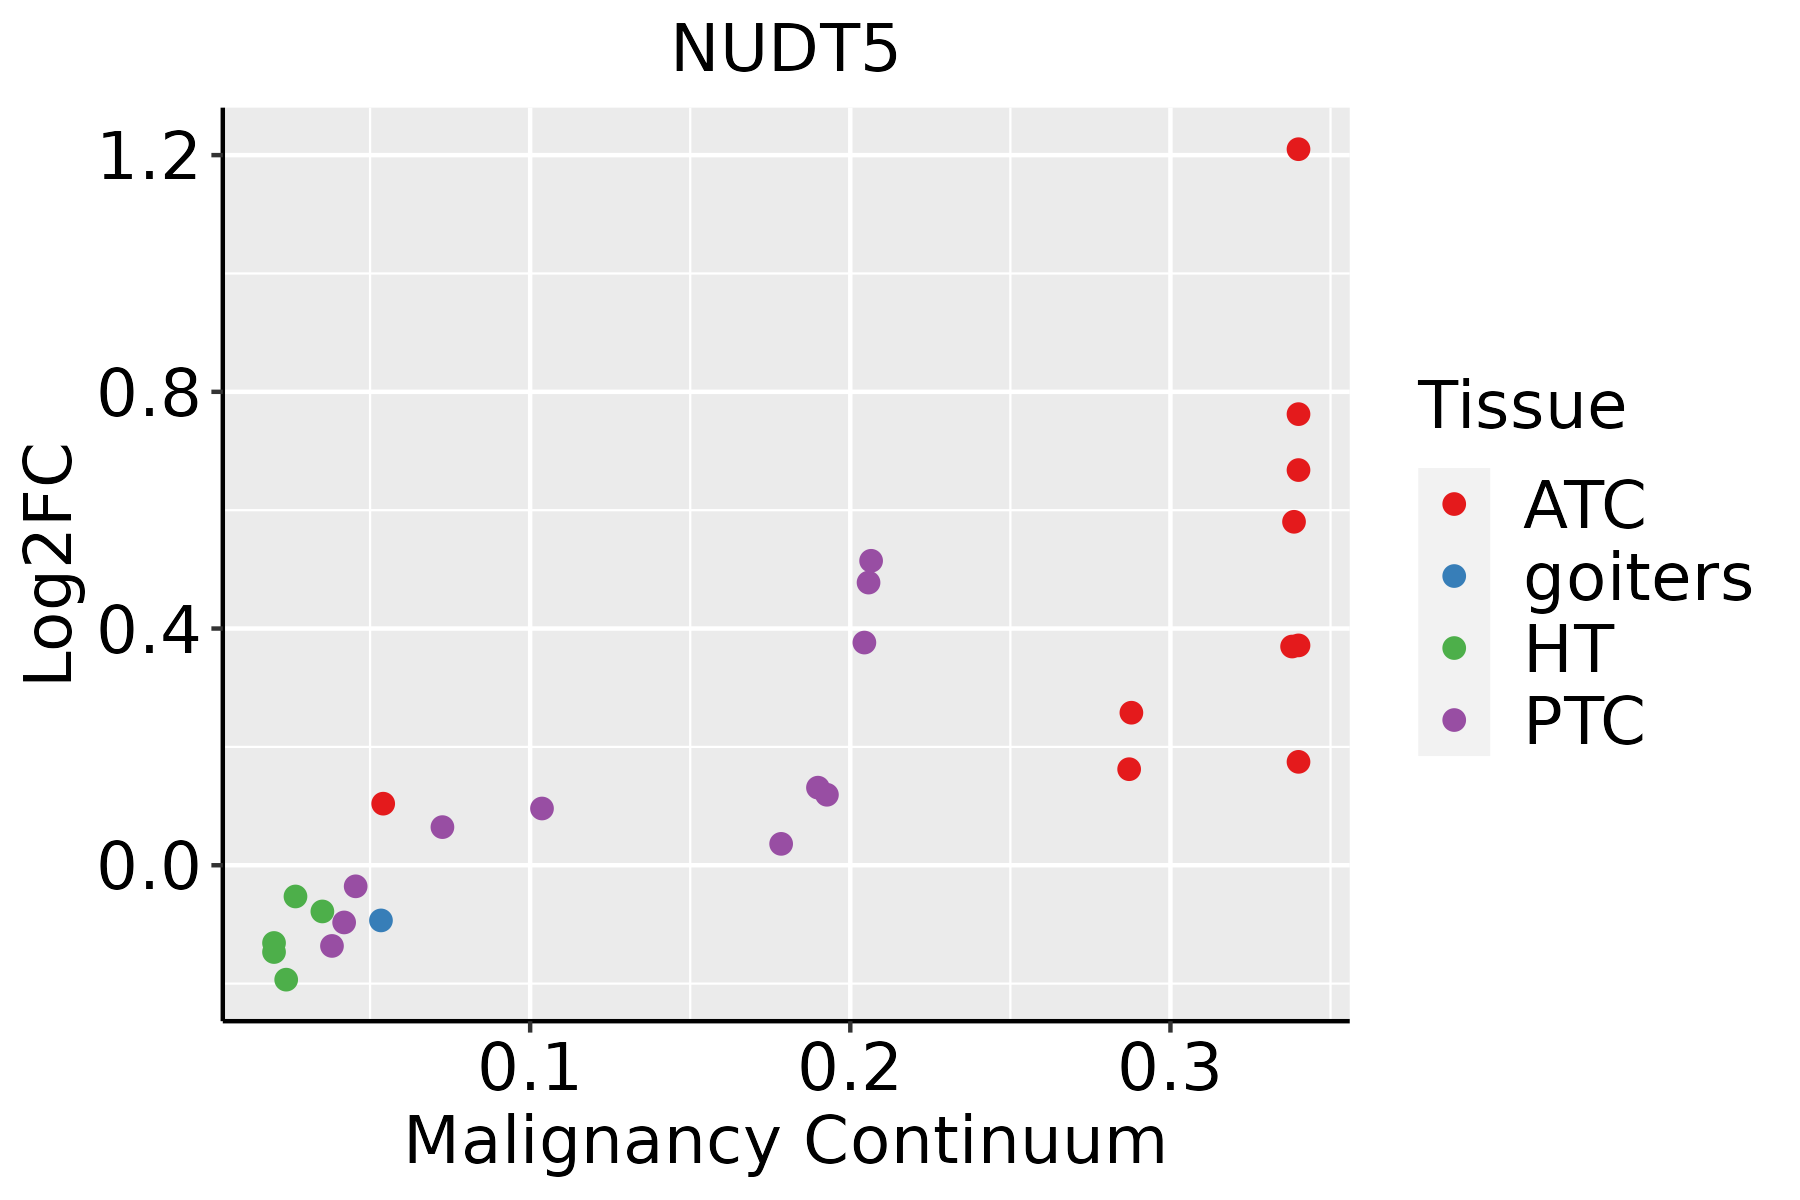
ATC: Anaplastic thyroid cancer
HT: Hashimoto's thyroiditis
PTC: Papillary thyroid cancer
∗log2FC in expression of this searched gene in stem-like cells from each diseased tissue sample relative to stem-like cells in normal samples in each tissue plotted against the malignancy continuum. Samples are colored based on if they are from different disease stage.

Top

Malignant transformation related pathway analysis

check buttonFind out the enriched GO biological processes and KEGG pathways involved in transition from healthy to precancer to cancer
check button Figure of enriched GO biological processes.
TissueDisease StageEnriched GO biological Processes
ColorectumADGO analysis - Figure of enriched GO biological processes: Top 15 enriched GO BP terms are showed in the bar plot of each disease state in each tissue. Each row represents a significant GO biological process which is colored according to the -log10(p.adjust).
ColorectumSERGO analysis - Figure of enriched GO biological processes: Top 15 enriched GO BP terms are showed in the bar plot of each disease state in each tissue. Each row represents a significant GO biological process which is colored according to the -log10(p.adjust).
ColorectumMSSGO analysis - Figure of enriched GO biological processes: Top 15 enriched GO BP terms are showed in the bar plot of each disease state in each tissue. Each row represents a significant GO biological process which is colored according to the -log10(p.adjust).
ColorectumMSI-HGO analysis - Figure of enriched GO biological processes: Top 15 enriched GO BP terms are showed in the bar plot of each disease state in each tissue. Each row represents a significant GO biological process which is colored according to the -log10(p.adjust).
ColorectumFAPGO analysis - Figure of enriched GO biological processes: Top 15 enriched GO BP terms are showed in the bar plot of each disease state in each tissue. Each row represents a significant GO biological process which is colored according to the -log10(p.adjust).
∗Top 15 enriched GO BP terms are showed in the bar plot of each disease state in each tissue. Each row represents a significant GO biological process which is colored according to the -log10(p.adjust).
Page: 1 2 3 4 5 6 7 8 9 

check button Enriched GO biological processes.
GO IDTissueDisease StageDescriptionGene RatioBg Ratiopvaluep.adjustCount
GO:19012921LiverHCCnucleoside phosphate catabolic process49/795883/187231.73e-039.02e-0349
GO:003465517Oral cavityOSCCnucleobase-containing compound catabolic process244/7305407/187235.38e-185.49e-16244
GO:004670015Oral cavityOSCCheterocycle catabolic process254/7305445/187235.07e-153.31e-13254
GO:004427016Oral cavityOSCCcellular nitrogen compound catabolic process256/7305451/187239.67e-155.88e-13256
GO:001943915Oral cavityOSCCaromatic compound catabolic process263/7305467/187231.49e-148.84e-13263
GO:190136115Oral cavityOSCCorganic cyclic compound catabolic process272/7305495/187232.73e-131.36e-11272
GO:004603420Oral cavityOSCCATP metabolic process166/7305277/187231.16e-125.12e-11166
GO:000675318Oral cavityOSCCnucleoside phosphate metabolic process247/7305497/187236.28e-078.96e-06247
GO:000911719Oral cavityOSCCnucleotide metabolic process243/7305489/187237.80e-071.09e-05243
GO:001969319Oral cavityOSCCribose phosphate metabolic process199/7305396/187232.97e-063.64e-05199
GO:000913217Oral cavityOSCCnucleoside diphosphate metabolic process70/7305124/187236.03e-054.95e-0470
GO:00059968Oral cavityOSCCmonosaccharide metabolic process129/7305257/187231.63e-041.13e-03129
GO:000918518Oral cavityOSCCribonucleoside diphosphate metabolic process60/7305106/187231.78e-041.21e-0360
GO:000632510Oral cavityOSCCchromatin organization190/7305409/187231.17e-035.97e-03190
GO:00442826Oral cavityOSCCsmall molecule catabolic process174/7305376/187232.25e-031.00e-02174
GO:001605210Oral cavityOSCCcarbohydrate catabolic process76/7305154/187235.67e-032.18e-0276
GO:0046034110Oral cavityLPATP metabolic process128/4623277/187233.95e-155.38e-13128
GO:003465518Oral cavityLPnucleobase-containing compound catabolic process161/4623407/187231.61e-111.15e-09161
GO:001943916Oral cavityLParomatic compound catabolic process176/4623467/187231.96e-101.08e-08176
GO:004427017Oral cavityLPcellular nitrogen compound catabolic process170/4623451/187233.93e-102.02e-08170
Page: 1 2 3 4 5 6 7 8 9 

check button Enriched KEGG pathways.
Pathway IDTissueDisease StageDescriptionGene RatioBg Ratiopvaluep.adjustqvalueCount
Page: 1 

Top

Cell-cell communication analysis

check buttonIdentification of potential cell-cell interactions between two cell types and their ligand-receptor pairs for different disease states
LigandReceptorLRpairPathwayTissueDisease Stage
Page: 1 

Top

Single-cell gene regulatory network inference analysis

check buttonFind out the significant the regulons (TFs) and the target genes of each regulon across cell types for different disease states
TFCell TypeTissueDisease StageTarget GeneRSSRegulon Activity
∗The dot plots of a searched regulon are shown for all cell subpopulations in each disease state of each tissue based on the regulon specific score inferred using pySCENIC and by calculating the average expression.
Page: 1 

Top

Somatic mutation of malignant transformation related genes

check buttonAnnotation of somatic variants for genes involved in malignant transformation
Hugo SymbolVariant ClassVariant ClassificationdbSNP RSHGVScHGVSpHGVSp ShortSWISSPROTBIOTYPESIFTPolyPhenTumor Sample BarcodeTissueHistologySexAgeStageTherapy TypesDrugsOutcome
NUDT5SNVMissense_Mutationc.307N>Ap.Glu103Lysp.E103KQ9UKK9protein_codingdeleterious(0)probably_damaging(0.997)TCGA-A2-A0CT-01Breastbreast invasive carcinomaFemale>=65I/IIChemotherapycytoxanSD
NUDT5insertionFrame_Shift_Insnovelc.202_203insACCCTGCCGTCTCCAGCCTTTTGAGTAATTGCCCp.Leu68HisfsTer19p.L68Hfs*19Q9UKK9protein_codingTCGA-AN-A0FV-01Breastbreast invasive carcinomaFemale<65I/IIUnknownUnknownSD
NUDT5deletionFrame_Shift_Delnovelc.490delGp.Asp164MetfsTer23p.D164Mfs*23Q9UKK9protein_codingTCGA-EW-A2FV-01Breastbreast invasive carcinomaFemale<65III/IVChemotherapydocetaxelSD
NUDT5SNVMissense_Mutationc.439N>Gp.Thr147Alap.T147AQ9UKK9protein_codingtolerated(0.61)benign(0.017)TCGA-G4-6588-01Colorectumcolon adenocarcinomaFemale<65I/IIUnknownUnknownSD
NUDT5SNVMissense_Mutationrs755821025c.151N>Tp.Arg51Cysp.R51CQ9UKK9protein_codingdeleterious(0)probably_damaging(0.965)TCGA-A5-A0G2-01Endometriumuterine corpus endometrioid carcinomaFemale<65III/IVUnknownUnknownSD
NUDT5SNVMissense_Mutationnovelc.611N>Gp.Leu204Argp.L204RQ9UKK9protein_codingdeleterious(0)probably_damaging(0.998)TCGA-A5-A1OF-01Endometriumuterine corpus endometrioid carcinomaFemale<65I/IIUnknownUnknownSD
NUDT5SNVMissense_Mutationc.472N>Ap.Pro158Thrp.P158TQ9UKK9protein_codingdeleterious(0)probably_damaging(0.993)TCGA-AP-A051-01Endometriumuterine corpus endometrioid carcinomaFemale>=65I/IIUnknownUnknownSD
NUDT5SNVMissense_Mutationnovelc.626N>Ap.Ala209Glup.A209EQ9UKK9protein_codingtolerated_low_confidence(1)benign(0)TCGA-AP-A0LM-01Endometriumuterine corpus endometrioid carcinomaFemale<65III/IVChemotherapycisplatinSD
NUDT5SNVMissense_Mutationnovelc.116C>Tp.Pro39Leup.P39LQ9UKK9protein_codingdeleterious(0)possibly_damaging(0.8)TCGA-AP-A1DV-01Endometriumuterine corpus endometrioid carcinomaFemale<65I/IIUnknownUnknownSD
NUDT5SNVMissense_Mutationrs755821025c.151N>Tp.Arg51Cysp.R51CQ9UKK9protein_codingdeleterious(0)probably_damaging(0.965)TCGA-AX-A05Z-01Endometriumuterine corpus endometrioid carcinomaFemale<65III/IVChemotherapyadriamycinSD
Page: 1 2 3 

Top

Related drugs of malignant transformation related genes

check buttonIdentification of chemicals and drugs interact with genes involved in malignant transfromation
(DGIdb 4.0)
Entrez IDSymbolCategoryInteraction TypesDrug Claim NameDrug NamePMIDs
Page: 1