| Tissue | Expression Dynamics | Abbreviation |
| Esophagus | 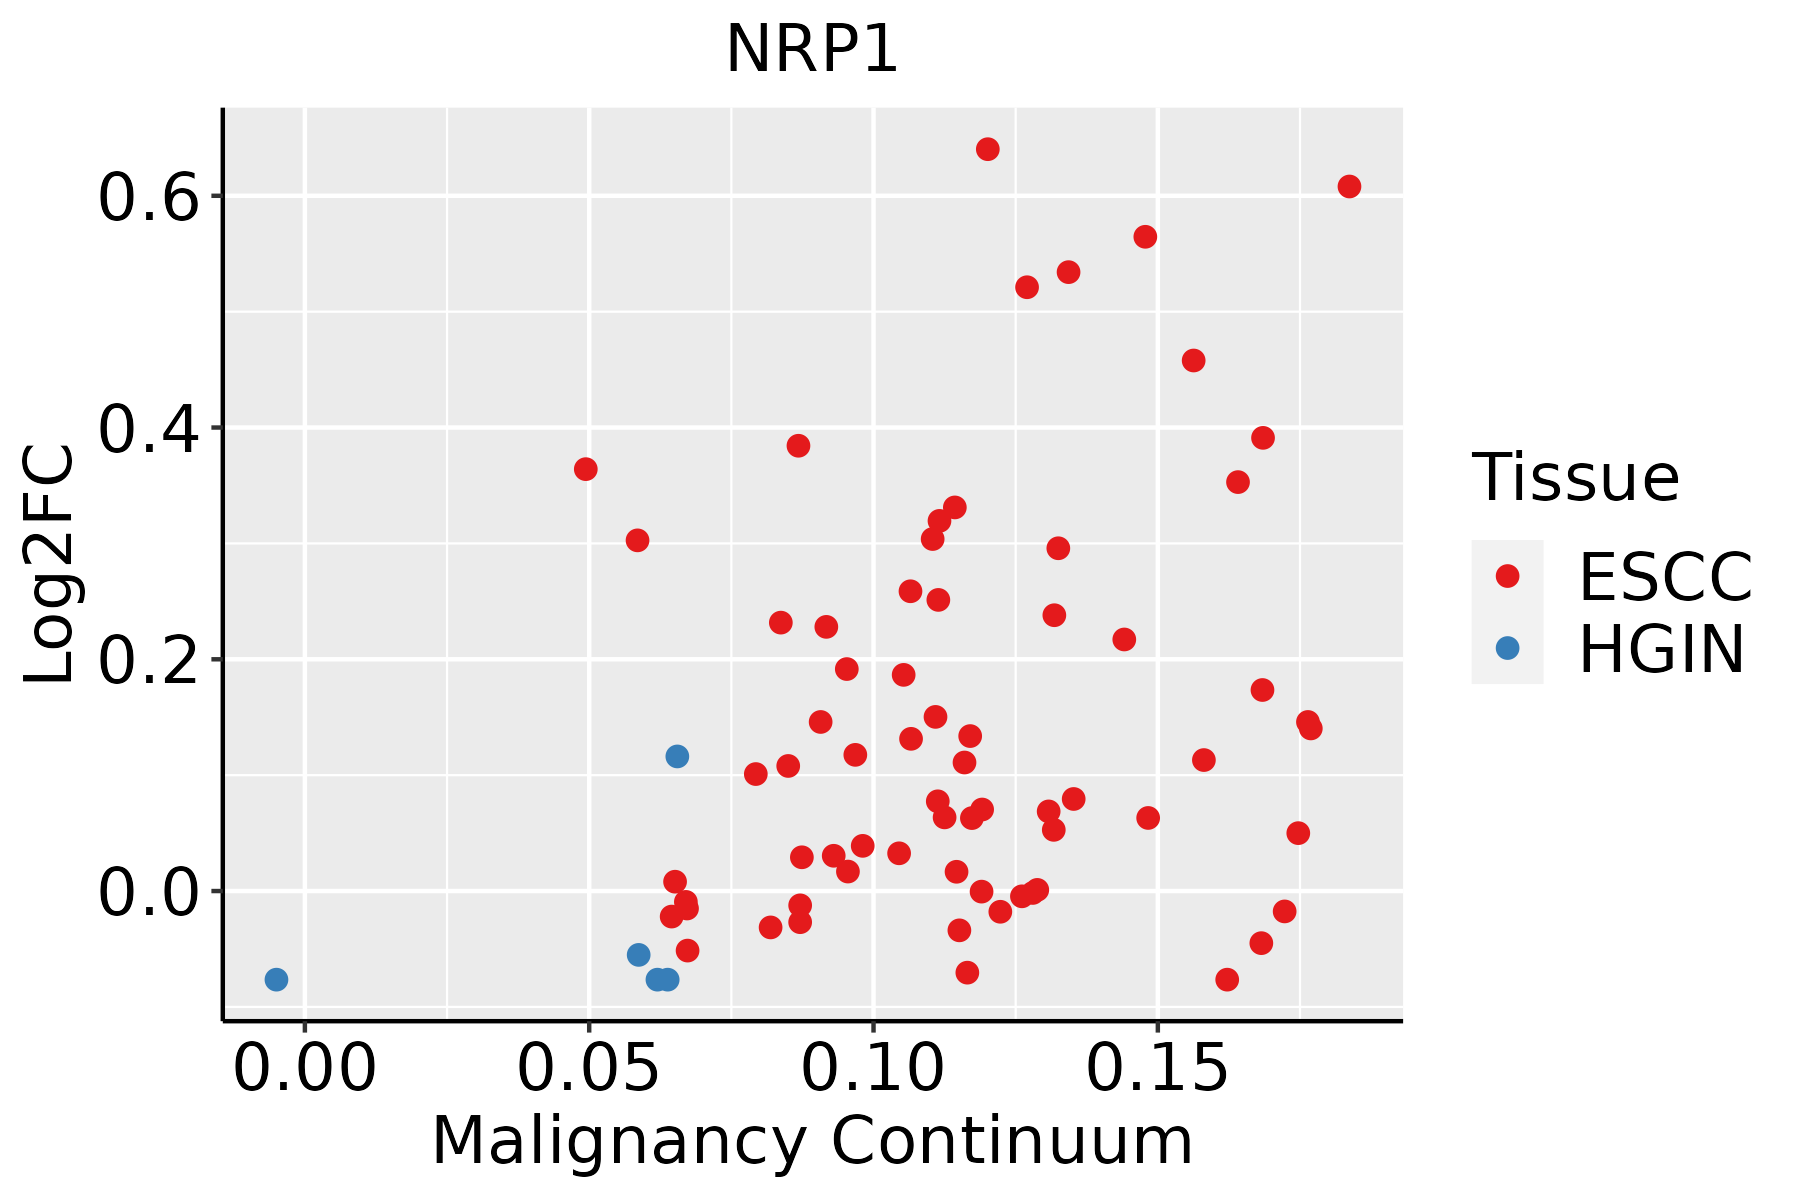 | ESCC: Esophageal squamous cell carcinoma |
| HGIN: High-grade intraepithelial neoplasias |
| LGIN: Low-grade intraepithelial neoplasias |
| Liver | 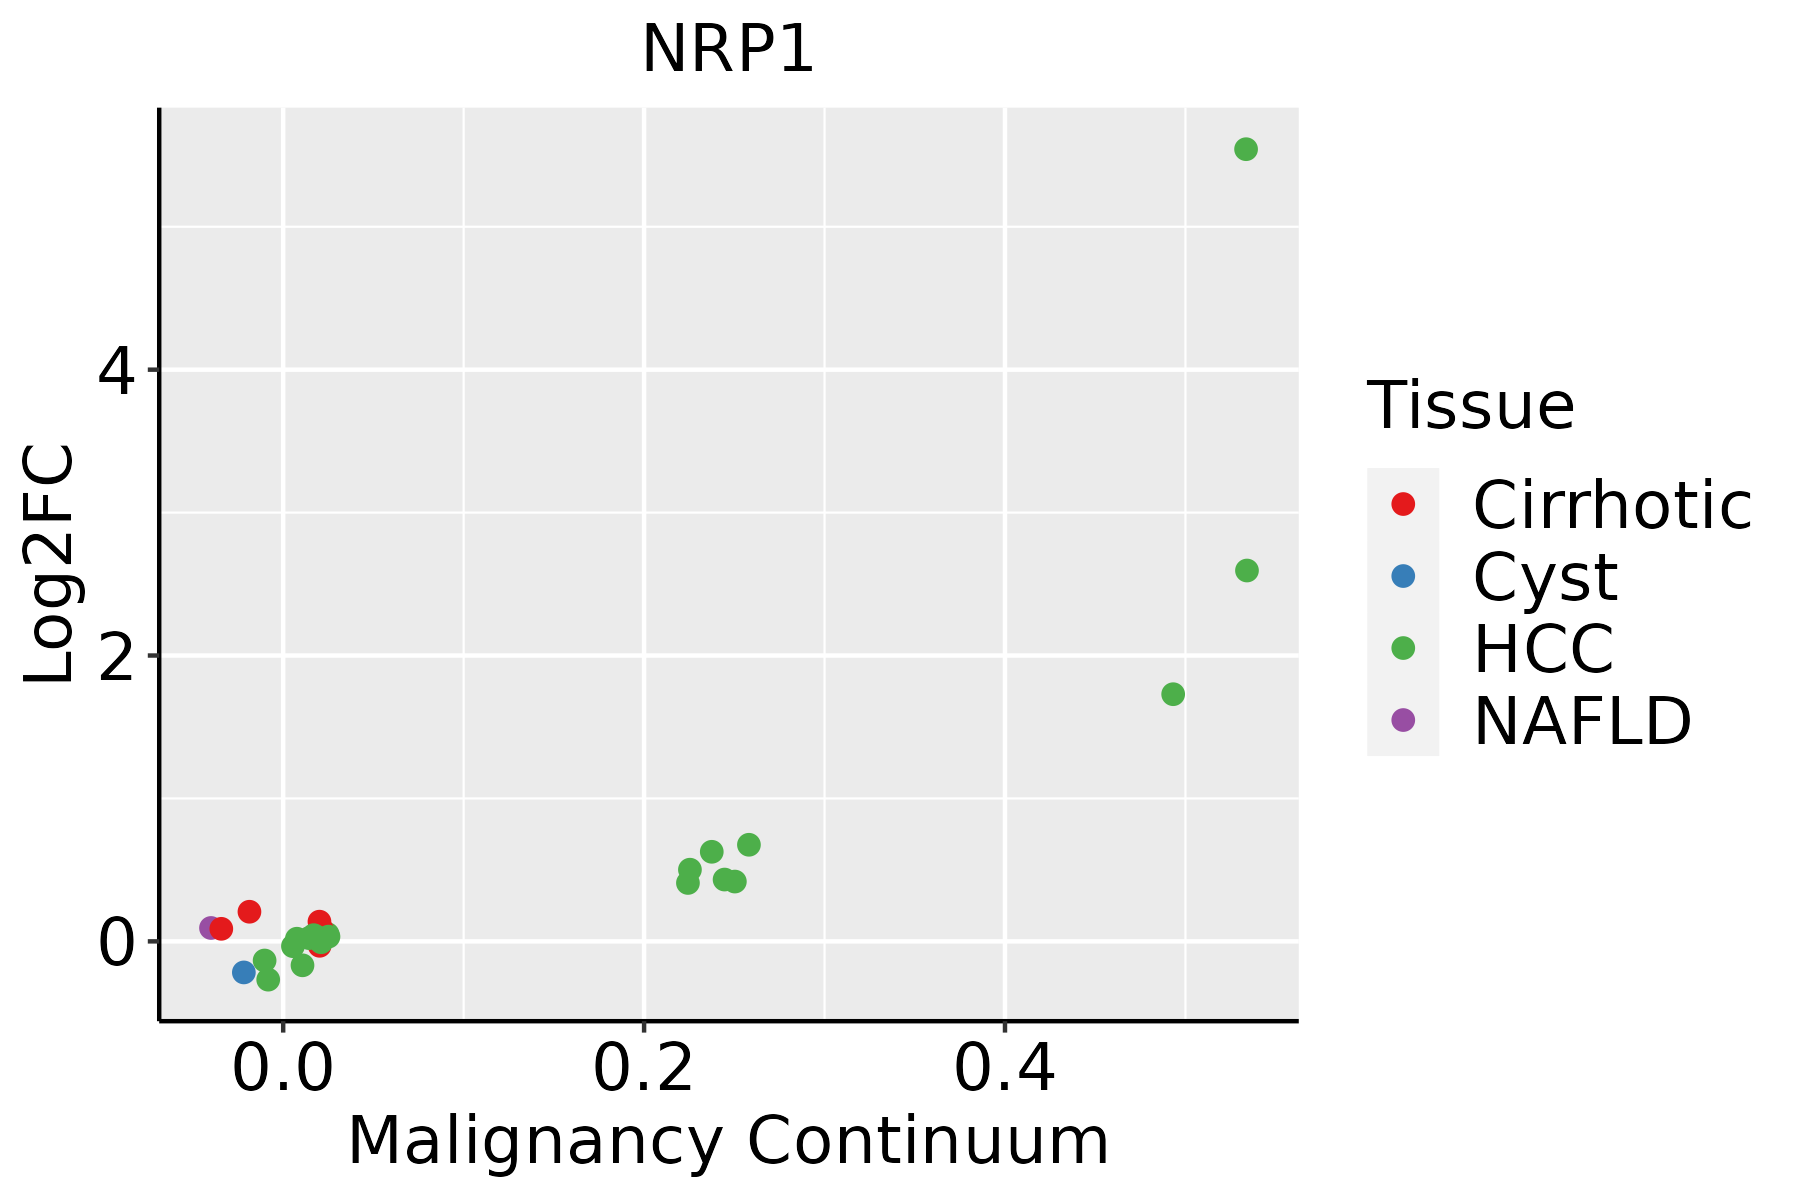 | HCC: Hepatocellular carcinoma |
| NAFLD: Non-alcoholic fatty liver disease |
| Lung | 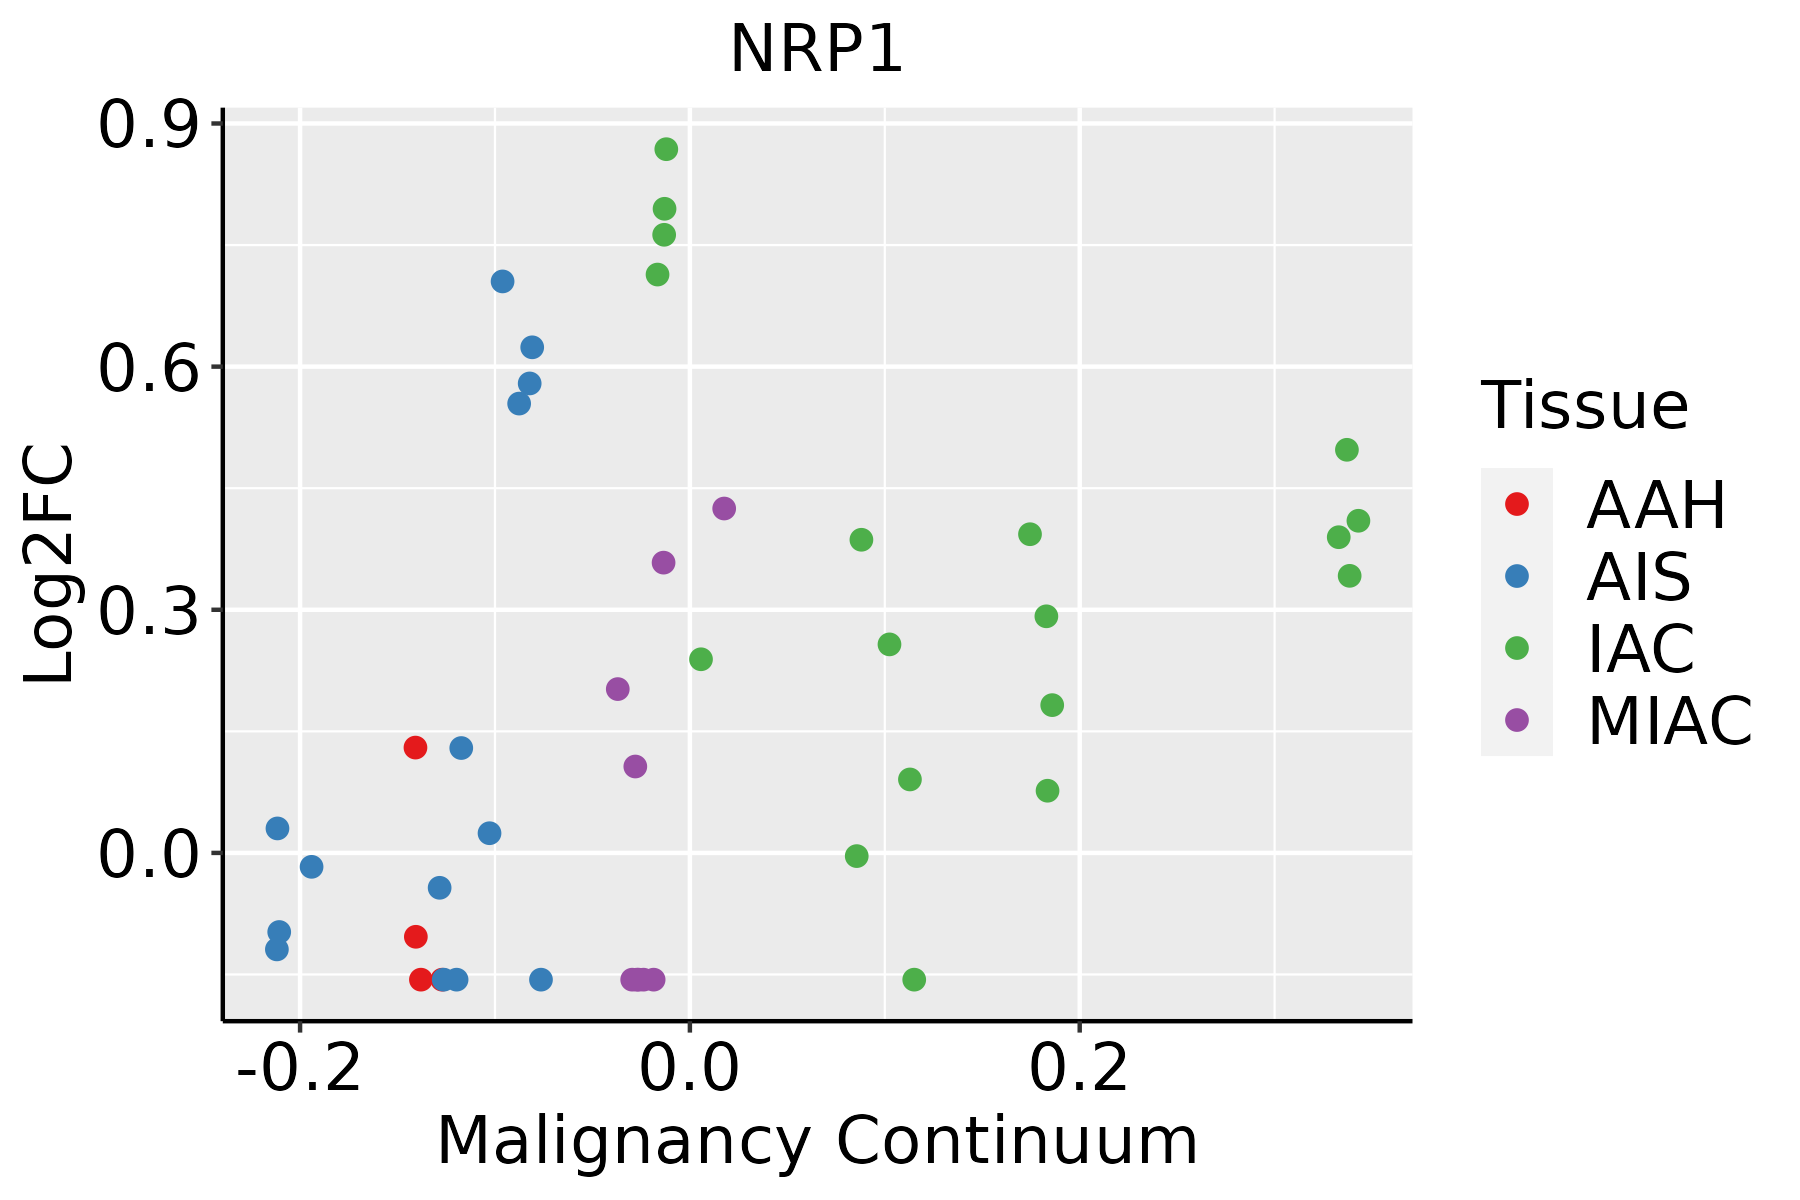 | AAH: Atypical adenomatous hyperplasia |
| AIS: Adenocarcinoma in situ |
| IAC: Invasive lung adenocarcinoma |
| MIA: Minimally invasive adenocarcinoma |
| Prostate |  | BPH: Benign Prostatic Hyperplasia |
| Thyroid | 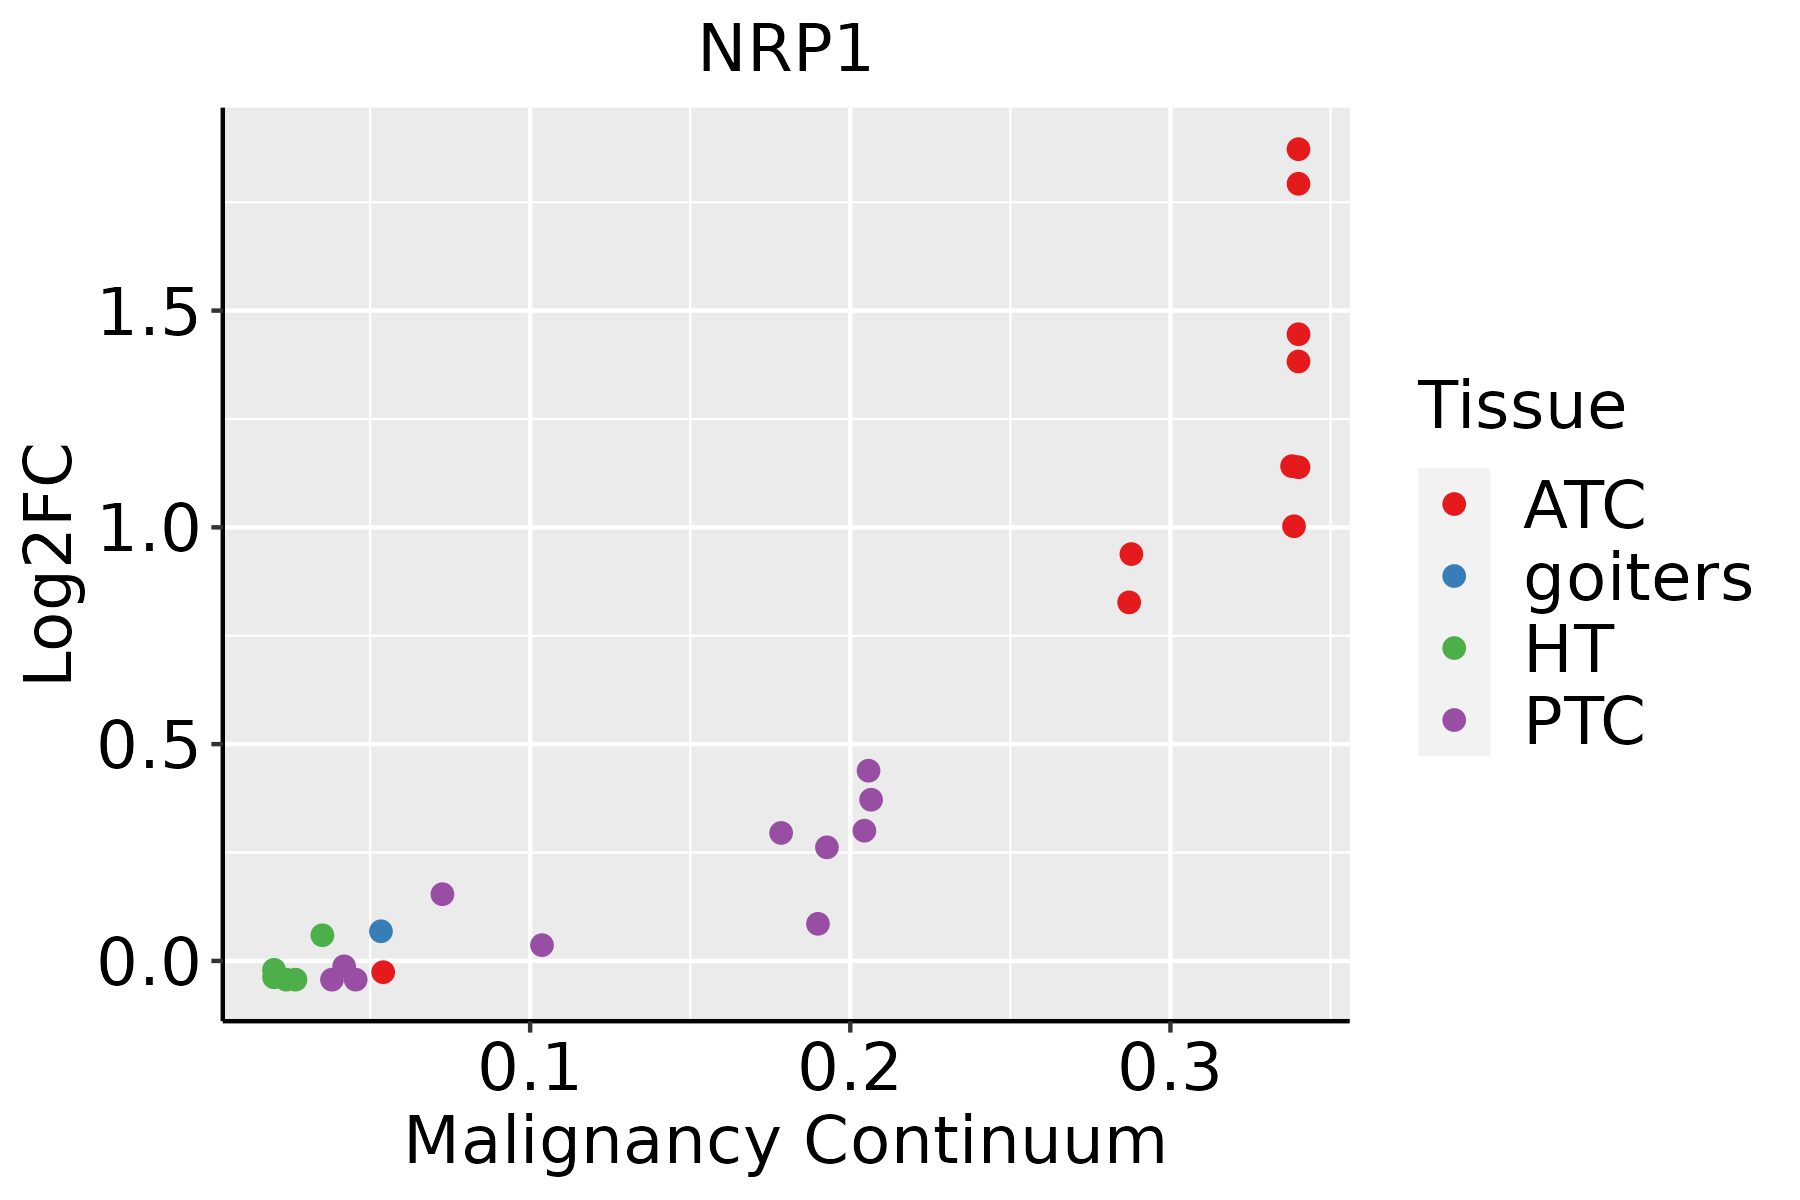 | ATC: Anaplastic thyroid cancer |
| HT: Hashimoto's thyroiditis |
| PTC: Papillary thyroid cancer |
| GO ID | Tissue | Disease Stage | Description | Gene Ratio | Bg Ratio | pvalue | p.adjust | Count |
| GO:00069294 | Esophagus | ESCC | substrate-dependent cell migration | 17/8552 | 23/18723 | 5.73e-03 | 2.13e-02 | 17 |
| GO:001063120 | Esophagus | ESCC | epithelial cell migration | 187/8552 | 357/18723 | 6.05e-03 | 2.23e-02 | 187 |
| GO:20002497 | Esophagus | ESCC | regulation of actin cytoskeleton reorganization | 26/8552 | 39/18723 | 6.63e-03 | 2.43e-02 | 26 |
| GO:009013220 | Esophagus | ESCC | epithelium migration | 188/8552 | 360/18723 | 6.96e-03 | 2.54e-02 | 188 |
| GO:005149610 | Esophagus | ESCC | positive regulation of stress fiber assembly | 33/8552 | 52/18723 | 7.38e-03 | 2.65e-02 | 33 |
| GO:00016559 | Esophagus | ESCC | urogenital system development | 177/8552 | 338/18723 | 7.51e-03 | 2.69e-02 | 177 |
| GO:009013020 | Esophagus | ESCC | tissue migration | 190/8552 | 365/18723 | 7.91e-03 | 2.82e-02 | 190 |
| GO:001635816 | Esophagus | ESCC | dendrite development | 130/8552 | 243/18723 | 8.33e-03 | 2.95e-02 | 130 |
| GO:004544610 | Esophagus | ESCC | endothelial cell differentiation | 67/8552 | 118/18723 | 9.86e-03 | 3.40e-02 | 67 |
| GO:004858810 | Esophagus | ESCC | developmental cell growth | 125/8552 | 234/18723 | 1.01e-02 | 3.46e-02 | 125 |
| GO:000315818 | Esophagus | ESCC | endothelium development | 76/8552 | 136/18723 | 1.05e-02 | 3.59e-02 | 76 |
| GO:00017639 | Esophagus | ESCC | morphogenesis of a branching structure | 106/8552 | 196/18723 | 1.08e-02 | 3.66e-02 | 106 |
| GO:004592717 | Esophagus | ESCC | positive regulation of growth | 137/8552 | 259/18723 | 1.13e-02 | 3.80e-02 | 137 |
| GO:00518948 | Esophagus | ESCC | positive regulation of focal adhesion assembly | 19/8552 | 28/18723 | 1.49e-02 | 4.84e-02 | 19 |
| GO:190188810 | Esophagus | ESCC | regulation of cell junction assembly | 109/8552 | 204/18723 | 1.53e-02 | 4.96e-02 | 109 |
| GO:005105610 | Esophagus | ESCC | regulation of small GTPase mediated signal transduction | 157/8552 | 302/18723 | 1.55e-02 | 4.98e-02 | 157 |
| GO:001603212 | Liver | Cirrhotic | viral process | 203/4634 | 415/18723 | 5.40e-27 | 3.76e-24 | 203 |
| GO:200123312 | Liver | Cirrhotic | regulation of apoptotic signaling pathway | 163/4634 | 356/18723 | 2.62e-18 | 4.43e-16 | 163 |
| GO:001905812 | Liver | Cirrhotic | viral life cycle | 148/4634 | 317/18723 | 1.12e-17 | 1.64e-15 | 148 |
| GO:004440312 | Liver | Cirrhotic | biological process involved in symbiotic interaction | 131/4634 | 290/18723 | 2.00e-14 | 1.84e-12 | 131 |
| Pathway ID | Tissue | Disease Stage | Description | Gene Ratio | Bg Ratio | pvalue | p.adjust | qvalue | Count |
| hsa05166211 | Esophagus | ESCC | Human T-cell leukemia virus 1 infection | 164/4205 | 222/8465 | 8.13e-14 | 2.09e-12 | 1.07e-12 | 164 |
| hsa05171211 | Esophagus | ESCC | Coronavirus disease - COVID-19 | 156/4205 | 232/8465 | 3.18e-08 | 2.68e-07 | 1.37e-07 | 156 |
| hsa0436016 | Esophagus | ESCC | Axon guidance | 108/4205 | 182/8465 | 5.13e-03 | 1.30e-02 | 6.67e-03 | 108 |
| hsa05166310 | Esophagus | ESCC | Human T-cell leukemia virus 1 infection | 164/4205 | 222/8465 | 8.13e-14 | 2.09e-12 | 1.07e-12 | 164 |
| hsa05171310 | Esophagus | ESCC | Coronavirus disease - COVID-19 | 156/4205 | 232/8465 | 3.18e-08 | 2.68e-07 | 1.37e-07 | 156 |
| hsa0436017 | Esophagus | ESCC | Axon guidance | 108/4205 | 182/8465 | 5.13e-03 | 1.30e-02 | 6.67e-03 | 108 |
| hsa0517122 | Liver | Cirrhotic | Coronavirus disease - COVID-19 | 136/2530 | 232/8465 | 3.28e-20 | 1.82e-18 | 1.12e-18 | 136 |
| hsa0516614 | Liver | Cirrhotic | Human T-cell leukemia virus 1 infection | 87/2530 | 222/8465 | 1.69e-03 | 8.01e-03 | 4.94e-03 | 87 |
| hsa0517132 | Liver | Cirrhotic | Coronavirus disease - COVID-19 | 136/2530 | 232/8465 | 3.28e-20 | 1.82e-18 | 1.12e-18 | 136 |
| hsa0516615 | Liver | Cirrhotic | Human T-cell leukemia virus 1 infection | 87/2530 | 222/8465 | 1.69e-03 | 8.01e-03 | 4.94e-03 | 87 |
| hsa0517142 | Liver | HCC | Coronavirus disease - COVID-19 | 167/4020 | 232/8465 | 1.50e-14 | 4.19e-13 | 2.33e-13 | 167 |
| hsa0516622 | Liver | HCC | Human T-cell leukemia virus 1 infection | 139/4020 | 222/8465 | 3.17e-06 | 2.79e-05 | 1.55e-05 | 139 |
| hsa0517152 | Liver | HCC | Coronavirus disease - COVID-19 | 167/4020 | 232/8465 | 1.50e-14 | 4.19e-13 | 2.33e-13 | 167 |
| hsa0516632 | Liver | HCC | Human T-cell leukemia virus 1 infection | 139/4020 | 222/8465 | 3.17e-06 | 2.79e-05 | 1.55e-05 | 139 |
| hsa0517116 | Lung | IAC | Coronavirus disease - COVID-19 | 102/1053 | 232/8465 | 5.89e-34 | 1.91e-31 | 1.27e-31 | 102 |
| hsa0516616 | Lung | IAC | Human T-cell leukemia virus 1 infection | 49/1053 | 222/8465 | 3.44e-05 | 6.38e-04 | 4.24e-04 | 49 |
| hsa043608 | Lung | IAC | Axon guidance | 34/1053 | 182/8465 | 9.31e-03 | 3.62e-02 | 2.41e-02 | 34 |
| hsa0517117 | Lung | IAC | Coronavirus disease - COVID-19 | 102/1053 | 232/8465 | 5.89e-34 | 1.91e-31 | 1.27e-31 | 102 |
| hsa0516617 | Lung | IAC | Human T-cell leukemia virus 1 infection | 49/1053 | 222/8465 | 3.44e-05 | 6.38e-04 | 4.24e-04 | 49 |
| hsa0436011 | Lung | IAC | Axon guidance | 34/1053 | 182/8465 | 9.31e-03 | 3.62e-02 | 2.41e-02 | 34 |
| Hugo Symbol | Variant Class | Variant Classification | dbSNP RS | HGVSc | HGVSp | HGVSp Short | SWISSPROT | BIOTYPE | SIFT | PolyPhen | Tumor Sample Barcode | Tissue | Histology | Sex | Age | Stage | Therapy Types | Drugs | Outcome |
| NRP1 | SNV | Missense_Mutation | | c.1447N>A | p.Glu483Lys | p.E483K | O14786 | protein_coding | deleterious(0.02) | probably_damaging(0.933) | TCGA-A2-A0SY-01 | Breast | breast invasive carcinoma | Female | <65 | III/IV | Hormone Therapy | arimidex | SD |
| NRP1 | SNV | Missense_Mutation | | c.1591N>A | p.Asp531Asn | p.D531N | O14786 | protein_coding | deleterious(0.03) | probably_damaging(0.947) | TCGA-A8-A075-01 | Breast | breast invasive carcinoma | Female | <65 | I/II | Chemotherapy | epirubicin | CR |
| NRP1 | SNV | Missense_Mutation | | c.1756G>A | p.Glu586Lys | p.E586K | O14786 | protein_coding | tolerated(0.41) | possibly_damaging(0.458) | TCGA-AC-A23H-01 | Breast | breast invasive carcinoma | Female | >=65 | I/II | Unknown | Unknown | PD |
| NRP1 | SNV | Missense_Mutation | | c.878C>T | p.Ala293Val | p.A293V | O14786 | protein_coding | tolerated(0.06) | benign(0.02) | TCGA-AO-A0J3-01 | Breast | breast invasive carcinoma | Female | >=65 | I/II | Chemotherapy | cyclophosphamide | SD |
| NRP1 | SNV | Missense_Mutation | | c.2588N>T | p.Ala863Val | p.A863V | O14786 | protein_coding | tolerated(0.5) | possibly_damaging(0.841) | TCGA-E9-A1R7-01 | Breast | breast invasive carcinoma | Female | <65 | I/II | Hormone Therapy | fareston | SD |
| NRP1 | insertion | Nonsense_Mutation | novel | c.1004_1005insCTAATCAAAAGATTTCGGAGAATTCATACTCACCATCTCCCAGAA | p.Phe335_Val336insTer | p.F335_V336ins* | O14786 | protein_coding | | | TCGA-A8-A06X-01 | Breast | breast invasive carcinoma | Female | >=65 | I/II | Unknown | Unknown | SD |
| NRP1 | insertion | In_Frame_Ins | novel | c.2660_2661insAAAGCCCTGCTCTTTAATCAAACTCTGGTGGCC | p.Gly887_Met888insLysProCysSerLeuIleLysLeuTrpTrpPro | p.G887_M888insKPCSLIKLWWP | O14786 | protein_coding | | | TCGA-AN-A0FX-01 | Breast | breast invasive carcinoma | Female | <65 | I/II | Unknown | Unknown | SD |
| NRP1 | insertion | In_Frame_Ins | novel | c.2083_2084insTTTGTAATACACAGGGCACAGTCTCTTGCCTCAAAG | p.Ser695delinsPheCysAsnThrGlnGlyThrValSerCysLeuLysAla | p.S695delinsFCNTQGTVSCLKA | O14786 | protein_coding | | | TCGA-AO-A0J9-01 | Breast | breast invasive carcinoma | Female | <65 | III/IV | Chemotherapy | cyclophosphamide | PD |
| NRP1 | insertion | Frame_Shift_Ins | novel | c.724_725insCAGTGGTTTGGTTGTGGAAGATGCTGGGGGAAGCCAGTATGTTT | p.Ile242ThrfsTer27 | p.I242Tfs*27 | O14786 | protein_coding | | | TCGA-AQ-A04J-01 | Breast | breast invasive carcinoma | Female | <65 | I/II | Chemotherapy | cytoxan | SD |
| NRP1 | SNV | Missense_Mutation | novel | c.2522A>C | p.Lys841Thr | p.K841T | O14786 | protein_coding | tolerated(0.62) | benign(0.109) | TCGA-2W-A8YY-01 | Cervix | cervical & endocervical cancer | Female | <65 | I/II | Chemotherapy | cisplatin | CR |


