
|
|||||
|
 | |
| |
| |
| |
| |
| |
|
Gene: NPHP3 |
Gene summary for NPHP3 |
| Gene information | Species | Human | Gene symbol | NPHP3 | Gene ID | 27031 |
| Gene name | nephrocystin 3 | |
| Gene Alias | CFAP31 | |
| Cytomap | 3q22.1 | |
| Gene Type | protein-coding | GO ID | GO:0001655 | UniProtAcc | Q7Z494 |
Top |
Malignant transformation analysis |
| Identification of the aberrant gene expression in precancerous and cancerous lesions by comparing the gene expression of stem-like cells in diseased tissues with normal stem cells |
| Entrez ID | Symbol | Replicates | Species | Organ | Tissue | Adj P-value | Log2FC | Malignancy |
| 27031 | NPHP3 | HTA11_3410_2000001011 | Human | Colorectum | AD | 5.90e-11 | 2.46e-01 | 0.0155 |
| 27031 | NPHP3 | HTA11_2487_2000001011 | Human | Colorectum | SER | 6.13e-19 | 4.62e-01 | -0.1808 |
| 27031 | NPHP3 | HTA11_2951_2000001011 | Human | Colorectum | AD | 3.22e-05 | 3.36e-01 | 0.0216 |
| 27031 | NPHP3 | HTA11_1938_2000001011 | Human | Colorectum | AD | 4.60e-24 | 6.33e-01 | -0.0811 |
| 27031 | NPHP3 | HTA11_78_2000001011 | Human | Colorectum | AD | 7.85e-13 | 3.92e-01 | -0.1088 |
| 27031 | NPHP3 | HTA11_347_2000001011 | Human | Colorectum | AD | 5.98e-43 | 7.58e-01 | -0.1954 |
| 27031 | NPHP3 | HTA11_411_2000001011 | Human | Colorectum | SER | 1.86e-06 | 3.68e-01 | -0.2602 |
| 27031 | NPHP3 | HTA11_2112_2000001011 | Human | Colorectum | SER | 1.71e-03 | 3.67e-01 | -0.2196 |
| 27031 | NPHP3 | HTA11_3361_2000001011 | Human | Colorectum | AD | 9.32e-14 | 3.99e-01 | -0.1207 |
| 27031 | NPHP3 | HTA11_83_2000001011 | Human | Colorectum | SER | 2.45e-18 | 4.88e-01 | -0.1526 |
| 27031 | NPHP3 | HTA11_696_2000001011 | Human | Colorectum | AD | 9.02e-22 | 3.75e-01 | -0.1464 |
| 27031 | NPHP3 | HTA11_866_2000001011 | Human | Colorectum | AD | 3.10e-42 | 6.75e-01 | -0.1001 |
| 27031 | NPHP3 | HTA11_1391_2000001011 | Human | Colorectum | AD | 5.12e-18 | 4.15e-01 | -0.059 |
| 27031 | NPHP3 | HTA11_2992_2000001011 | Human | Colorectum | SER | 1.72e-05 | 3.33e-01 | -0.1706 |
| 27031 | NPHP3 | HTA11_5216_2000001011 | Human | Colorectum | SER | 2.49e-08 | 4.15e-01 | -0.1462 |
| 27031 | NPHP3 | HTA11_546_2000001011 | Human | Colorectum | AD | 4.31e-15 | 5.06e-01 | -0.0842 |
| 27031 | NPHP3 | HTA11_9341_2000001011 | Human | Colorectum | SER | 1.35e-12 | 6.00e-01 | -0.00410000000000005 |
| 27031 | NPHP3 | HTA11_7862_2000001011 | Human | Colorectum | AD | 4.04e-16 | 6.27e-01 | -0.0179 |
| 27031 | NPHP3 | HTA11_866_3004761011 | Human | Colorectum | AD | 1.22e-19 | 3.85e-01 | 0.096 |
| 27031 | NPHP3 | HTA11_4255_2000001011 | Human | Colorectum | SER | 1.84e-10 | 5.85e-01 | 0.0446 |
| Page: 1 2 3 |
| Tissue | Expression Dynamics | Abbreviation |
| Colorectum (GSE201348) |  | FAP: Familial adenomatous polyposis |
| CRC: Colorectal cancer | ||
| Colorectum (HTA11) |  | AD: Adenomas |
| SER: Sessile serrated lesions | ||
| MSI-H: Microsatellite-high colorectal cancer | ||
| MSS: Microsatellite stable colorectal cancer | ||
| Liver | 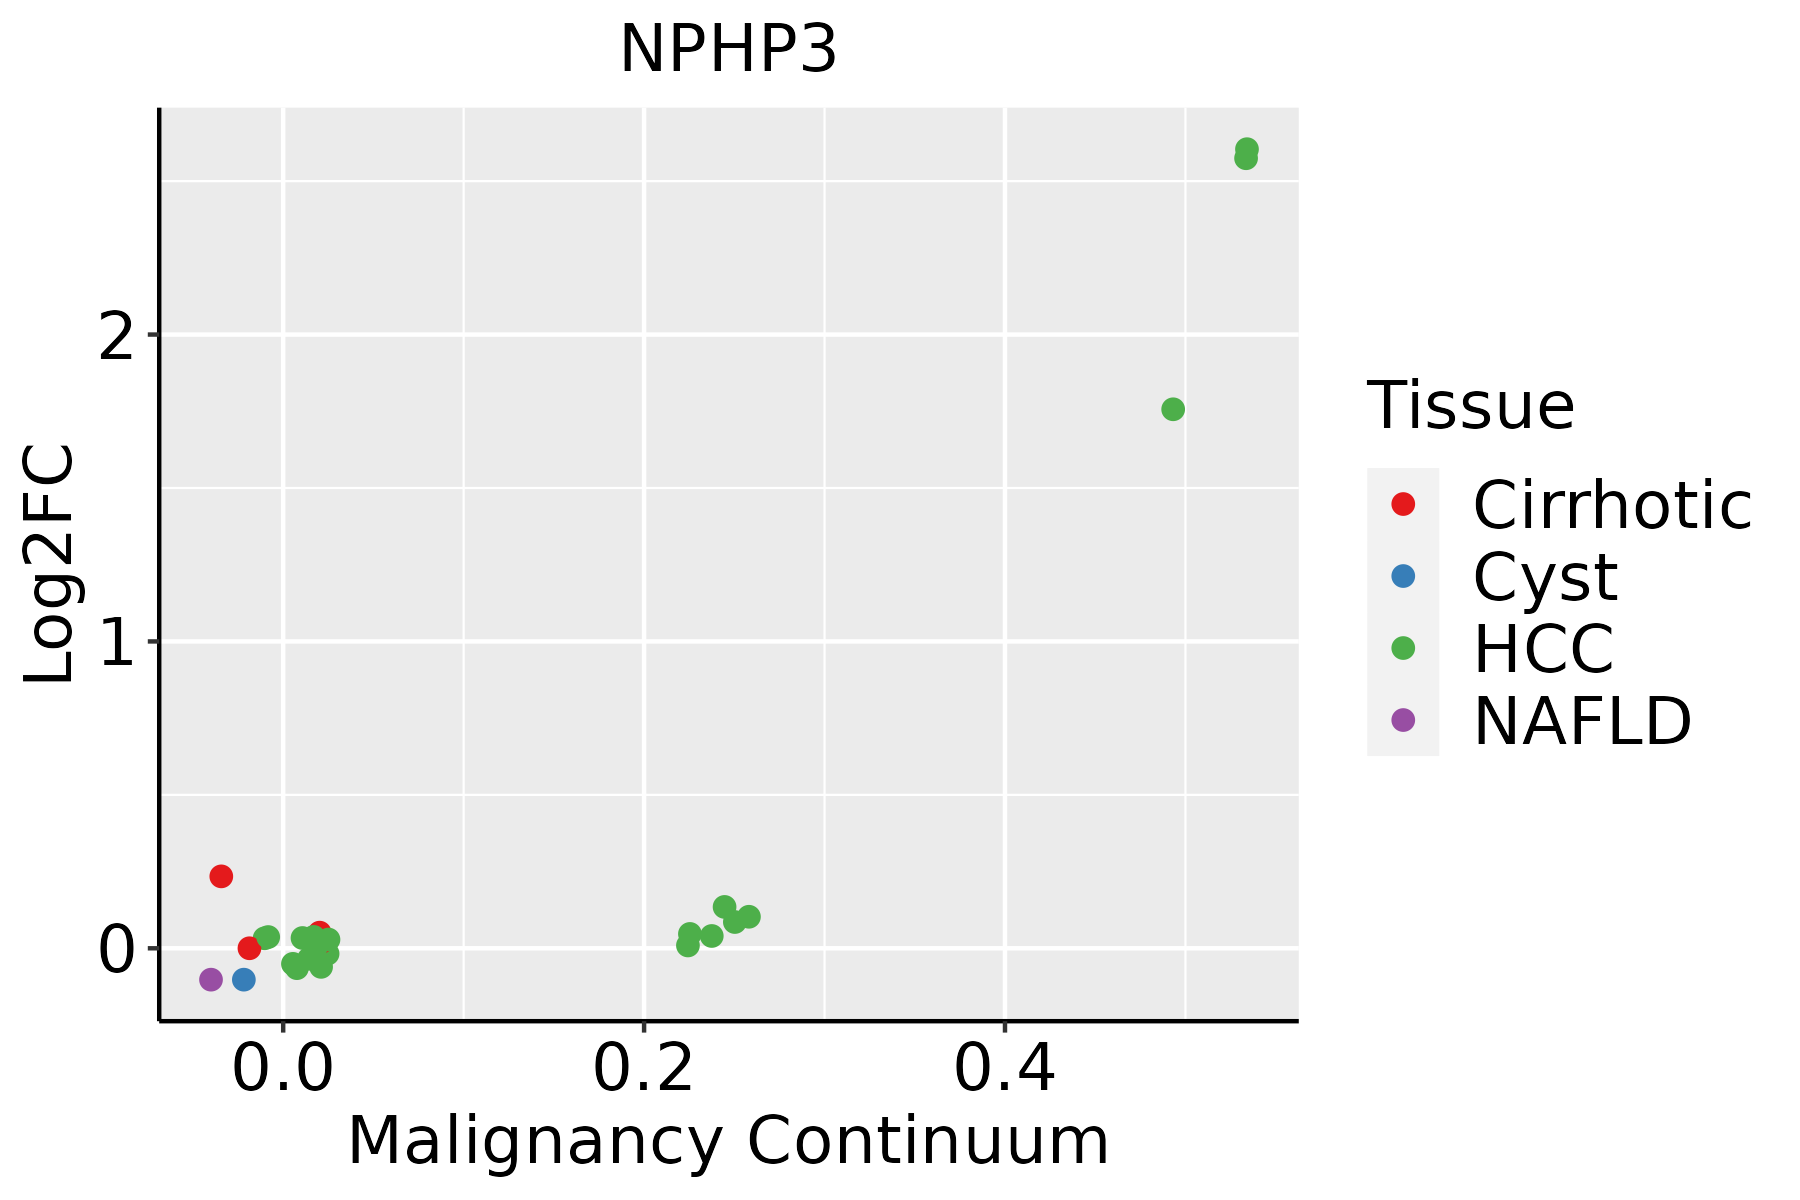 | HCC: Hepatocellular carcinoma |
| NAFLD: Non-alcoholic fatty liver disease | ||
| Thyroid | 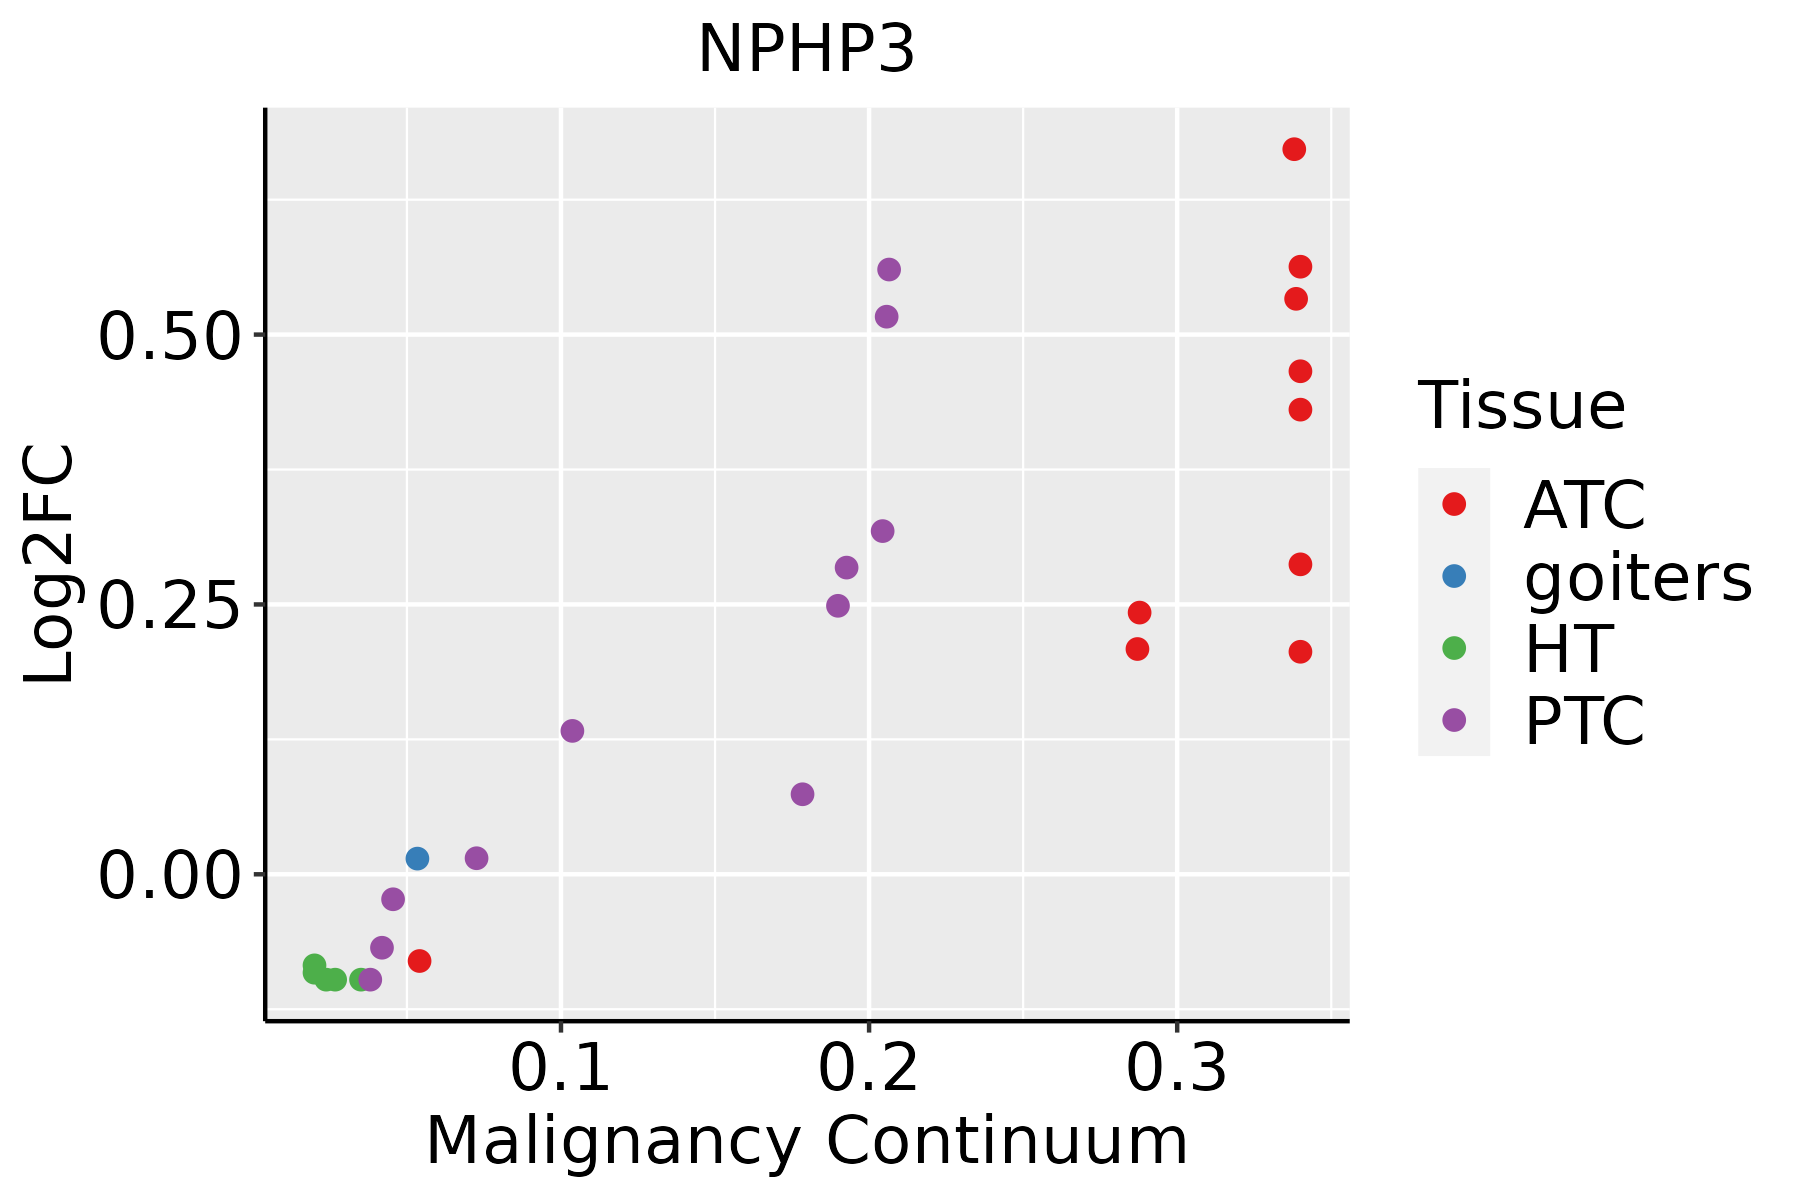 | ATC: Anaplastic thyroid cancer |
| HT: Hashimoto's thyroiditis | ||
| PTC: Papillary thyroid cancer |
| ∗log2FC in expression of this searched gene in stem-like cells from each diseased tissue sample relative to stem-like cells in normal samples in each tissue plotted against the malignancy continuum. Samples are colored based on if they are from different disease stage. |
Top |
Malignant transformation related pathway analysis |
| Find out the enriched GO biological processes and KEGG pathways involved in transition from healthy to precancer to cancer |
| Tissue | Disease Stage | Enriched GO biological Processes |
| Colorectum | AD |  |
| Colorectum | SER |  |
| Colorectum | MSS |  |
| Colorectum | MSI-H |  |
| Colorectum | FAP |  |
| ∗Top 15 enriched GO BP terms are showed in the bar plot of each disease state in each tissue. Each row represents a significant GO biological process which is colored according to the -log10(p.adjust). |
| Page: 1 2 3 4 5 6 7 8 9 |
| GO ID | Tissue | Disease Stage | Description | Gene Ratio | Bg Ratio | pvalue | p.adjust | Count |
| GO:000184310 | Thyroid | PTC | neural tube closure | 49/5968 | 88/18723 | 3.24e-06 | 4.20e-05 | 49 |
| GO:00606069 | Thyroid | PTC | tube closure | 49/5968 | 89/18723 | 4.99e-06 | 6.08e-05 | 49 |
| GO:003514819 | Thyroid | PTC | tube formation | 73/5968 | 148/18723 | 7.04e-06 | 8.31e-05 | 73 |
| GO:006056219 | Thyroid | PTC | epithelial tube morphogenesis | 141/5968 | 325/18723 | 7.52e-06 | 8.73e-05 | 141 |
| GO:007217515 | Thyroid | PTC | epithelial tube formation | 66/5968 | 132/18723 | 1.08e-05 | 1.19e-04 | 66 |
| GO:00032794 | Thyroid | PTC | cardiac septum development | 54/5968 | 103/18723 | 1.17e-05 | 1.29e-04 | 54 |
| GO:00991115 | Thyroid | PTC | microtubule-based transport | 88/5968 | 190/18723 | 2.08e-05 | 2.08e-04 | 88 |
| GO:00163318 | Thyroid | PTC | morphogenesis of embryonic epithelium | 71/5968 | 147/18723 | 2.31e-05 | 2.29e-04 | 71 |
| GO:000736910 | Thyroid | PTC | gastrulation | 84/5968 | 185/18723 | 7.58e-05 | 6.52e-04 | 84 |
| GO:00519608 | Thyroid | PTC | regulation of nervous system development | 177/5968 | 443/18723 | 1.72e-04 | 1.32e-03 | 177 |
| GO:003032317 | Thyroid | PTC | respiratory tube development | 80/5968 | 181/18723 | 3.23e-04 | 2.23e-03 | 80 |
| GO:00032055 | Thyroid | PTC | cardiac chamber development | 72/5968 | 161/18723 | 4.13e-04 | 2.77e-03 | 72 |
| GO:003032419 | Thyroid | PTC | lung development | 77/5968 | 177/18723 | 7.33e-04 | 4.58e-03 | 77 |
| GO:003017810 | Thyroid | PTC | negative regulation of Wnt signaling pathway | 74/5968 | 170/18723 | 8.99e-04 | 5.48e-03 | 74 |
| GO:006054115 | Thyroid | PTC | respiratory system development | 86/5968 | 203/18723 | 1.02e-03 | 6.08e-03 | 86 |
| GO:00900907 | Thyroid | PTC | negative regulation of canonical Wnt signaling pathway | 59/5968 | 137/18723 | 3.76e-03 | 1.80e-02 | 59 |
| GO:00017389 | Thyroid | PTC | morphogenesis of a polarized epithelium | 41/5968 | 94/18723 | 1.10e-02 | 4.38e-02 | 41 |
| GO:0003283 | Thyroid | PTC | atrial septum development | 13/5968 | 23/18723 | 1.25e-02 | 4.88e-02 | 13 |
| GO:001605525 | Thyroid | ATC | Wnt signaling pathway | 234/6293 | 444/18723 | 4.64e-17 | 4.31e-15 | 234 |
| GO:019873825 | Thyroid | ATC | cell-cell signaling by wnt | 234/6293 | 446/18723 | 9.26e-17 | 8.25e-15 | 234 |
| Page: 1 2 3 4 5 6 7 8 |
| Pathway ID | Tissue | Disease Stage | Description | Gene Ratio | Bg Ratio | pvalue | p.adjust | qvalue | Count |
| Page: 1 |
Top |
Cell-cell communication analysis |
| Identification of potential cell-cell interactions between two cell types and their ligand-receptor pairs for different disease states |
| Ligand | Receptor | LRpair | Pathway | Tissue | Disease Stage |
| Page: 1 |
Top |
Single-cell gene regulatory network inference analysis |
| Find out the significant the regulons (TFs) and the target genes of each regulon across cell types for different disease states |
| TF | Cell Type | Tissue | Disease Stage | Target Gene | RSS | Regulon Activity |
| ∗The dot plots of a searched regulon are shown for all cell subpopulations in each disease state of each tissue based on the regulon specific score inferred using pySCENIC and by calculating the average expression. |
| Page: 1 |
Top |
Somatic mutation of malignant transformation related genes |
| Annotation of somatic variants for genes involved in malignant transformation |
| Hugo Symbol | Variant Class | Variant Classification | dbSNP RS | HGVSc | HGVSp | HGVSp Short | SWISSPROT | BIOTYPE | SIFT | PolyPhen | Tumor Sample Barcode | Tissue | Histology | Sex | Age | Stage | Therapy Types | Drugs | Outcome |
| NPHP3 | SNV | Missense_Mutation | novel | c.1655N>A | p.Pro552His | p.P552H | Q7Z494 | protein_coding | deleterious(0) | probably_damaging(1) | TCGA-A7-A0DB-01 | Breast | breast invasive carcinoma | Female | <65 | I/II | Hormone Therapy | arimidex | SD |
| NPHP3 | SNV | Missense_Mutation | rs758498695 | c.988N>A | p.Glu330Lys | p.E330K | Q7Z494 | protein_coding | deleterious(0.03) | probably_damaging(0.969) | TCGA-AC-A23H-01 | Breast | breast invasive carcinoma | Female | >=65 | I/II | Unknown | Unknown | PD |
| NPHP3 | SNV | Missense_Mutation | c.790N>C | p.Asp264His | p.D264H | Q7Z494 | protein_coding | deleterious(0) | probably_damaging(0.937) | TCGA-AC-A23H-01 | Breast | breast invasive carcinoma | Female | >=65 | I/II | Unknown | Unknown | PD | |
| NPHP3 | SNV | Missense_Mutation | c.688N>C | p.Glu230Gln | p.E230Q | Q7Z494 | protein_coding | tolerated(0.05) | benign(0.177) | TCGA-AC-A23H-01 | Breast | breast invasive carcinoma | Female | >=65 | I/II | Unknown | Unknown | PD | |
| NPHP3 | insertion | Frame_Shift_Ins | novel | c.1752_1753insATATATGTGT | p.His585IlefsTer17 | p.H585Ifs*17 | Q7Z494 | protein_coding | TCGA-A8-A0A4-01 | Breast | breast invasive carcinoma | Female | >=65 | I/II | Hormone Therapy | tamoxiphen | CR | ||
| NPHP3 | SNV | Missense_Mutation | c.2800N>A | p.Glu934Lys | p.E934K | Q7Z494 | protein_coding | tolerated(0.34) | benign(0.078) | TCGA-EK-A2PG-01 | Cervix | cervical & endocervical cancer | Female | >=65 | I/II | Unknown | Unknown | SD | |
| NPHP3 | SNV | Missense_Mutation | rs150867534 | c.2986N>A | p.Val996Met | p.V996M | Q7Z494 | protein_coding | tolerated(0.18) | benign(0.059) | TCGA-A6-6654-01 | Colorectum | colon adenocarcinoma | Female | >=65 | III/IV | Chemotherapy | oxaliplatin | SD |
| NPHP3 | SNV | Missense_Mutation | c.982N>C | p.Met328Leu | p.M328L | Q7Z494 | protein_coding | tolerated(0.85) | benign(0) | TCGA-AA-3982-01 | Colorectum | colon adenocarcinoma | Male | >=65 | III/IV | Unknown | Unknown | SD | |
| NPHP3 | SNV | Missense_Mutation | novel | c.2383T>G | p.Ser795Ala | p.S795A | Q7Z494 | protein_coding | tolerated(0.14) | benign(0.005) | TCGA-AA-A010-01 | Colorectum | colon adenocarcinoma | Female | <65 | I/II | Chemotherapy | folinic | CR |
| NPHP3 | SNV | Missense_Mutation | c.1432N>A | p.Gly478Ser | p.G478S | Q7Z494 | protein_coding | tolerated(0.09) | possibly_damaging(0.833) | TCGA-AA-A022-01 | Colorectum | colon adenocarcinoma | Female | >=65 | I/II | Unknown | Unknown | SD |
| Page: 1 2 3 4 5 6 7 8 9 10 |
Top |
Related drugs of malignant transformation related genes |
| Identification of chemicals and drugs interact with genes involved in malignant transfromation |
| (DGIdb 4.0) |
| Entrez ID | Symbol | Category | Interaction Types | Drug Claim Name | Drug Name | PMIDs |
| Page: 1 |

Copyright 2023-Present -The University of Texas Health Science Center at Houston |