Schematic overview of the cellular and molecular mechanisms involved in the cancer progression, including the proposed cellular and molecular mechanisms in cancer cells trajectory. AT1: alveolar type 1 cells; AT2: alveolar type 2 cells; AAH: atypical adenomatous hyperplasia; AIS: adenocarcinoma in situ; MIA: minimally invasive adenocarcinoma; IA: invasive adenocarcinoma; EMT: epithelial-mesenchymal transition

Home

Download

Statistics

Help

Contact

Center for Computational Systems Medicine
leaf

Gene summary

leaf

Malignant transformation analysis

leaf

Malignant transformation related pathway analysis

leaf

Cell-cell communication analysis

leaf

Single-cell gene regulatory network inference analysis

leaf

Somatic mutation of malignant transformation related genes

leaf

Related drugs of malignant transformation related genes

Gene: NEMF

Gene summary for NEMF

check button Gene summary.

Gene informationSpeciesHuman
Gene symbol

NEMF

Gene ID

9147

Gene namenuclear export mediator factor
Gene AliasIDDSAPN
Cytomap14q21.3
Gene Typeprotein-coding
GO ID

GO:0006412

UniProtAcc

O60524


Top

Malignant transformation analysis

check button Identification of the aberrant gene expression in precancerous and cancerous lesions by comparing the gene expression of stem-like cells in diseased tissues with normal stem cells
check button Malignant transformation involving gene list.
Entrez IDSymbolReplicatesSpeciesOrganTissueAdj P-valueLog2FCMalignancy
9147NEMFHTA11_3410_2000001011HumanColorectumAD2.74e-14-5.81e-010.0155
9147NEMFHTA11_3361_2000001011HumanColorectumAD5.69e-04-5.15e-01-0.1207
9147NEMFHTA11_696_2000001011HumanColorectumAD1.17e-02-3.11e-01-0.1464
9147NEMFHTA11_866_3004761011HumanColorectumAD7.03e-04-3.83e-010.096
9147NEMFHTA11_8622_2000001021HumanColorectumSER2.95e-03-6.18e-010.0528
9147NEMFHTA11_7696_3000711011HumanColorectumAD1.45e-06-4.14e-010.0674
9147NEMFHTA11_99999970781_79442HumanColorectumMSS7.00e-16-5.43e-010.294
9147NEMFHTA11_99999971662_82457HumanColorectumMSS5.67e-07-4.21e-010.3859
9147NEMFHTA11_99999973899_84307HumanColorectumMSS6.74e-06-6.52e-010.2585
9147NEMFHTA11_99999974143_84620HumanColorectumMSS8.24e-06-4.38e-010.3005
9147NEMFF007HumanColorectumFAP7.19e-03-4.27e-020.1176
9147NEMFA001-C-207HumanColorectumFAP2.11e-04-8.76e-020.1278
9147NEMFA015-C-203HumanColorectumFAP5.73e-31-2.19e-01-0.1294
9147NEMFA015-C-204HumanColorectumFAP8.62e-10-2.88e-01-0.0228
9147NEMFA014-C-040HumanColorectumFAP7.95e-06-6.51e-02-0.1184
9147NEMFA002-C-201HumanColorectumFAP4.61e-17-1.63e-010.0324
9147NEMFA002-C-203HumanColorectumFAP1.13e-06-1.48e-010.2786
9147NEMFA001-C-119HumanColorectumFAP8.11e-096.68e-02-0.1557
9147NEMFA001-C-108HumanColorectumFAP8.83e-194.06e-02-0.0272
9147NEMFA002-C-205HumanColorectumFAP7.66e-29-5.02e-02-0.1236
Page: 1 2 3 4 5 6 7 8 9 10 11 

check button Transcriptomic changes along malignancy continuum.
TissueExpression DynamicsAbbreviation
Colorectum (GSE201348)The image shows the transcriptomic changes along malignancy continuum.log2FC in expression of this searched gene in stem-like cells from each diseased tissue sample relative to stem-like cells in normal samples in each tissue plotted against the malignancy continuum. Samples are colored based on if they are from different disease stage.
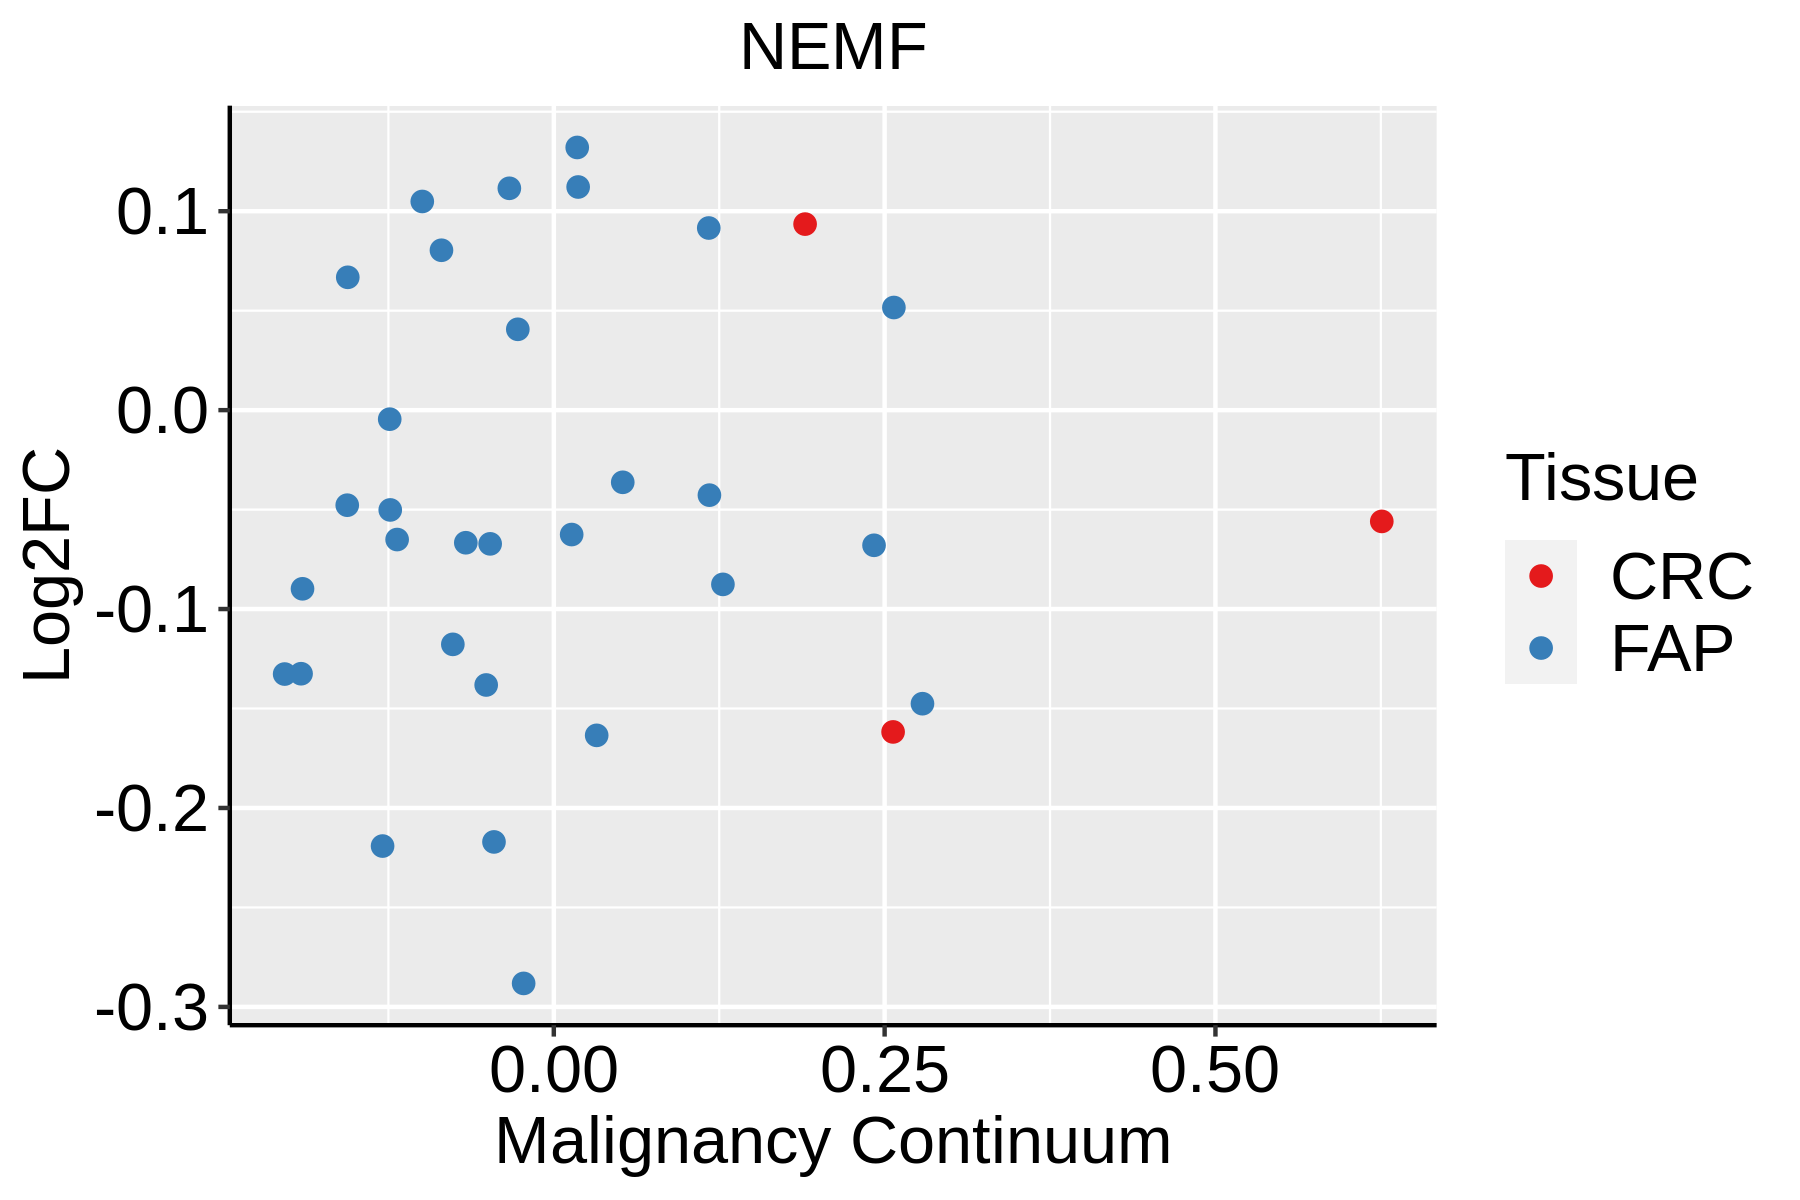
FAP: Familial adenomatous polyposis
CRC: Colorectal cancer
Colorectum (HTA11)The image shows the transcriptomic changes along malignancy continuum.log2FC in expression of this searched gene in stem-like cells from each diseased tissue sample relative to stem-like cells in normal samples in each tissue plotted against the malignancy continuum. Samples are colored based on if they are from different disease stage.AD: Adenomas
SER: Sessile serrated lesions
MSI-H: Microsatellite-high colorectal cancer
MSS: Microsatellite stable colorectal cancer
EsophagusThe image shows the transcriptomic changes along malignancy continuum.log2FC in expression of this searched gene in stem-like cells from each diseased tissue sample relative to stem-like cells in normal samples in each tissue plotted against the malignancy continuum. Samples are colored based on if they are from different disease stage.ESCC: Esophageal squamous cell carcinoma
HGIN: High-grade intraepithelial neoplasias
LGIN: Low-grade intraepithelial neoplasias
LiverThe image shows the transcriptomic changes along malignancy continuum.log2FC in expression of this searched gene in stem-like cells from each diseased tissue sample relative to stem-like cells in normal samples in each tissue plotted against the malignancy continuum. Samples are colored based on if they are from different disease stage.HCC: Hepatocellular carcinoma
NAFLD: Non-alcoholic fatty liver disease
LungThe image shows the transcriptomic changes along malignancy continuum.log2FC in expression of this searched gene in stem-like cells from each diseased tissue sample relative to stem-like cells in normal samples in each tissue plotted against the malignancy continuum. Samples are colored based on if they are from different disease stage.
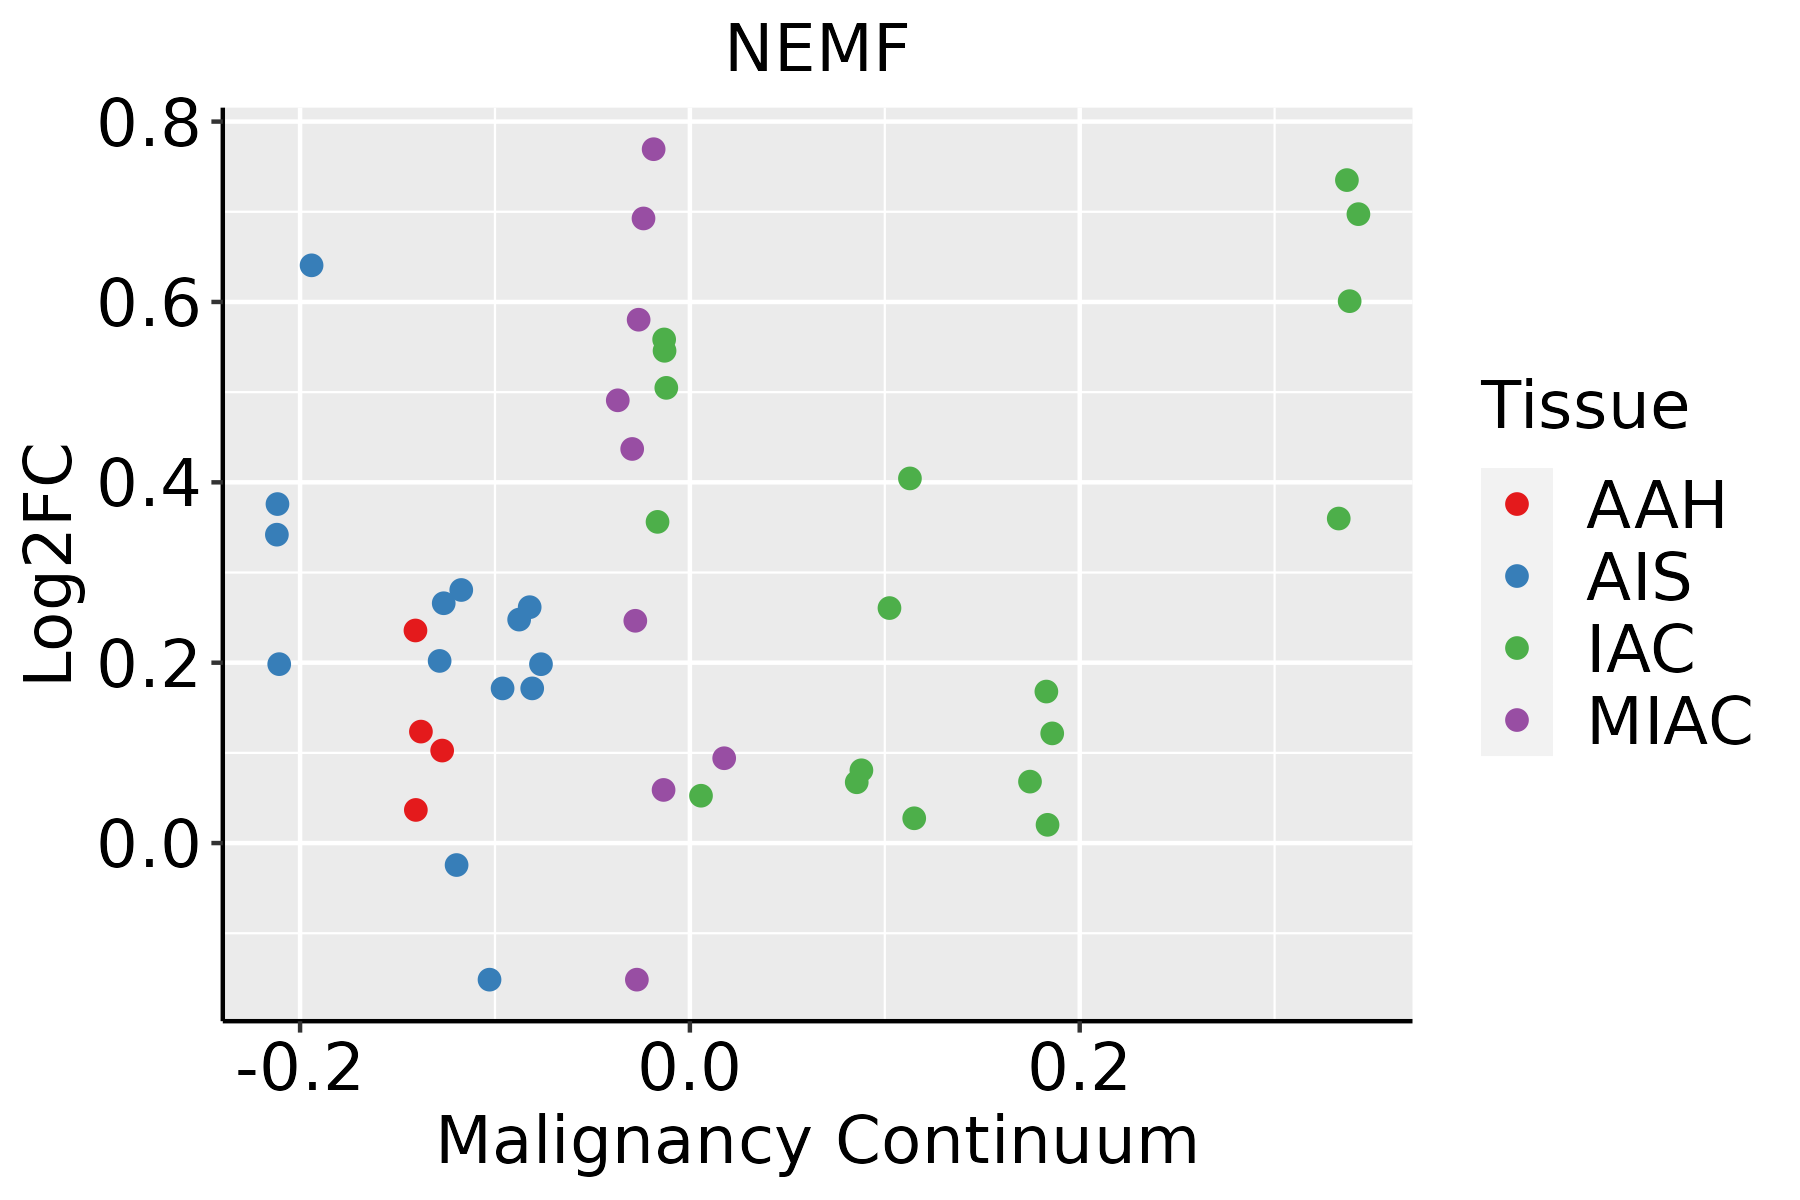
AAH: Atypical adenomatous hyperplasia
AIS: Adenocarcinoma in situ
IAC: Invasive lung adenocarcinoma
MIA: Minimally invasive adenocarcinoma
Oral CavityThe image shows the transcriptomic changes along malignancy continuum.log2FC in expression of this searched gene in stem-like cells from each diseased tissue sample relative to stem-like cells in normal samples in each tissue plotted against the malignancy continuum. Samples are colored based on if they are from different disease stage.
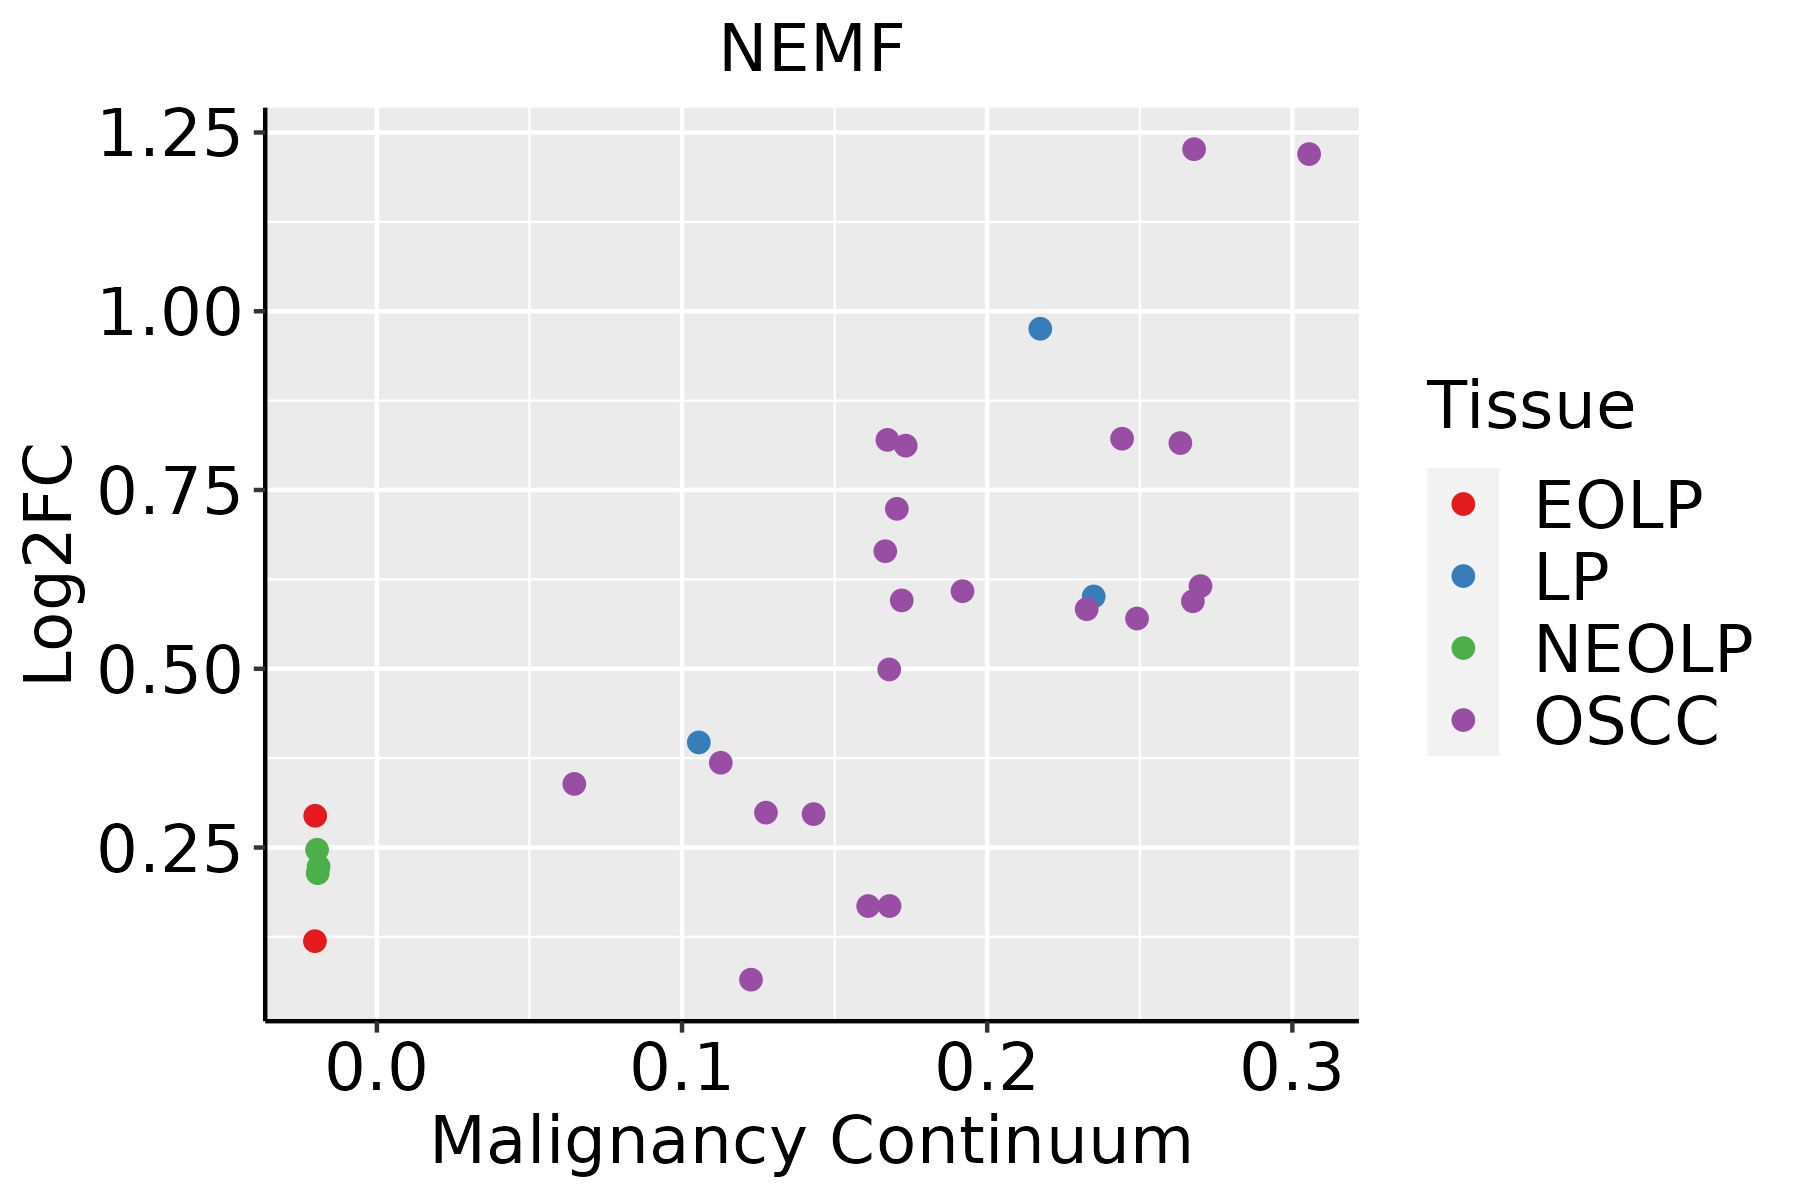
EOLP: Erosive Oral lichen planus
LP: leukoplakia
NEOLP: Non-erosive oral lichen planus
OSCC: Oral squamous cell carcinoma
ProstateThe image shows the transcriptomic changes along malignancy continuum.log2FC in expression of this searched gene in stem-like cells from each diseased tissue sample relative to stem-like cells in normal samples in each tissue plotted against the malignancy continuum. Samples are colored based on if they are from different disease stage.
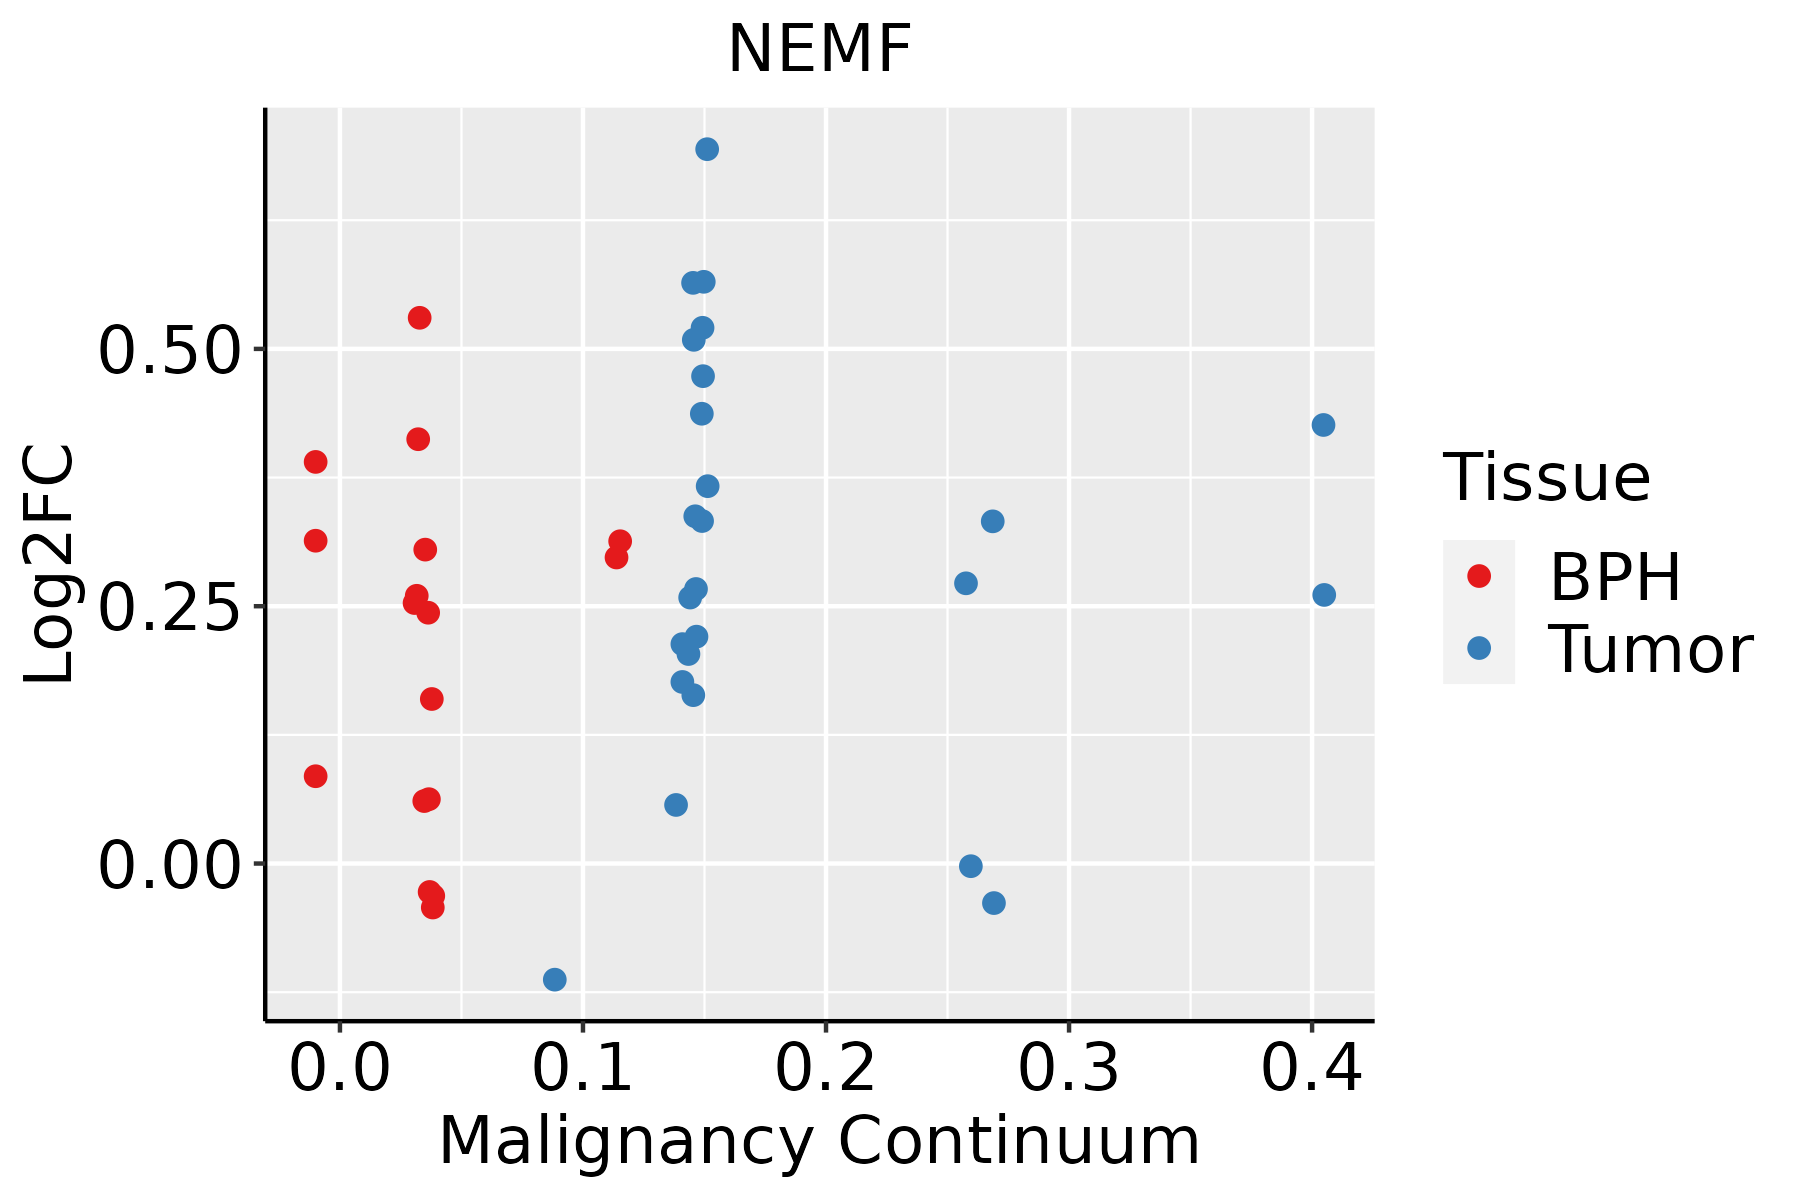
BPH: Benign Prostatic Hyperplasia
SkinThe image shows the transcriptomic changes along malignancy continuum.log2FC in expression of this searched gene in stem-like cells from each diseased tissue sample relative to stem-like cells in normal samples in each tissue plotted against the malignancy continuum. Samples are colored based on if they are from different disease stage.
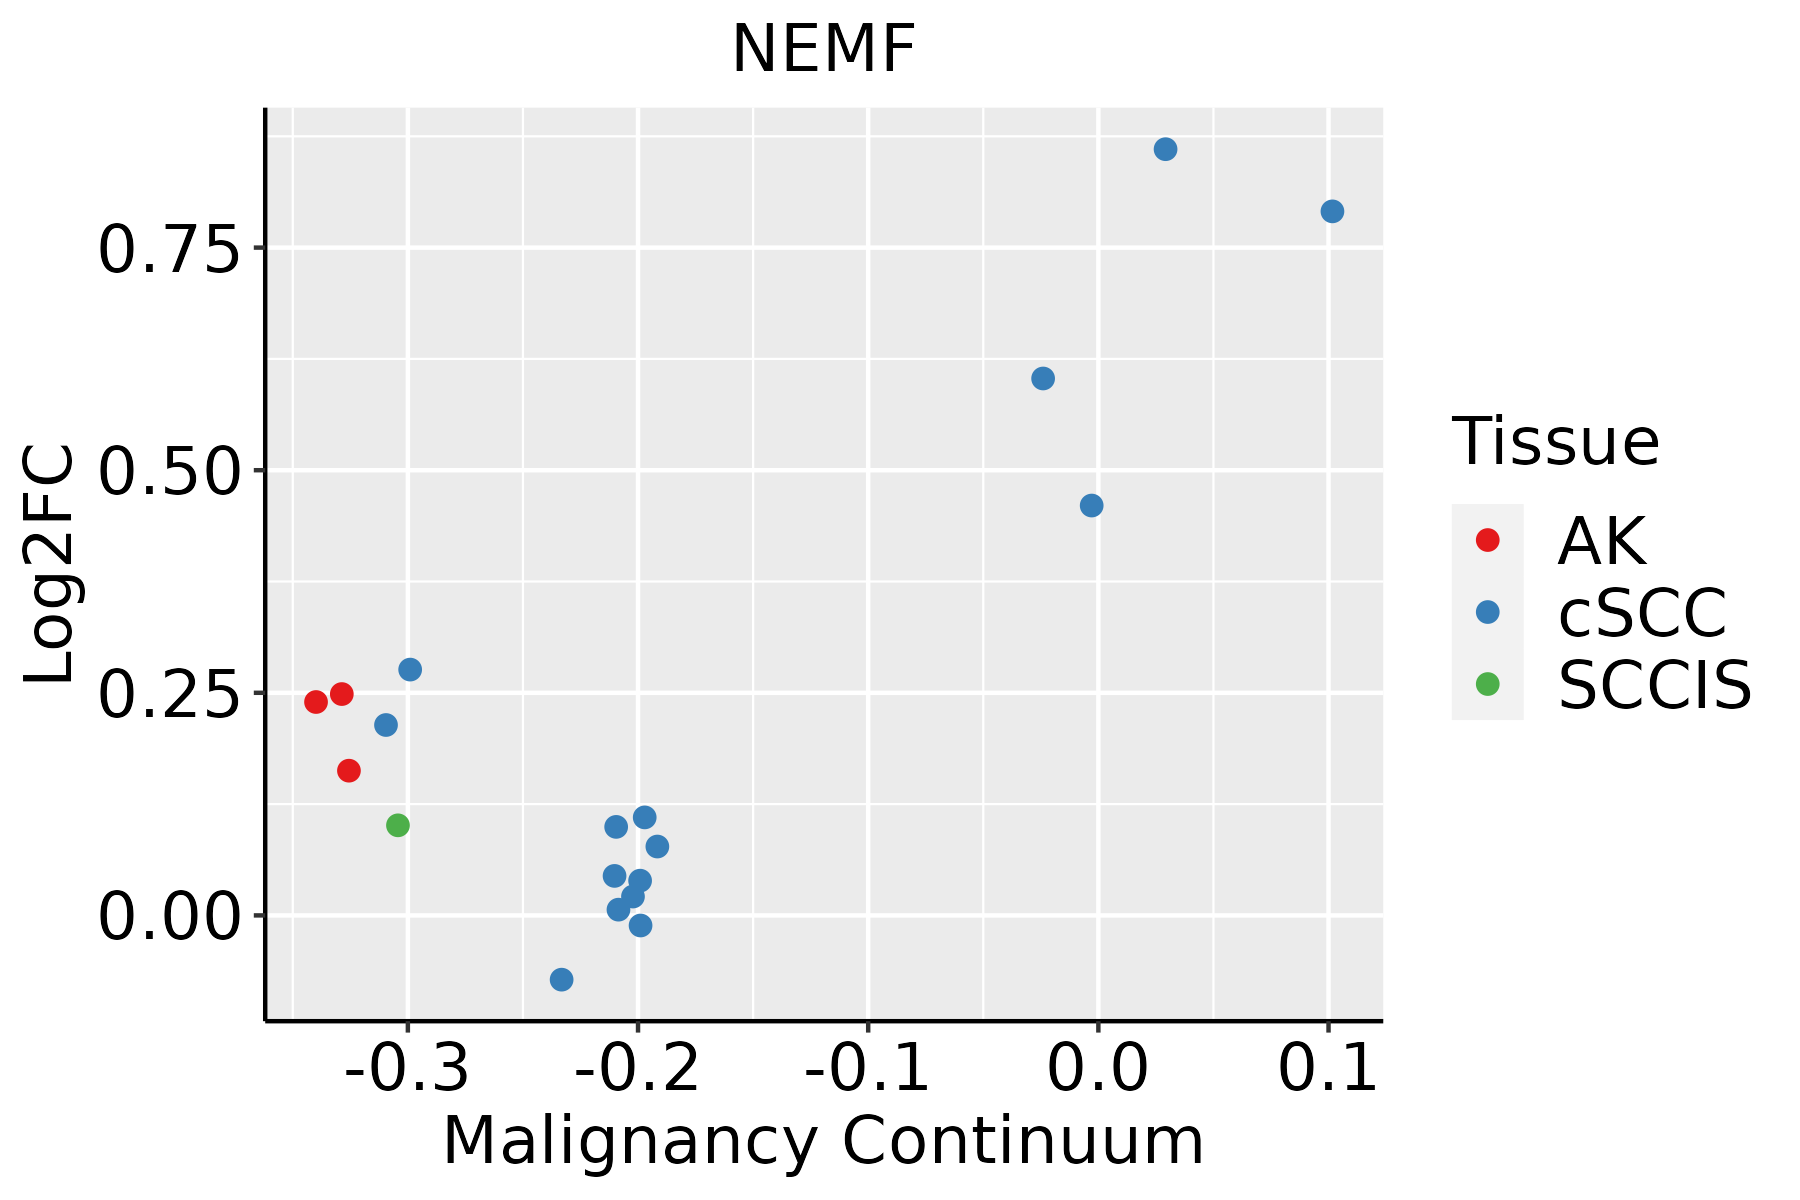
AK: Actinic keratosis
cSCC: Cutaneous squamous cell carcinoma
SCCIS:squamous cell carcinoma in situ
ThyroidThe image shows the transcriptomic changes along malignancy continuum.log2FC in expression of this searched gene in stem-like cells from each diseased tissue sample relative to stem-like cells in normal samples in each tissue plotted against the malignancy continuum. Samples are colored based on if they are from different disease stage.ATC: Anaplastic thyroid cancer
HT: Hashimoto's thyroiditis
PTC: Papillary thyroid cancer
∗log2FC in expression of this searched gene in stem-like cells from each diseased tissue sample relative to stem-like cells in normal samples in each tissue plotted against the malignancy continuum. Samples are colored based on if they are from different disease stage.

Top

Malignant transformation related pathway analysis

check buttonFind out the enriched GO biological processes and KEGG pathways involved in transition from healthy to precancer to cancer
check button Figure of enriched GO biological processes.
TissueDisease StageEnriched GO biological Processes
ColorectumADGO analysis - Figure of enriched GO biological processes: Top 15 enriched GO BP terms are showed in the bar plot of each disease state in each tissue. Each row represents a significant GO biological process which is colored according to the -log10(p.adjust).
ColorectumSERGO analysis - Figure of enriched GO biological processes: Top 15 enriched GO BP terms are showed in the bar plot of each disease state in each tissue. Each row represents a significant GO biological process which is colored according to the -log10(p.adjust).
ColorectumMSSGO analysis - Figure of enriched GO biological processes: Top 15 enriched GO BP terms are showed in the bar plot of each disease state in each tissue. Each row represents a significant GO biological process which is colored according to the -log10(p.adjust).
ColorectumMSI-HGO analysis - Figure of enriched GO biological processes: Top 15 enriched GO BP terms are showed in the bar plot of each disease state in each tissue. Each row represents a significant GO biological process which is colored according to the -log10(p.adjust).
ColorectumFAPGO analysis - Figure of enriched GO biological processes: Top 15 enriched GO BP terms are showed in the bar plot of each disease state in each tissue. Each row represents a significant GO biological process which is colored according to the -log10(p.adjust).
∗Top 15 enriched GO BP terms are showed in the bar plot of each disease state in each tissue. Each row represents a significant GO biological process which is colored according to the -log10(p.adjust).
Page: 1 2 3 4 5 6 7 8 9 

check button Enriched GO biological processes.
GO IDTissueDisease StageDescriptionGene RatioBg Ratiopvaluep.adjustCount
GO:005116923Oral cavityEOLPnuclear transport87/2218301/187237.30e-164.37e-1387
GO:000641726Oral cavityEOLPregulation of translation108/2218468/187234.04e-127.34e-10108
GO:001049825Oral cavityEOLPproteasomal protein catabolic process108/2218490/187237.79e-119.51e-09108
GO:005116824Oral cavityEOLPnuclear export47/2218154/187234.45e-103.76e-0847
GO:004316125Oral cavityEOLPproteasome-mediated ubiquitin-dependent protein catabolic process92/2218412/187239.87e-106.96e-0892
GO:000641422Oral cavityEOLPtranslational elongation17/221855/187231.36e-041.48e-0317
GO:000691331Oral cavityNEOLPnucleocytoplasmic transport75/2005301/187231.56e-123.20e-1075
GO:005116931Oral cavityNEOLPnuclear transport75/2005301/187231.56e-123.20e-1075
GO:001049831Oral cavityNEOLPproteasomal protein catabolic process103/2005490/187231.08e-111.65e-09103
GO:004316131Oral cavityNEOLPproteasome-mediated ubiquitin-dependent protein catabolic process89/2005412/187236.27e-117.44e-0989
GO:000641734Oral cavityNEOLPregulation of translation97/2005468/187239.94e-111.05e-0897
GO:005116832Oral cavityNEOLPnuclear export41/2005154/187232.35e-081.03e-0641
GO:000641431Oral cavityNEOLPtranslational elongation15/200555/187234.94e-044.39e-0315
GO:000641718ProstateBPHregulation of translation157/3107468/187239.09e-205.63e-17157
GO:001049818ProstateBPHproteasomal protein catabolic process153/3107490/187234.13e-167.51e-14153
GO:004316118ProstateBPHproteasome-mediated ubiquitin-dependent protein catabolic process127/3107412/187233.84e-133.60e-11127
GO:000691315ProstateBPHnucleocytoplasmic transport92/3107301/187231.09e-094.84e-0892
GO:005116915ProstateBPHnuclear transport92/3107301/187231.09e-094.84e-0892
GO:005116815ProstateBPHnuclear export46/3107154/187232.86e-053.32e-0446
GO:000641410ProstateBPHtranslational elongation20/310755/187233.18e-042.43e-0320
Page: 1 2 3 4 5 6 7 8 

check button Enriched KEGG pathways.
Pathway IDTissueDisease StageDescriptionGene RatioBg Ratiopvaluep.adjustqvalueCount
Page: 1 

Top

Cell-cell communication analysis

check buttonIdentification of potential cell-cell interactions between two cell types and their ligand-receptor pairs for different disease states
LigandReceptorLRpairPathwayTissueDisease Stage
Page: 1 

Top

Single-cell gene regulatory network inference analysis

check buttonFind out the significant the regulons (TFs) and the target genes of each regulon across cell types for different disease states
TFCell TypeTissueDisease StageTarget GeneRSSRegulon Activity
∗The dot plots of a searched regulon are shown for all cell subpopulations in each disease state of each tissue based on the regulon specific score inferred using pySCENIC and by calculating the average expression.
Page: 1 

Top

Somatic mutation of malignant transformation related genes

check buttonAnnotation of somatic variants for genes involved in malignant transformation
Hugo SymbolVariant ClassVariant ClassificationdbSNP RSHGVScHGVSpHGVSp ShortSWISSPROTBIOTYPESIFTPolyPhenTumor Sample BarcodeTissueHistologySexAgeStageTherapy TypesDrugsOutcome
NEMFSNVMissense_Mutationnovelc.934N>Tp.Ala312Serp.A312SO60524protein_codingtolerated(0.09)benign(0.259)TCGA-AN-A046-01Breastbreast invasive carcinomaFemale>=65I/IIUnknownUnknownSD
NEMFSNVMissense_Mutationc.788C>Tp.Pro263Leup.P263LO60524protein_codingdeleterious(0.03)benign(0.124)TCGA-AR-A1AV-01Breastbreast invasive carcinomaMale>=65I/IIChemotherapycytoxanSD
NEMFSNVMissense_Mutationc.2301N>Tp.Met767Ilep.M767IO60524protein_codingtolerated(0.19)benign(0)TCGA-B6-A0X5-01Breastbreast invasive carcinomaFemale<65I/IIUnknownUnknownPD
NEMFSNVMissense_Mutationc.1624N>Gp.Ile542Valp.I542VO60524protein_codingdeleterious(0.03)benign(0.073)TCGA-BH-A1F6-01Breastbreast invasive carcinomaFemale<65III/IVUnknownUnknownSD
NEMFSNVMissense_Mutationrs370320203c.1828N>Gp.Thr610Alap.T610AO60524protein_codingtolerated(0.13)possibly_damaging(0.669)TCGA-2W-A8YY-01Cervixcervical & endocervical cancerFemale<65I/IIChemotherapycisplatinCR
NEMFSNVMissense_Mutationrs760379976c.1634N>Ap.Arg545Glnp.R545QO60524protein_codingdeleterious(0)probably_damaging(0.989)TCGA-2W-A8YY-01Cervixcervical & endocervical cancerFemale<65I/IIChemotherapycisplatinCR
NEMFSNVMissense_Mutationrs764224132c.1763G>Ap.Arg588Glnp.R588QO60524protein_codingdeleterious(0.01)probably_damaging(0.957)TCGA-DS-A1OB-01Cervixcervical & endocervical cancerFemale<65I/IIChemotherapycarboplatinPD
NEMFSNVMissense_Mutationnovelc.2762N>Ap.Pro921Hisp.P921HO60524protein_codingtolerated(0.08)benign(0.031)TCGA-EA-A410-01Cervixcervical & endocervical cancerFemale<65I/IIUnknownUnknownSD
NEMFSNVMissense_Mutationc.2021N>Ap.Arg674Lysp.R674KO60524protein_codingtolerated(0.84)benign(0)TCGA-EA-A78R-01Cervixcervical & endocervical cancerFemale<65I/IIUnknownUnknownSD
NEMFSNVMissense_Mutationc.2781G>Cp.Gln927Hisp.Q927HO60524protein_codingdeleterious(0.02)benign(0.365)TCGA-IR-A3LH-01Cervixcervical & endocervical cancerFemale<65I/IIChemotherapycisplatinCR
Page: 1 2 3 4 5 6 7 8 9 10 

Top

Related drugs of malignant transformation related genes

check buttonIdentification of chemicals and drugs interact with genes involved in malignant transfromation
(DGIdb 4.0)
Entrez IDSymbolCategoryInteraction TypesDrug Claim NameDrug NamePMIDs
Page: 1